

 |
市場調查報告書
商品編碼
1913434
視訊點播市場機會、成長要素、產業趨勢分析及2026年至2035年預測Video on Demand Market Opportunity, Growth Drivers, Industry Trend Analysis, and Forecast 2026 - 2035 |
||||||
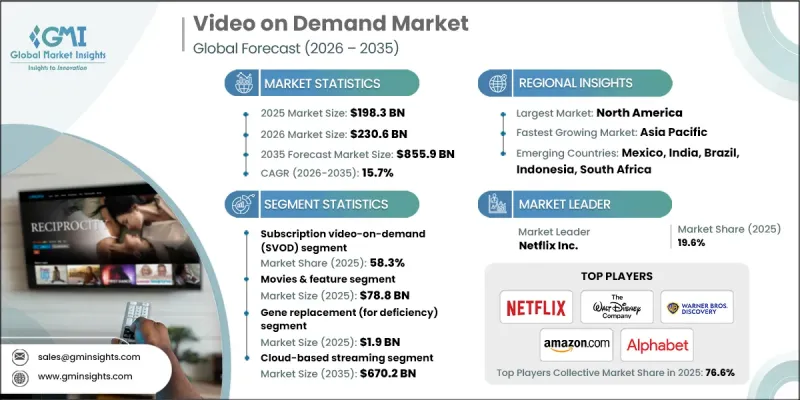
全球視訊點播市場預計到 2025 年將達到 1,983 億美元,到 2035 年將達到 8,559 億美元,年複合成長率為 15.7%。
這一成長得益於高速網際網路連接的普及和基於雲端的內容傳送架構的日益廣泛應用。消費者越來越傾向於靈活地獲取娛樂內容,以適應他們的日程安排和生活方式,這顯著提升了他們對行動觀看和個人化觀看體驗的需求。串流品質、使用者介面和連網設備生態系統的持續改進,正在推動各個年齡層使用者群體的廣泛接受。智慧電視、行動裝置和多螢幕環境正在改變人們的內容消費習慣,使用戶能夠跨平台無縫存取影片內容。對網路基礎設施和串流媒體技術的投資不斷提升可靠性並改善觀看品質。隨著數位娛樂生態系統的日趨成熟,在不斷變化的消費者期望和技術創新的推動下,隨選視訊平台正成為全球媒體消費的中心。
| 市場覆蓋範圍 | |
|---|---|
| 開始年份 | 2025 |
| 預測年份 | 2026-2035 |
| 起始值 | 1983億美元 |
| 預測金額 | 8559億美元 |
| 複合年成長率 | 15.7% |
內容傳遞網路、自適應串流技術和跨裝置相容性的持續進步不斷增強著視訊點播生態系統。各平台正投入大量資源升級基礎設施,以確保穩定的性能和高品質的播放。視訊點播服務使用戶能夠自由選擇何時以及如何觀看內容,並提供靈活的存取模式,包括跨多個裝置的訂閱模式和廣告支援模式。
截至2025年,訂閱式隨選視訊市場佔了58.3%的市佔率。這種模式之所以能保持其主導地位,是因為它能夠產生穩定的經常性收入,從而可以持續投資於獨家內容和平台升級。已開發地區和新興地區的高滲透率都表明,消費者對無限量點播娛樂內容有著強烈的偏好。
預計到 2025 年,電影和電影長片市場將創造 788 億美元的收入,到 2035 年將達到 3,210 億美元。對優質影片、原創作品和豐富內容庫的需求持續推動著全球市場的參與度和平台差異化。
到2025年,北美隨選視訊市場將佔全球隨選視訊市場總額的37.2%。強大的數位基礎設施、有利的法規環境和高寬頻普及率支撐了該地區的優勢。成熟的內容生態系統以及消費者對個人化觀看體驗和OTT服務的偏好轉變,將持續推動市場成長。
目錄
第1章調查方法
第2章執行摘要
第3章業界考察
- 生態系分析
- 供應商情況
- 利潤率分析
- 成本結構
- 每個階段的附加價值
- 影響價值鏈的因素
- 中斷
- 產業影響因素
- 促進要素
- 擴展高速寬頻和5G基礎設施
- 智慧型裝置和聯網電視的普及率不斷提高
- 加大對原創和獨家內容的投入
- 廣告支援型串流模式(AVOD/混合模式)的成長
- 與通訊業者和設備製造商建立策略合作夥伴關係
- 產業潛在風險與挑戰
- 高成本的內容取得和製作成本會影響盈利。
- 激烈的競爭會導致用戶流失和價格壓力。
- 市場機遇
- 拓展新興市場
- 廣告支援型和混合型串流模式的成長
- 人工智慧驅動的個人化和內容推薦整合
- 拓展至直播及互動內容形式
- 促進要素
- 成長潛力分析
- 監管環境
- 北美洲
- 歐洲
- 亞太地區
- 拉丁美洲
- 中東和非洲
- 波特五力分析
- PESTEL 分析
- 科技與創新趨勢
- 當前技術趨勢
- 新興技術
- 新興經營模式
- 合規要求
- 專利和智慧財產權分析
- 地緣政治和貿易趨勢
第4章 競爭情勢
- 介紹
- 公司市佔率分析
- 按地區
- 北美洲
- 歐洲
- 亞太地區
- 拉丁美洲
- 中東和非洲
- 按地區
- 主要企業的競爭標竿分析
- 財務績效比較
- 收入
- 利潤率
- 研究與開發
- 產品系列比較
- 產品線的廣度
- 科技
- 創新
- 按地區比較存在狀況
- 全球擴張分析
- 服務網路覆蓋
- 按地區分類的市場滲透率
- 競爭定位矩陣
- 領導企業
- 受讓人
- 追蹤者
- 小眾玩家
- 戰略展望矩陣
- 財務績效比較
- 2022-2025 年主要發展動態
- 併購
- 合作夥伴關係和合資企業
- 技術進步
- 擴張與投資策略
- 數位轉型計劃
- 新興/Start-Ups競賽的趨勢
第5章 依服務模式分類的市場估算與預測,2022-2035年
- 訂閱視訊點播 (SVOD)
- 廣告支援的視訊點播(AVOD)
- 交易型視訊點播 (TVOD)
- 按次付費觀看(PPV)
- 混合視訊點播(VoD)模式
6. 按內容類型分類的市場估算與預測,2022-2035 年
- 電影和電影長片
- 電視劇
- 運動的
- 新聞和直播
- 兒童與教育內容
- 其他
第7章 按設備分類的市場估算與預測,2022-2035年
- 智慧型手機和平板電腦
- 智慧電視
- 筆記型電腦和桌上型電腦
- OTT串流媒體設備
- 其他
第8章 依實施類型分類的市場估算與預測,2022-2035年
- 基於雲端的串流媒體
- 本地部署/託管串流媒體解決方案
- 混合內容傳遞網路
9. 依最終用途分類的市場估計與預測,2022-2035 年
- 個人消費者
- 企業和機構教育
第10章 2022-2035年各地區市場估計與預測
- 北美洲
- 美國
- 加拿大
- 歐洲
- 德國
- 英國
- 法國
- 義大利
- 西班牙
- 荷蘭
- 亞太地區
- 中國
- 印度
- 日本
- 澳洲
- 韓國
- 拉丁美洲
- 巴西
- 墨西哥
- 阿根廷
- 中東和非洲
- 南非
- 沙烏地阿拉伯
- 阿拉伯聯合大公國
第11章:公司簡介
- Alibaba Group Holding Ltd.
- Alphabet Inc.
- Amazon.com, Inc.
- Apple Inc.
- Baidu, Inc.
- British Broadcasting Corporation(BBC)
- Comcast Corporation
- Fandango Media, LLC
- Fox Corporation
- ITV plc
- Netflix Inc.
- Paramount Global
- Roku, Inc.
- Sony Group Corporation
- Telefonica SA
- Tencent Holdings Ltd.
- The Walt Disney Company
- Vivendi SE
- Warner Bros. Discovery, Inc.
- Zee Entertainment Enterprises Ltd.
The Global Video on Demand Market was valued at USD 198.3 billion in 2025 and is estimated to grow at a CAGR of 15.7% to reach USD 855.9 billion by 2035.
The growth is driven by the widespread availability of high-speed internet connectivity and the growing adoption of cloud-based content delivery architectures. Consumers increasingly prefer flexible access to entertainment that fits their schedules and lifestyles, which has significantly increased demand for on-the-go and personalized viewing experiences. Continuous improvements in streaming quality, user interfaces, and connected device ecosystems have expanded adoption across all age groups. Smart televisions, mobile devices, and multi-screen environments are reshaping content consumption habits, allowing viewers to access video content seamlessly across platforms. Investments in network infrastructure and streaming technologies continue to strengthen reliability and viewing quality. As digital entertainment ecosystems mature, video on demand platforms are becoming central to global media consumption, supported by evolving consumer expectations and technological innovation.
| Market Scope | |
|---|---|
| Start Year | 2025 |
| Forecast Year | 2026-2035 |
| Start Value | $198.3 Billion |
| Forecast Value | $855.9 Billion |
| CAGR | 15.7% |
Ongoing advancements in content delivery networks, adaptive streaming technologies, and cross-device compatibility continue to reinforce the video-on-demand ecosystem. Platforms are dedicating significant resources to infrastructure upgrades to ensure consistent performance and high-quality playback. Video on demand services allow users to choose when and how they consume content, offering flexible access models that include subscription-based and advertising-supported options across multiple devices.
The subscription-based video on demand segment accounted for 58.3% share in 2025. This model remains dominant due to its ability to generate stable recurring revenue, enabling continuous investment in exclusive programming and platform enhancements. High adoption levels across developed and emerging regions highlight strong consumer preference for unlimited, on-demand access to entertainment content.
The movies and feature films segment generated USD 78.8 billion in 2025 and is projected to reach USD 321 billion by 2035. Demand for premium releases, original productions, and extensive content libraries continues to drive engagement and platform differentiation across global markets.
North America Video on Demand Market held a 37.2% share of the global video on demand market in 2025. Strong digital infrastructure, favorable regulatory conditions, and high broadband penetration support regional dominance. Mature content ecosystems and shifting consumer preferences toward personalized viewing and over-the-top services continue to accelerate growth.
Key companies operating in the Global Video on Demand Market include Netflix Inc., Amazon.com, Inc., The Walt Disney Company, Alphabet Inc., Apple Inc., Tencent Holdings Ltd., Sony Group Corporation, Warner Bros. Discovery, Inc., Paramount Global, Comcast Corporation, Roku, Inc., Alibaba Group Holding Ltd., Fox Corporation, British Broadcasting Corporation, Vivendi SE, Telefonica S.A., ITV plc, Baidu, Inc., Fandango Media, LLC, and Zee Entertainment Enterprises Ltd. These companies compete through content investment, technology leadership, and global reach. Companies in the Global Video on Demand Market are strengthening their market position by prioritizing innovation, sustainability, and consumer convenience. Manufacturers are focusing on developing durable, ergonomic, and efficient products that address evolving household needs. Sustainability-driven strategies, including reduced material usage and recyclable components, are gaining importance.
Table of Contents
Chapter 1 Methodology
- 1.1 Market scope and definition
- 1.2 Research design
- 1.2.1 Research approach
- 1.2.2 Data collection methods
- 1.3 Data mining sources
- 1.3.1 Global
- 1.3.2 Regional/Country
- 1.4 Base estimates and calculations
- 1.4.1 Base year calculation
- 1.4.2 Key trends for market estimation
- 1.5 Primary research and validation
- 1.5.1 Primary sources
- 1.6 Forecast model
- 1.7 Research assumptions and limitations
Chapter 2 Executive Summary
- 2.1 Industry 3600 synopsis, 2022 - 2035
- 2.2 Key market trends
- 2.2.1 Business trends
- 2.2.2 Service model trends
- 2.2.3 Content type trends
- 2.2.4 Device trends
- 2.2.5 Deployment trends
- 2.2.6 End User trends
- 2.2.7 Regional trends
- 2.3 TAM analysis, 2026-2035
- 2.4 CXO perspectives: Strategic imperatives
- 2.4.1 Executive decision points
- 2.4.2 Critical success factors
- 2.5 Future outlook and strategic recommendations
Chapter 3 Industry Insights
- 3.1 Industry ecosystem analysis
- 3.1.1 Supplier landscape
- 3.1.2 Profit margin analysis
- 3.1.3 Cost structure
- 3.1.4 Value addition at each stage
- 3.1.5 Factor affecting the value chain
- 3.1.6 Disruptions
- 3.2 Industry impact forces
- 3.2.1 Growth drivers
- 3.2.1.1 Expanding High-Speed Broadband and 5G Infrastructure
- 3.2.1.2 Rising Adoption of Smart Devices and Connected TVs
- 3.2.1.3 Increasing Investments in Original and Exclusive Content
- 3.2.1.4 Growth of Ad-Supported Streaming Models (AVOD/Hybrid Plans)
- 3.2.1.5 Strategic Partnerships with Telecom Operators and Device Manufacturers
- 3.2.2 Industry pitfalls and challenges
- 3.2.2.1 High Content Acquisition and Production Costs Impacting Profitability
- 3.2.2.2 Intense Competition Leading to Subscriber Churn and Pricing Pressure
- 3.2.3 Market opportunities
- 3.2.3.1 Expansion into emerging markets
- 3.2.3.2 Growth of ad-supported and hybrid streaming models
- 3.2.3.3 Integration of AI-driven personalization and content recommendation
- 3.2.3.4 Expansion into live streaming and interactive content formats
- 3.2.1 Growth drivers
- 3.3 Growth potential analysis
- 3.4 Regulatory landscape
- 3.4.1 North America
- 3.4.2 Europe
- 3.4.3 Asia Pacific
- 3.4.4 Latin America
- 3.4.5 Middle East & Africa
- 3.5 Porter's analysis
- 3.6 PESTEL analysis
- 3.7 Technology and innovation landscape
- 3.7.1 Current technological trends
- 3.7.2 Emerging technologies
- 3.8 Emerging business models
- 3.9 Compliance requirements
- 3.10 Patent and IP analysis
- 3.11 Geopolitical and trade dynamics
Chapter 4 Competitive Landscape, 2025
- 4.1 Introduction
- 4.2 Company market share analysis
- 4.2.1 By region
- 4.2.1.1 North America
- 4.2.1.2 Europe
- 4.2.1.3 Asia Pacific
- 4.2.1.4 Latin America
- 4.2.1.5 Middle East & Africa
- 4.2.1 By region
- 4.3 Competitive benchmarking of key players
- 4.3.1 Financial performance comparison
- 4.3.1.1 Revenue
- 4.3.1.2 Profit margin
- 4.3.1.3 R&D
- 4.3.2 Product portfolio comparison
- 4.3.2.1 Product range breadth
- 4.3.2.2 Technology
- 4.3.2.3 Innovation
- 4.3.3 Geographic presence comparison
- 4.3.3.1 Global footprint analysis
- 4.3.3.2 Service network coverage
- 4.3.3.3 Market penetration by region
- 4.3.4 Competitive positioning matrix
- 4.3.4.1 Leaders
- 4.3.4.2 Challengers
- 4.3.4.3 Followers
- 4.3.4.4 Niche players
- 4.3.5 Strategic outlook matrix
- 4.3.1 Financial performance comparison
- 4.4 Key developments, 2022-2025
- 4.4.1 Mergers and acquisitions
- 4.4.2 Partnerships and collaborations
- 4.4.3 Technological advancements
- 4.4.4 Expansion and investment strategies
- 4.4.5 Digital transformation initiatives
- 4.5 Emerging/ startup competitors landscape
Chapter 5 Market Estimates and Forecast, By Service Model, 2022 - 2035 (USD Billion)
- 5.1 Key trends
- 5.2 Subscription Video on Demand (SVOD)
- 5.3 Advertising-Supported Video on Demand (AVOD)
- 5.4 Transactional Video on Demand (TVOD)
- 5.5 Pay-Per-View (PPV)
- 5.6 Hybrid VoD Models
Chapter 6 Market Estimates and Forecast, By Content Type, 2022 - 2035 (USD Billion)
- 6.1 Key trends
- 6.2 Movies & feature films
- 6.3 TV series
- 6.4 Sports
- 6.5 News & live broadcasts
- 6.6 Kids & educational content
- 6.7 Others
Chapter 7 Market Estimates and Forecast, By Device, 2022 - 2035 (USD Billion)
- 7.1 Key trends
- 7.2 Smartphones & tablets
- 7.3 Smart TVs
- 7.4 Laptops & desktops
- 7.5 OTT streaming devices
- 7.6 Others
Chapter 8 Market Estimates and Forecast, By Deployment, 2022 - 2035 (USD Billion)
- 8.1 Key trends
- 8.2 Cloud-based streaming
- 8.3 On-premise/managed streaming solutions
- 8.4 Hybrid content delivery networks
Chapter 9 Market Estimates and Forecast, By End Use, 2022 - 2035 (USD Billion)
- 9.1 Key trends
- 9.2 Individual consumers
- 9.3 Enterprises & corporate learning
Chapter 10 Market Estimates & Forecast, By Region, 2022 - 2035 (USD Billion)
- 10.1 Key trends
- 10.2 North America
- 10.2.1 U.S.
- 10.2.2 Canada
- 10.3 Europe
- 10.3.1 Germany
- 10.3.2 UK
- 10.3.3 France
- 10.3.4 Italy
- 10.3.5 Spain
- 10.3.6 Netherlands
- 10.4 Asia Pacific
- 10.4.1 China
- 10.4.2 India
- 10.4.3 Japan
- 10.4.4 Australia
- 10.4.5 South Korea
- 10.5 Latin America
- 10.5.1 Brazil
- 10.5.2 Mexico
- 10.5.3 Argentina
- 10.6 MEA
- 10.6.1 South Africa
- 10.6.2 Saudi Arabia
- 10.6.3 UAE
Chapter 11 Company Profiles
- 11.1 Alibaba Group Holding Ltd.
- 11.2 Alphabet Inc.
- 11.3 Amazon.com, Inc.
- 11.4 Apple Inc.
- 11.5 Baidu, Inc.
- 11.6 British Broadcasting Corporation (BBC)
- 11.7 Comcast Corporation
- 11.8 Fandango Media, LLC
- 11.9 Fox Corporation
- 11.10 ITV plc
- 11.11 Netflix Inc.
- 11.12 Paramount Global
- 11.13 Roku, Inc.
- 11.14 Sony Group Corporation
- 11.15 Telefonica S.A.
- 11.16 Tencent Holdings Ltd.
- 11.17 The Walt Disney Company
- 11.18 Vivendi SE
- 11.19 Warner Bros. Discovery, Inc.
- 11.20 Zee Entertainment Enterprises Ltd.
 隨選視訊市場:依服務模式、內容類型及裝置類型分類-2026-2032年全球市場預測
 2026年全球視訊點播市場報告2026年全球資料中心視訊點播(VOD)市場報告2026年全球飯店業隨選視訊市場報告
 視訊點播市場分析及預測(至2035年):按類型、產品類型、服務、技術、設備、部署類型、最終用戶、組件和應用分類
 隨選視訊(VOD):市場佔有率分析、產業趨勢與統計數據、成長預測(2026-2031)
 隨選視訊市場規模、佔有率和成長分析(按收入模式、類型、內容類型、應用和地區分類)-2026-2033年產業預測
 視訊點播市場-2025-2030年預測
 全球視訊點播市場交易全球基於廣告的視訊點播市場