


 |
市場調查報告書
商品編碼
1939031
隨選視訊(VOD):市場佔有率分析、產業趨勢與統計數據、成長預測(2026-2031)Video-on-Demand - Market Share Analysis, Industry Trends & Statistics, Growth Forecasts (2026 - 2031) |
||||||
※ 本網頁內容可能與最新版本有所差異。詳細情況請與我們聯繫。
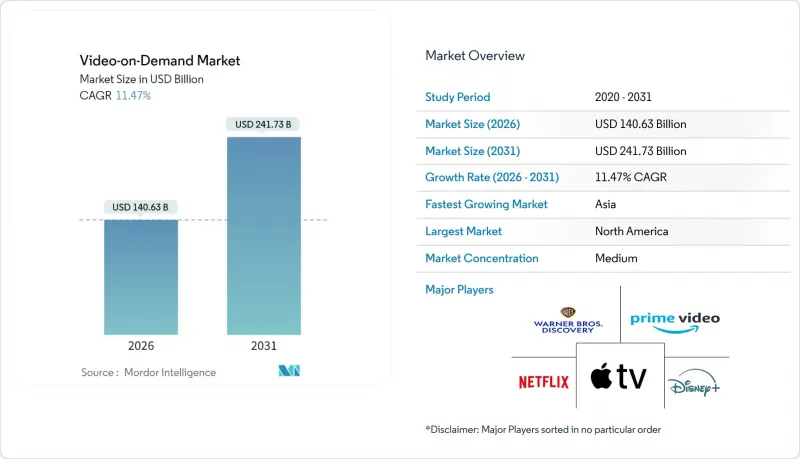
2025 年視訊點播 (VOD) 市值為 1261.6 億美元,預計到 2031 年將達到 2417.3 億美元,而 2026 年為 1406.3 億美元。
預計在預測期(2026-2031 年)內,複合年成長率將達到 11.47%。
這種加速成長反映了觀眾觀看習慣從固定時段電視節目向點播串流媒體的穩定轉變,而寬頻的快速普及、設備多樣化和豐富的節目庫是推動這一轉變的主要動力。北美和西歐的超高速光纖和5G網路普及促進了4K影片播放,而亞洲地區本地語言節目的製作預算則持續吸引當地觀眾。廣告支援型套餐的普及為價格敏感型家庭提供了新的選擇,而拉丁美洲的捆綁銷售模式則降低了用戶獲取成本。市場領導透過內容獨家、跨服務捆綁和具成本效益的配送網路來規避用戶流失風險,因此競爭依然激烈。
全球視訊點播市場趨勢與洞察
亞太新興市場AVOD平台的快速普及
由於平台採取了以低費用換取高覆蓋率的策略,亞太地區的觀眾越來越傾向接受廣告支援型服務。預計到2023年,這項策略將推動全部區域影片收入達到244億美元(avia.org)。廣告商認為,當年該地區擁有14億獨立觀眾,他們總合觀看了約140億小時的亞洲內容(avia.org)。預計到2030年,在AVOD庫存擴張的推動下,該地區的影片收入將額外增加210億美元(advanced-television.com)。多語言廣告加載個人化和基於受眾的購買策略提高了CPM(每千次展示成本),使平台能夠彌補訂閱收入的不足。這些協同效應正在將AVOD從新興經濟體的補充收入來源提升為核心收入來源。
在北美和西歐擴大超高速寬頻部署
光纖到戶普及率的不斷提高、5G固定無線存取的普及以及動態CDN路由技術,共同推動了超高清視訊的無縫傳輸。西歐的OTT劇集和電影收入預計將從2023年的310億美元飆升至2029年的480億美元(digitaltvnews.net)。業者正在試行多播輔助單播傳輸技術,該技術可在直播高峰期將頻寬使用量降低高達90%(streamtvinsider.com)。觀眾將受益於更快的啟動速度和更少的緩衝,無論是在電視、智慧型手機還是車載螢幕上。這些品質的提升轉化為更長的觀看時長,從而直接有助於穩定視訊點播(VOD)市場的平均每用戶收入(ARPU)。
內容授權成本上漲對平台利潤率帶來壓力。
多年來,熱門內容的競標戰導致最低保障金額飆升,對服務盈利造成壓力。一些中型服務商正在整合其內容庫,將自身定位為獨家熱門內容的買家或透過出售其龐大的歷史片庫來獲利的賣家。儘管歐盟委員會指出,生成式人工智慧工具未來可能降低製作成本,但短期內支出與收入之間的不平衡依然存在(ec.europa.eu)。因此,營運商被迫在提高價格或引入廣告支援的子套餐之間做出選擇,從而強化了視訊點播市場普遍存在的雙層獲利模式。
細分市場分析
儘管到2025年,SVOD將佔總收入的83.92%,體現了其先發優勢,但AVOD預計11.01%的複合年成長率表明,消費者對低成本娛樂的需求正在加速成長。隨著全球廣告支出轉向聯網螢幕,由AVOD驅動的視訊點播(VOD)市場規模預計將進一步擴大。結合少量廣告和低價策略的混合套餐正在興起,既能確保可預測的現金流,又能降低定期訂閱疲勞。小眾電視點播(TVOD)分發對於熱門大片的首映仍然至關重要,而按次付費的體育賽事則保持著較高的價格穩定性。
新興經濟體的消費者越來越傾向將AVOD視為首選而非替代方案,這促使平台進行廣告創新在地化並減少廣告投放量。同時,廣告商獲得了類似社群媒體的精準定向投放能力。對於現有的SVOD業者而言,逐步引入廣告分級制度將有助於緩解ARPU(每用戶收入)的下滑。這些變化將最佳化獲利模式,同時不會降低用戶體驗在整個視訊點播(VOD)市場中的重要性。
預計到2025年,OTT串流媒體將佔總營收的71.35%,並在2031年之前以11.22%的複合年成長率成長。與託管式IPTV不同,OTT可透過開放的網際網路和自適應位元率通訊協定在全球範圍內實現可擴展性。 MAUD試驗可將尖峰時段頻寬需求降低高達90%,進而進一步提高實況活動的成本效益(streamtvinsider.com)。因此,即使在付費電視點播服務仍然存在的地區,OTT頻道的視訊點播(VOD)市場規模也預計將超過傳統有線電視和衛星電視。
在配套服務覆蓋的地區,IPTV已獲得廣泛應用;而HbbTV在歐洲的普及以及巴西即將推出的TV 3.0則凸顯了混合模式,該模式結合了廣播的覆蓋範圍和寬頻的柔軟性(advanced-television.com)。展望未來,視訊點播(VOD)產業將整合邊緣運算節點,以顯著降低身臨其境型體驗(例如體感視訊)的延遲。
區域分析
北美仍將是最大的貢獻地區,預計到2025年將佔據41.10%的收入佔有率,這得益於其寬頻的早期普及和豐富的原創內容供應鏈。 2025年推出的行業捆綁套餐將多項關鍵服務整合到折扣套餐中,有效緩解了用戶的訂閱疲勞。聯邦政府的基礎設施津貼將繼續推動光纖網路向遍遠地區的擴展,進一步鞏固主導地位。
亞太地區是成長最快的地區,預計到2031年將維持12.05%的複合年成長率。涵蓋5G、雲端運算和本地語言製作等國家級措施將推動該地區2023年的收入達到244億美元(avia.org)。印度和中國在用戶成長方面領先,而日本和韓國則輸出了廣受國際歡迎的文化熱門內容。此外,強勁的數位廣告支出也支撐著成長,證實了廣告支援型影片點播(AVOD)在新興經濟體的永續性。
拉丁美洲正在加速擴張,預計到2029年,SVOD帳戶數量將達到1.65億(advanced-television.com)。光是巴西一國,用戶就可能超過5900萬。與通訊業者的合作促進了支付,而頻寬需求則透過正在進行的光纖項目得到滿足,其中包括Entel公司在2024年投資的6.18億美元(entel.cl)。儘管全球巨頭佔據主導地位,但區域平台仍然擁有8%的市場佔有率,這反映了該地區在視訊點播市場中對故事敘述的獨特需求。
其他福利:
- Excel格式的市場預測(ME)表
- 3個月的分析師支持
目錄
第1章 引言
- 研究假設和市場定義
- 調查範圍
第2章調查方法
第3章執行摘要
第4章 市場情勢
- 市場概覽
- 市場促進因素
- 亞太新興市場AVOD平台的快速普及
- 在北美和西歐擴大超高速寬頻部署
- 全球串流媒體公司正在加大對原創本地語言內容的投資
- 將視訊點播服務與電信服務和付費電視訂閱捆綁在一起,將推動南美洲的普及。
- 雲端原生CDN和邊緣運算的日益普及降低了視訊點播的延遲。
- 市場限制
- 內容授權成本上漲對平台利潤率帶來壓力。
- 歐盟加強對獨家內容交易的反壟斷審查
- 在成熟的SVOD市場中,訂閱疲勞導致用戶解約率上升。
- 監理展望
- 波特五力分析
- 買方的議價能力
- 供應商的議價能力
- 新進入者的威脅
- 替代品的威脅
- 競爭對手之間的競爭
第5章 市場規模與成長預測
- 按經營模式
- 訂閱視訊點播 (SVOD)
- 廣告支援的視訊點播(AVOD)
- 交易型/按次付費(TVOD)
- 混合動力及其他車型
- 透過技術提供
- Over-The-Top媒體(OTT)
- 網際網路通訊協定電視(IPTV)隨選視訊(VOD)
- 付費電視/視訊點播(VOD)
- 混合廣播寬頻電視(HbbTV)
- 依設備類型
- 智慧型手機和平板電腦
- 智慧電視
- 個人電腦和筆記型電腦
- 連網串流媒體設備
- 其他
- 按內容類型
- 娛樂與戲劇
- 運動的
- 兒童和家庭
- 教育/紀錄片
- 其他(新聞、生活風格)
- 最終用戶
- 住宅/個人
- 商業和企業(飯店、航空公司、醫院)
- 教育機構
- 公共部門和政府機構
- 按地區
- 北美洲
- 美國
- 加拿大
- 墨西哥
- 南美洲
- 巴西
- 阿根廷
- 其他南美洲
- 歐洲
- 德國
- 英國
- 法國
- 義大利
- 西班牙
- 其他歐洲地區
- 亞太地區
- 中國
- 日本
- 韓國
- 印度
- 澳洲
- 紐西蘭
- 亞太其他地區
- 中東和非洲
- 阿拉伯聯合大公國
- 沙烏地阿拉伯
- 南非
- 其他中東和非洲地區
- 北美洲
第6章 競爭情勢
- 策略發展
- 供應商定位分析
- 公司簡介
- Amazon.com Inc.(Prime Video)
- Netflix Inc.
- The Walt Disney Company(Disney+and Hulu)
- Warner Bros. Discovery Inc.(Max)
- Apple Inc.(Apple TV+)
- Alphabet Inc.(YouTube Premium and YouTube TV)
- Comcast Corporation(Peacock and Xfinity On-Demand)
- Paramount Global(Paramount+)
- Roku Inc.
- Tencent Holdings Ltd.(Tencent Video)
- Alibaba Group(Youku Tudou)
- Baidu Inc.(iQIYI)
- Zee Entertainment Enterprises Ltd.(ZEE5)
- Reliance Industries Ltd.(JioCinema)
- Novi Digital Entertainment Pvt. Ltd.(Disney+Hotstar)
- KT Corporation(Olleh TV)
- Rakuten Group(Rakuten Viki)
- Sky Group Limited(NOW)
- Telstra Corporation(Telstra TV Box Office)
- PCCW Media(Viu)
- Globoplay(Grupo Globo)
- Shahid(MBC Group)
- Showmax(MultiChoice)
- Canal+Group(myCanal)
- Vubiquity Inc.
第7章 市場機會與未來展望
The Video-on-Demand market was valued at USD 126.16 billion in 2025 and estimated to grow from USD 140.63 billion in 2026 to reach USD 241.73 billion by 2031, at a CAGR of 11.47% during the forecast period (2026-2031).
This acceleration mirrors the steady shift from scheduled television to on-demand streaming, supported by rapid broadband rollouts, device proliferation, and richer content libraries. Ultra-high-speed fiber and 5G coverage in North America and Western Europe enable smooth 4K playback, while local-language production budgets in Asia keep regional viewers engaged. The surge of ad-supported tiers offers price-sensitive households alternative entry points, and telecom bundles are lowering acquisition costs in Latin America. The competitive intensity remains high as market leaders hedge churn risk through content exclusivity, cross-service bundles, and cost-efficient delivery networks.
Global Video-on-Demand Market Trends and Insights
Rapid Adoption of AVOD Platforms in Emerging Asia-Pacific Markets
Asia-Pacific audiences are embracing ad-supported offerings as platforms trade lower fees for higher reach, a tactic that garnered a USD 24.4 billion regional video revenue pool in 2023 avia.org. Advertisers value the 1.4 billion unique viewers who collectively streamed almost 14 billion hours of Asian content in the same year avia.org. Forecasts suggest the region will unlock another USD 21 billion in video earnings by 2030 as AVOD inventory scales advanced-television.com . Multilingual ad load personalization and audience-based buying is raising CPMs, allowing platforms to offset thinner subscription margins. Together, these dynamics elevate AVOD from a supplemental to a core monetization pillar across emerging economies.
Expansion of Ultra-High-Speed Broadband Rollout in North America & Western Europe
Fiber-to-the-home penetration, 5G fixed-wireless access, and dynamic CDN routing now underpin seamless UHD delivery. Western European OTT episode and movie revenue will jump to USD 48 billion by 2029 from USD 31 billion in 2023 digitaltvnews.net . Operators are piloting multicast-assisted unicast delivery that can trim bandwidth use by as much as 90% during live traffic peaks streamtvinsider.com . Viewers benefit through faster start times and reduced buffering across TVs, phones, and in-vehicle screens. Such quality upgrades raise engagement minutes, directly supporting ARPU stability within the Video-on-Demand market.
Escalating Content Licensing Costs Squeezing Platform Margins
Multiyear bidding wars over hit franchises inflate minimum guarantees, squeezing service profitability. Some mid-tier providers have culled libraries, positioning themselves either as buyers of exclusive hits or as sellers monetizing deep back catalogs. The European Commission notes that generative AI tools could eventually ease production costs but the near-term imbalance between spending and returns persists ec.europa.eu. Consequently, operators either push prices up or introduce lower-tier plans with ads, reinforcing the two-track monetization model visible throughout the Video-on-Demand market.
Other drivers and restraints analyzed in the detailed report include:
- Increased Content Investments in Local-Language Originals by Global Streamers
- Bundling of VoD with Telecom & Pay-TV Subscriptions Driving Uptake in South America
- Rising Churn Rates Due to Subscription Fatigue in Matured SVOD Markets
For complete list of drivers and restraints, kindly check the Table Of Contents.
Segment Analysis
SVOD controlled 83.92% revenue in 2025, reflecting its early-mover status, but AVOD's 11.01% forecast CAGR signals accelerating demand for low-cost entertainment. The Video-on-Demand market size attributable to AVOD will widen as global advertising outlays migrate to connected screens. Hybrid packages that merge limited ads with modest fees are emerging to curb subscription fatigue while preserving predictable cash receipts. Niche TVOD windows retain relevance for blockbuster premieres, with sports pay-per-view sustaining premium pricing elasticity.
Consumers in emerging economies increasingly treat AVOD as a first-choice service rather than a fallback, prompting platforms to localize ad creative and shorten ad loads. Advertisers, meanwhile, gain addressable targeting that rivals social media precision. For SVOD incumbents, gradual entry into advertising mitigates ARPU erosion. Together, these shifts refine monetization structures without altering the centrality of customer experience within the broader Video-on-Demand market.
OTT streaming garnered 71.35% of 2025 revenues and is forecast at 11.22% CAGR through 2031. Unlike managed IPTV, OTT scales globally via open internet and adaptive bitrate protocols. MAUD trials that cut peak bandwidth needs by up to 90% further bolster cost efficiency for live events streamtvinsider.com. Thus, the Video-on-Demand market size for OTT channels will outpace legacy cable and satellite, even where Pay-TV VoD persists.
IPTV remains entrenched in regions with bundled DSL and fiber offerings, while HbbTV adoption in Europe and Brazil's upcoming TV 3.0 highlight hybrid models that blend broadcast reach with broadband flexibility advanced-television.com. Looking ahead, the Video-on-Demand industry will integrate edge compute nodes to slash latency for immersive experiences such as volumetric video.
The Video-On-Demand (VoD) Market Report is Segmented by Business Model (Subscription VoD, Advertising VoD, and More), Delivery Technology (OTT Streaming, IPTV VoD, and More), Device Type (Smartphones and Tablets, Smart TVs, and More), Content Genre (Entertainment and Drama, Sports, and More), End-User (Residential, Commercial and Enterprise, and More), and Geography. The Market Forecasts are Provided in Terms of Value (USD).
Geography Analysis
North America remained the largest contributor at 41.10% revenue share in 2025, benefiting from early broadband ubiquity and deep original-content pipelines. Industry bundles launched in 2025 combine multiple flagship services into discounted packages, an antidote to subscription fatigue. Federal infrastructure grants continue to extend rural fiber, reinforcing the Video-on-Demand market's leadership position.
Asia-Pacific is the fastest-growing territory, tracking a 12.05% CAGR to 2031. National initiatives spanning 5G, cloud, and local-language production have spurred USD 24.4 billion in 2023 regional revenue avia.org. India and China top subscriber additions, while Japan and South Korea export cultural hits that travel well internationally. Growth is further supported by robust digital advertising spend, underpinning AVOD viability across emerging economies.
Latin America shows accelerating scale, projected to host 165 million SVOD accounts by 2029 advanced-television.com. Brazil alone may surpass 59 million subs. Telco partnerships ease payments and satisfy bandwidth requirements via ongoing fiber projects such as Entel's USD 618 million 2024 investment entel.cl. Although global majors dominate, local platforms still secure 8% market share, reflecting regional storytelling demand within the Video-on-Demand market.
- Amazon.com Inc. (Prime Video)
- Netflix Inc.
- The Walt Disney Company (Disney+ and Hulu)
- Warner Bros. Discovery Inc. (Max)
- Apple Inc. (Apple TV+)
- Alphabet Inc. (YouTube Premium and YouTube TV)
- Comcast Corporation (Peacock and Xfinity On-Demand)
- Paramount Global (Paramount+)
- Roku Inc.
- Tencent Holdings Ltd. (Tencent Video)
- Alibaba Group (Youku Tudou)
- Baidu Inc. (iQIYI)
- Zee Entertainment Enterprises Ltd. (ZEE5)
- Reliance Industries Ltd. (JioCinema)
- Novi Digital Entertainment Pvt. Ltd. (Disney+ Hotstar)
- KT Corporation (Olleh TV)
- Rakuten Group (Rakuten Viki)
- Sky Group Limited (NOW)
- Telstra Corporation (Telstra TV Box Office)
- PCCW Media (Viu)
- Globoplay (Grupo Globo)
- Shahid (MBC Group)
- Showmax (MultiChoice)
- Canal+ Group (myCanal)
- Vubiquity Inc.
Additional Benefits:
- The market estimate (ME) sheet in Excel format
- 3 months of analyst support
TABLE OF CONTENTS
1 INTRODUCTION
- 1.1 Study Assumptions and Market Definition
- 1.2 Scope of the Study
2 RESEARCH METHODOLOGY
3 EXECUTIVE SUMMARY
4 MARKET LANDSCAPE
- 4.1 Market Overview
- 4.2 Market Drivers
- 4.2.1 Rapid adoption of AVOD platforms in emerging Asia-Pacific markets
- 4.2.2 Expansion of ultra-high-speed broadband rollout in North America and Western Europe
- 4.2.3 Increased content investments in local-language originals by global streamers
- 4.2.4 Bundling of VoD with telecom and pay-TV subscriptions driving uptake in South America
- 4.2.5 Growing adoption of cloud-native CDN and edge compute lowering VoD latency
- 4.3 Market Restraints
- 4.3.1 Escalating content licensing costs squeezing platform margins
- 4.3.2 Intensifying antitrust scrutiny over exclusive content deals in EU
- 4.3.3 Rising churn rates due to subscription fatigue in matured SVOD markets
- 4.4 Regulatory Outlook
- 4.5 Porter's Five Forces Analysis
- 4.5.1 Bargaining Power of Buyers
- 4.5.2 Bargaining Power of Suppliers
- 4.5.3 Threat of New Entrants
- 4.5.4 Threat of Substitutes
- 4.5.5 Intensity of Competitive Rivalry
5 MARKET SIZE AND GROWTH FORECASTS (VALUE)
- 5.1 By Business Model
- 5.1.1 Subscription Video-on-Demand (SVOD)
- 5.1.2 Advertising Video-on-Demand (AVOD)
- 5.1.3 Transactional/Pay-per-view (TVOD)
- 5.1.4 Hybrid and Other Models
- 5.2 By Delivery Technology
- 5.2.1 Over-the-Top (OTT) Streaming
- 5.2.2 Internet Protocol Television (IPTV) VoD
- 5.2.3 Pay-TV VoD
- 5.2.4 Hybrid Broadcast Broadband TV (HbbTV)
- 5.3 By Device Type
- 5.3.1 Smartphones and Tablets
- 5.3.2 Smart TVs
- 5.3.3 PCs and Laptops
- 5.3.4 Connected Streaming Devices
- 5.3.5 Others
- 5.4 By Content Genre
- 5.4.1 Entertainment and Drama
- 5.4.2 Sports
- 5.4.3 Kids and Family
- 5.4.4 Educational and Documentary
- 5.4.5 Others (News, Lifestyle)
- 5.5 By End-user
- 5.5.1 Residential / Individual
- 5.5.2 Commercial and Enterprise (Hotels, Airlines, Hospitals)
- 5.5.3 Educational Institutions
- 5.5.4 Public Sector and Government
- 5.6 By Geography
- 5.6.1 North America
- 5.6.1.1 United States
- 5.6.1.2 Canada
- 5.6.1.3 Mexico
- 5.6.2 South America
- 5.6.2.1 Brazil
- 5.6.2.2 Argentina
- 5.6.2.3 Rest of South America
- 5.6.3 Europe
- 5.6.3.1 Germany
- 5.6.3.2 United Kingdom
- 5.6.3.3 France
- 5.6.3.4 Italy
- 5.6.3.5 Spain
- 5.6.3.6 Rest of Europe
- 5.6.4 Asia-Pacific
- 5.6.4.1 China
- 5.6.4.2 Japan
- 5.6.4.3 South Korea
- 5.6.4.4 India
- 5.6.4.5 Australia
- 5.6.4.6 New Zealand
- 5.6.4.7 Rest of Asia-Pacific
- 5.6.5 Middle East and Africa
- 5.6.5.1 United Arab Emirates
- 5.6.5.2 Saudi Arabia
- 5.6.5.3 South Africa
- 5.6.5.4 Rest of Middle East and Africa
- 5.6.1 North America
6 COMPETITIVE LANDSCAPE
- 6.1 Strategic Developments
- 6.2 Vendor Positioning Analysis
- 6.3 Company Profiles (includes Global level Overview, Market level overview, Core Segments, Financials as available, Strategic Information, Products and Services, and Recent Developments)
- 6.3.1 Amazon.com Inc. (Prime Video)
- 6.3.2 Netflix Inc.
- 6.3.3 The Walt Disney Company (Disney+ and Hulu)
- 6.3.4 Warner Bros. Discovery Inc. (Max)
- 6.3.5 Apple Inc. (Apple TV+)
- 6.3.6 Alphabet Inc. (YouTube Premium and YouTube TV)
- 6.3.7 Comcast Corporation (Peacock and Xfinity On-Demand)
- 6.3.8 Paramount Global (Paramount+)
- 6.3.9 Roku Inc.
- 6.3.10 Tencent Holdings Ltd. (Tencent Video)
- 6.3.11 Alibaba Group (Youku Tudou)
- 6.3.12 Baidu Inc. (iQIYI)
- 6.3.13 Zee Entertainment Enterprises Ltd. (ZEE5)
- 6.3.14 Reliance Industries Ltd. (JioCinema)
- 6.3.15 Novi Digital Entertainment Pvt. Ltd. (Disney+ Hotstar)
- 6.3.16 KT Corporation (Olleh TV)
- 6.3.17 Rakuten Group (Rakuten Viki)
- 6.3.18 Sky Group Limited (NOW)
- 6.3.19 Telstra Corporation (Telstra TV Box Office)
- 6.3.20 PCCW Media (Viu)
- 6.3.21 Globoplay (Grupo Globo)
- 6.3.22 Shahid (MBC Group)
- 6.3.23 Showmax (MultiChoice)
- 6.3.24 Canal+ Group (myCanal)
- 6.3.25 Vubiquity Inc.
7 MARKET OPPORTUNITIES AND FUTURE OUTLOOK
- 7.1 White-space and Unmet-Need Assessment
 2026年全球時移市場報告2035年全球視訊點播市場報告
 全球飯店業隨選視訊市場
 交易型視訊點播市場-全球產業規模、佔有率、趨勢、機會與預測:按類型、垂直市場、地區和競爭格局分類,2021-2031年按需出行市場 - 全球產業規模、佔有率、趨勢、機會、預測:按類型、車輛類型、動力系統、通勤類型、地區和競爭格局分類,2021-2031年
 隨選視訊市場:依服務模式、內容類型及裝置類型分類-2026-2032年全球市場預測
 視訊點播 (VOD) 服務市場:按交付方式、內容類型、行業和地區分類2026年全球資料中心視訊點播(VOD)市場報告2026年全球飯店業隨選視訊市場報告
 視訊點播市場分析及預測(至2035年):按類型、產品類型、服務、技術、設備、部署類型、最終用戶、組件和應用分類