


 |
市場調查報告書
商品編碼
1913373
豌豆澱粉市場:市場機會、成長促進因素、產業趨勢分析及預測(2026-2035)Pea Starch Market Opportunity, Growth Drivers, Industry Trend Analysis, and Forecast 2026 - 2035 |
||||||
全球豌豆澱粉市場預計到 2025 年將價值 6.53 億美元,到 2035 年將達到 28 億美元,年複合成長率為 14%。
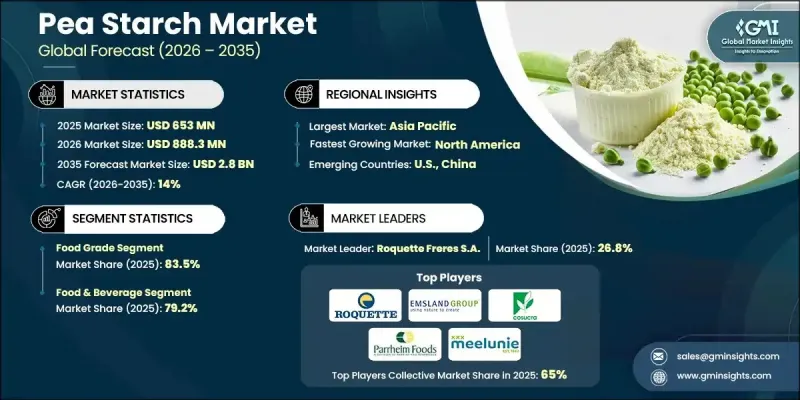
全球食品飲料產業的結構性變革推動了豌豆澱粉市場的擴張。製造商越來越依賴植物來源原料來增強產品的功能性、質地和營養價值。豌豆澱粉因其優異的性能和符合潔淨標示趨勢的特點,作為一種用途廣泛的原料,在各種加工食品和包裝食品配方中備受關注。消費者飲食習慣向便利和健康食品的轉變,尤其是在已開發國家,推動了豌豆澱粉需求的穩定成長。同時,新興市場的快速都市化、可支配收入的增加以及生活方式的改變,正在加速包裝食品的消費,進一步增強了市場成長勢頭。歐洲食品產業也為市場成長做出了貢獻,製造商優先考慮植物來源原料,以滿足監管標準和消費者對透明度和永續性的日益成長的期望。這些趨勢共同作用,使豌豆澱粉成為全球澱粉和特種碳水化合物市場中成長最快的原料之一。
| 市場覆蓋範圍 | |
|---|---|
| 開始年份 | 2025 |
| 預測年份 | 2026-2035 |
| 起始值 | 6.53億美元 |
| 預測金額 | 28億美元 |
| 複合年成長率 | 14% |
2025年,食品級產品市佔率將達到83.5%,這主要得益於其卓越的品質標準和在人類消費領域的廣泛應用。認證和合規要求將繼續影響該領域產品的市場推廣。
到 2025 年,食品和飲料行業將佔 79.2% 的佔有率,這主要得益於豌豆澱粉相對於其他澱粉來源的功能優勢,特別是其性能的穩定性和配方效率。
預計到 2025 年,北美豌豆澱粉市場佔有率將達到 17%,其成長主要得益於美國食品業的穩步擴張以及對便捷加工食品需求的不斷成長。
目錄
第1章:分析方法和範圍
第2章執行摘要
第3章業界考察
- 產業生態系分析
- 供應商情況
- 利潤率
- 每個階段的附加價值
- 影響價值鏈的因素
- 中斷
- 產業影響因素
- 促進要素
- 產業潛在風險與挑戰
- 市場機遇
- 成長潛力分析
- 監管環境
- 北美洲
- 歐洲
- 亞太地區
- 拉丁美洲
- 中東和非洲
- 波特五力分析
- PESTEL 分析
- 價格趨勢
- 按地區
- 按形狀
- 未來市場趨勢
- 科技與創新趨勢
- 當前技術趨勢
- 新興技術
- 專利狀態
- 貿易統計(HS編碼)
(註:貿易統計數據僅涵蓋主要國家。)
- 主要進口國
- 主要出口國
第4章 競爭情勢
- 介紹
- 公司市佔率分析
- 按地區
- 北美洲
- 歐洲
- 亞太地區
- 拉丁美洲
- 中東和非洲
- 按地區
- 企業矩陣分析
- 主要企業的競爭分析
- 競爭定位矩陣
- 主要趨勢
- 企業合併(M&A)
- 夥伴關係與合作
- 新產品發布
- 業務拓展計劃
第5章 按產品分類的市場估算與預測(2022-2035 年)
- 食品級
- 工業級
- 飼料級
第6章 按應用領域分類的市場估算與預測(2022-2035 年)
- 製藥
- 食品/飲料
- 麵包和糖果甜點
- 乳製品
- 湯、醬汁、調味料
- 零食和即食食品
- 飼料
- 紙張和紡織品
- 其他
- 黏合劑
- 生質塑膠
第7章 按功能分類的市場估計和預測(2022-2035 年)
- 增稠劑
- 粘合劑
- 膠凝劑
- 成膜劑
- 增稠劑
第8章 按分銷管道分類的市場估算和預測(2022-2035 年)
- 直銷(B2B)
- 零售
- 超級市場
- 專賣店
- 其他
- 線上管道
第9章 各地區市場估算與預測(2022-2035 年)
- 北美洲
- 美國
- 加拿大
- 歐洲
- 德國
- 英國
- 法國
- 西班牙
- 義大利
- 其他歐洲
- 亞太地區
- 中國
- 印度
- 日本
- 澳洲
- 韓國
- 亞太其他地區
- 拉丁美洲
- 巴西
- 墨西哥
- 阿根廷
- 其他拉丁美洲
- 中東和非洲
- 沙烏地阿拉伯
- 南非
- 阿拉伯聯合大公國
- 其他中東和非洲地區
第10章:公司簡介
- Roquette Freres SA
- Yantai Oriental Protein Tech Co. Ltd.
- Cosucra-Groupe Warcoing
- Emsland-Starke GmbH
- Shandong Jianyuan Bioengineering Co., Ltd.
- Vestkorn Milling AS
- Dakota Dry Bean Inc.
- Yantai T.Full Biotech Co Ltd.
- Parrheim Foods
- Meelunie BV
- American Key Products Inc.
- AGT Food and Ingredients Inc.
- The Scoular Company
- Qingdao CBH Co., Ltd.
The Global Pea Starch Market was valued at USD 653 million in 2025 and is estimated to grow at a CAGR of 14% to reach USD 2.8 billion by 2035.
Market expansion is driven by structural changes within the global food and beverage sector, where manufacturers increasingly rely on plant-based ingredients to improve functionality, texture, and nutritional positioning. Pea starch is gaining strong traction as a versatile ingredient used across a wide range of processed and packaged food formulations due to its favorable performance characteristics and compatibility with clean-label trends. Shifts in consumer eating patterns toward convenience-oriented and health-conscious food options are supporting steady demand growth, particularly in developed economies. At the same time, rapid urbanization, rising disposable incomes, and lifestyle changes across emerging markets are accelerating the consumption of packaged foods, further strengthening market momentum. The European food industry is also contributing to growth as manufacturers prioritize plant-derived ingredients to meet evolving regulatory standards and consumer expectations related to transparency and sustainability. Together, these dynamics are positioning pea starch as a high-growth ingredient within the global starch and specialty carbohydrate landscape.
| Market Scope | |
|---|---|
| Start Year | 2025 |
| Forecast Year | 2026-2035 |
| Start Value | $653 Million |
| Forecast Value | $2.8 Billion |
| CAGR | 14% |
The food-grade products segment accounted for 83.5% share in 2025, supported by its superior quality standards and widespread use in human consumption applications. Certification and compliance requirements continue to shape product adoption within this segment.
The food & beverage segment held 79.2% share in 2025, driven by the functional advantages pea starch offers over alternative starch sources, including performance consistency and formulation efficiency.
North America Pea Starch Market held 17% share in 2025, with growth primarily supported by steady expansion in the U.S. food industry and increasing demand for convenient and processed food products.
Key companies operating in the Global Pea Starch Market include Roquette Freres S.A., Cosucra-Groupe Warcoing, Emsland-Starke GmbH, Vestkorn Milling AS, AGT Food and Ingredients Inc., Meelunie B.V., Dakota Dry Bean Inc., The Scoular Company, American Key Products Inc., Parrheim Foods, Yantai Oriental Protein Tech Co. Ltd., Qingdao CBH Co., Ltd., Shandong Jianyuan Bioengineering Co., Ltd., and Yantai T.Full Biotech Co Ltd. Companies in the Global Pea Starch Market are strengthening their competitive position by expanding processing capacities and securing long-term raw material sourcing agreements to ensure supply stability. Continuous investment in product innovation allows manufacturers to improve functional performance and tailor starch solutions for specific application needs. Strategic collaborations with food processors support the co-development of customized formulations and accelerate market penetration. Firms are also focusing on certifications, clean-label compliance, and sustainability messaging to align with evolving consumer and regulatory expectations.
Table of Contents
Chapter 1 Methodology & Scope
- 1.1 Market scope and definition
- 1.2 Research design
- 1.2.1 Research approach
- 1.2.2 Data collection methods
- 1.3 Data mining sources
- 1.3.1 Global
- 1.3.2 Regional/Country
- 1.4 Base estimates and calculations
- 1.4.1 Base year calculation
- 1.4.2 Key trends for market estimation
- 1.5 Primary research and validation
- 1.5.1 Primary sources
- 1.6 Forecast model
- 1.7 Research assumptions and limitations
Chapter 2 Executive Summary
- 2.1 Industry 360° synopsis
- 2.2 Key market trends
- 2.2.1 Regional
- 2.2.2 Product
- 2.2.3 End Use
- 2.3 TAM Analysis, 2026-2035
- 2.4 CXO perspectives: Strategic imperatives
- 2.4.1 Executive decision points
- 2.4.2 Critical success factors
- 2.5 Future Outlook and Strategic Recommendations
Chapter 3 Industry Insights
- 3.1 Industry ecosystem analysis
- 3.1.1 Supplier landscape
- 3.1.2 Profit margin
- 3.1.3 Value addition at each stage
- 3.1.4 Factor affecting the value chain
- 3.1.5 Disruptions
- 3.2 Industry impact forces
- 3.2.1 Growth drivers
- 3.2.2 Industry pitfalls and challenges
- 3.2.3 Market opportunities
- 3.3 Growth potential analysis
- 3.4 Regulatory landscape
- 3.4.1 North America
- 3.4.2 Europe
- 3.4.3 Asia Pacific
- 3.4.4 Latin America
- 3.4.5 Middle East & Africa
- 3.5 Porter's analysis
- 3.6 PESTEL analysis
- 3.7 Price trends
- 3.7.1 By region
- 3.7.2 By form
- 3.8 Future market trends
- 3.9 Technology and Innovation landscape
- 3.9.1 Current technological trends
- 3.9.2 Emerging technologies
- 3.10 Patent Landscape
- 3.11 Trade statistics (HS code)
( Note: The trade statistics will be provided for key countries only)
- 3.11.1 Major importing countries
- 3.11.2 Major exporting countries
Chapter 4 Competitive Landscape, 2025
- 4.1 Introduction
- 4.2 Company market share analysis
- 4.2.1 By region
- 4.2.1.1 North America
- 4.2.1.2 Europe
- 4.2.1.3 Asia Pacific
- 4.2.1.4 LATAM
- 4.2.1.5 MEA
- 4.2.1 By region
- 4.3 Company matrix analysis
- 4.4 Competitive analysis of major market players
- 4.5 Competitive positioning matrix
- 4.6 Key developments
- 4.6.1 Mergers & acquisitions
- 4.6.2 Partnerships & collaborations
- 4.6.3 New Product Launches
- 4.6.4 Expansion Plans
Chapter 5 Market Estimates and Forecast, By Product, 2022-2035 (USD Billion & Tons)
- 5.1 Key trends
- 5.2 Food grade
- 5.3 Industrial grade
- 5.4 Feed grade
Chapter 6 Market Estimates and Forecast, By Application, 2022-2035 (USD Billion & Tons)
- 6.1 Key trends
- 6.2 Pharmaceutical
- 6.3 Food & beverage
- 6.3.1 Bakery & Confectionery
- 6.3.2 Dairy Products
- 6.3.3 Soups, Sauces & Dressings
- 6.3.4 Snacks & Convenience Foods
- 6.4 Animal feed
- 6.5 Paper & textiles
- 6.6 Others
- 6.6.1 Adhesives
- 6.6.2 Bioplastics
Chapter 7 Market Estimates and Forecast, By Functionality, 2022-2035 (USD Billion & Tons)
- 7.1 Key trends
- 7.2 Thickening Agent
- 7.3 Binding Agent
- 7.4 Gelling Agent
- 7.5 Film-forming Agent
- 7.6 Texturizing Agent
Chapter 8 Market Estimates and Forecast, By Distribution Channel, 2022-2035 (USD Billion & Tons)
- 8.1 Key trends
- 8.2 Direct Sales (B2B)
- 8.3 Retail
- 8.3.1 Supermarkets
- 8.3.2 Specialty Stores
- 8.3.3 Others
- 8.4 Online Channels
Chapter 9 Market Estimates and Forecast, By Region, 2022-2035 (USD Billion & Tons)
- 9.1 Key trends
- 9.2 North America
- 9.2.1 U.S.
- 9.2.2 Canada
- 9.3 Europe
- 9.3.1 Germany
- 9.3.2 UK
- 9.3.3 France
- 9.3.4 Spain
- 9.3.5 Italy
- 9.3.6 Rest of Europe
- 9.4 Asia Pacific
- 9.4.1 China
- 9.4.2 India
- 9.4.3 Japan
- 9.4.4 Australia
- 9.4.5 South Korea
- 9.4.6 Rest of Asia Pacific
- 9.5 Latin America
- 9.5.1 Brazil
- 9.5.2 Mexico
- 9.5.3 Argentina
- 9.5.4 Rest of Latin America
- 9.6 Middle East and Africa
- 9.6.1 Saudi Arabia
- 9.6.2 South Africa
- 9.6.3 UAE
- 9.6.4 Rest of Middle East and Africa
Chapter 10 Company Profiles
- 10.1 Roquette Freres S.A.
- 10.2 Yantai Oriental Protein Tech Co. Ltd.
- 10.3 Cosucra-Groupe Warcoing
- 10.4 Emsland-Starke GmbH
- 10.5 Shandong Jianyuan Bioengineering Co., Ltd.
- 10.6 Vestkorn Milling AS
- 10.7 Dakota Dry Bean Inc.
- 10.8 Yantai T.Full Biotech Co Ltd.
- 10.9 Parrheim Foods
- 10.10 Meelunie B.V.
- 10.11 American Key Products Inc.
- 10.12 AGT Food and Ingredients Inc.
- 10.13 The Scoular Company
- 10.14 Qingdao CBH Co., Ltd.
 豌豆澱粉市場-全球產業規模、佔有率、趨勢、機會、預測:按產品類型、功能、最終用途、地區和競爭格局分類,2021-2031年
 豌豆澱粉市場規模、佔有率及成長分析(按來源、應用及地區分類)-2026-2033年產業預測
 豌豆澱粉:全球市佔率及排名、總銷售額及需求預測(2025-2031年)
 豌豆澱粉的全球市場(~2035年):各類型原料,各等級類型,各應用領域,各功能類型,各加工方法類型,各形狀類型,企業規模,各主要地區,產業趨勢,預測
 豌豆澱粉市場預測至2032年:按產品、功能、來源、應用、最終用戶和地區進行的全球分析
 全球豌豆澱粉市場:按應用、按形式、按功能、按等級、按特性、按產品類型、按原料、按技術類型、按地區 - 預測至 2029 年