


 |
市場調查報告書
商品編碼
1913361
7級卡車市場機會、成長要素、產業趨勢分析及2026年至2035年預測Class 7 Trucks Market Opportunity, Growth Drivers, Industry Trend Analysis, and Forecast 2026 - 2035 |
||||||
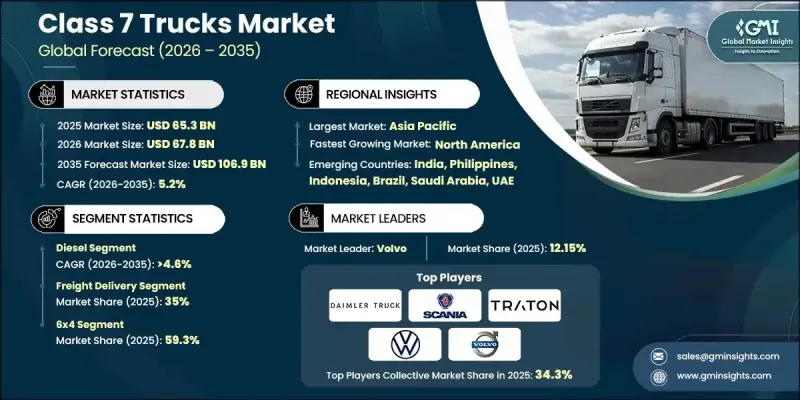
全球 7 級卡車市場預計到 2025 年將價值 653 億美元,到 2035 年達到 1,069 億美元,年複合成長率為 5.2%。
7級卡車,總重介於26,001至33,000磅(約11,800至15,000公斤)之間,不再被視為基礎作業車輛,而是日益被視為最佳化的車隊投資。這些卡車服務都市區貨運、區域配送、建築施工、市政服務和公共產業運營。全球車隊所有者正在整合數位監控工具、安全技術和替代動力系統,以提高資產利用率、營運效率和生命週期規劃。監管壓力和不斷演變的物流模式正在加速車輛更新換代,並影響車隊的長期策略。排放氣體標準、公私合營以及永續性指令正在重塑採購行為和基礎設施規劃,而新興市場則透過分階段的監管實施來實現車隊現代化。隨著互聯車隊生態系統的日益成熟,營運視覺性和數據驅動的部署正成為7級卡車在全球市場中提升性能和盈利的核心要素。
| 市場覆蓋範圍 | |
|---|---|
| 開始年份 | 2025 |
| 預測年份 | 2026-2035 |
| 起始值 | 653億美元 |
| 預測金額 | 1069億美元 |
| 複合年成長率 | 5.2% |
各國政府的政策和環境法規正深刻影響全球各地對7級卡車的需求。排放氣體法律規範和清潔車隊計畫正在加速現有車輛的更新換代,而開發中國家不斷完善的標準則推動車隊的逐步現代化。這些政策正在影響動力傳動系統選擇、資本規劃和長期營運投資,而連網車隊技術則在迅速提升生產效率和成本控制。
預計到2025年,柴油動力系統總成市佔率將達到80.81%,並在2035年之前以4.6%的複合年成長率成長。柴油引擎憑藉其強勁的扭力輸出、燃油效率高、經久耐用以及在中型運輸領域良好的營運經濟性,仍然是首選。燃料的廣泛供應也進一步推動了柴油引擎在成熟市場和發展中市場的持續普及。
預計到 2025 年,貨運配送領域將佔 35% 的市場佔有率,從 2026 年到 2035 年,複合年成長率將達到 5.3%。 7 級卡車在有效負載容量、機動性和效率方面實現了有效平衡,使其非常適合中距離貨運和由不斷擴大的商業活動驅動的高頻配送作業。
預計到 2025 年,亞太地區 7 級卡車市場將佔全球市場佔有率的 65.5%,市場規模將達到 253.8 億美元。持續的基礎設施投資、不斷擴大的物流網路以及對商用車更新換代的政策支持推動了市場成長,刺激了建築支援、市政車隊和區域貨運的需求。
目錄
第1章調查方法
第2章執行摘要
第3章業界考察
- 生態系分析
- 供應商情況
- 利潤率分析
- 成本結構
- 每個階段的附加價值
- 影響價值鏈的因素
- 中斷
- 產業影響因素
- 促進要素
- 全球對電動和混合動力7級卡車的需求正在成長
- 北美貨運活動不斷擴大
- 歐洲實施更嚴格的排放法規
- 亞太地區基礎建設活動投資增加
- 中東和非洲的採礦、石油和天然氣產業對7級卡車的需求不斷成長
- 產業潛在風險與挑戰
- 高昂的初始成本和維修成本
- 卡車駕駛人短缺
- 市場機遇
- 市政和城市物流車輛的電氣化
- 新興經濟體基礎設施和建設活動的擴張
- 靈活所有權、租賃和卡車即服務 (TaaS) 模式的成長
- 整合先進的遠端資訊處理和車隊分析解決方案
- 促進要素
- 成長潛力分析
- 監管環境
- 北美洲
- NEVI/IIJA,先進清潔卡車 (ACT) 法規
- 歐洲
- 德國:《電動車法案》(EmoG)
- 英國:清潔車輛改裝認證計畫 (CVRAS)、超低排放氣體區 (ULEZ)
- 法國:流動性導向法(LOM 法)
- 義大利:國家綜合能源與氣候計畫(PNIEC)
- 亞太地區
- 中國:新能源汽車(NEV)強制政策
- 印度:FAME II計劃
- 日本:電動車與燃料電池車引進戰略藍圖
- 澳洲:各州零排放車輛強制令
- 拉丁美洲
- 巴西:國家電動車政策(PNME)
- 墨西哥:都市區零排放車輛計劃
- 阿根廷:各州電動車獎勵政策(布宜諾斯艾利斯省)
- 中東和非洲
- 阿拉伯聯合大公國:電動車充電基礎設施法規(ADDM/DEWA)
- 沙烏地阿拉伯:電動車推廣法規結構(SASO)
- 南非:綠色交通戰略
- 北美洲
- 波特五力分析
- PESTEL 分析
- 科技與創新趨勢
- 當前技術趨勢
- 新興技術
- 專利分析
- 定價分析
- 按地區
- 按燃料
- 生產統計
- 生產基地
- 消費基礎
- 出口和進口
- 成本細分分析
- 永續性和環境影響分析
- 永續實踐
- 減少廢棄物策略
- 生產中的能源效率
- 環保舉措
- 碳足跡考量
- 未來前景與機遇
- 車隊採購與採購行為分析
- 7級卡車購買決策標準
- OEM選擇與品牌偏好因素
- 燃料、負載容量和運作時間如何影響購買決策
- 二手7級卡車市場的殘值與市場動態
- 融資、租賃和卡車即服務 (TaaS) 的經濟學
- 售後市場、服務與零件經濟學
- 動力傳動系統轉型與燃料轉型路徑
第4章 競爭情勢
- 介紹
- 公司市佔率分析
- 主要市場公司的競爭分析
- 競爭定位矩陣
- 戰略展望矩陣
- 重大進展
- 併購
- 夥伴關係與合作
- 新產品發布
- 企業擴張計畫和資金籌措
第5章 依燃料類型分類的市場估算與預測,2022-2035年
- 柴油引擎
- 天然氣
- 油電混合車
- 其他
第6章 按應用領域分類的市場估算與預測,2022-2035年
- 貨運
- 公共產業服務
- 建築和採礦
- 其他
7. 按車軸分類的市場估算與預測,2022-2035 年
- 4x2
- 6x4
- 6x2
第8章 按馬力分類的市場估算與預測,2022-2035年
- 不到300馬力
- 300馬力至400馬力
- 400馬力至500馬力
- 超過500馬力
9. 按所有權類型分類的市場估算與預測,2022-2035 年
- 車隊營運商
- 獨立企業
第10章 依輸電方式分類的市場估計與預測,2022-2035年
- 手排變速箱
- 自動變速箱
第11章 2022-2035年各地區市場估計與預測
- 北美洲
- 美國
- 加拿大
- 歐洲
- 德國
- 英國
- 法國
- 義大利
- 西班牙
- 俄羅斯
- 北歐國家
- 亞太地區
- 中國
- 印度
- 日本
- 澳洲
- 韓國
- 菲律賓
- 印尼
- 拉丁美洲
- 巴西
- 墨西哥
- 阿根廷
- 中東和非洲
- 南非
- 沙烏地阿拉伯
- 阿拉伯聯合大公國
第12章:公司簡介
- 世界玩家
- Daimler Truck
- Ford Motor Company
- Hino Motors
- Isuzu Motors
- Navistar
- Scania
- TRATON
- Volvo Trucks
- 本地製造商
- Ashok Leyland
- BYD
- Eicher Motor
- GMC
- Hyundai
- JAC Motors
- Kenworth
- Kia
- Mack Trucks
- Mahindra &Mahindra
- Mitsubishi Fuso Truck and Bus Corporation
- Peterbilt
- SML Isuzu
- Tata Motors
- 新興製造商
- Dongfeng Motor
- Rivian Automotive
- SAIC Maxus
The Global Class 7 Truck Market was valued at USD 65.3 billion in 2025 and is estimated to grow at a CAGR of 5.2% to reach USD 106.9 billion by 2035.
Class 7 trucks, defined by a GVWR range of 26,001-33,000 lbs, are no longer viewed as basic work vehicles but are increasingly treated as optimized fleet investments. These trucks support urban freight movement, regional distribution, construction assistance, municipal duties, and utility operations. Fleet owners worldwide integrate digital monitoring tools, safety technologies, and alternative propulsion systems to improve asset utilization, operational efficiency, and lifecycle planning. Regulatory pressure and evolving logistics models are accelerating replacement cycles and influencing long-term fleet strategies. Emission standards, public-private coordination, and sustainability mandates are reshaping purchasing behavior and infrastructure planning, while emerging markets continue to modernize fleets through phased regulatory adoption. As connected fleet ecosystems mature, operational visibility and data-driven deployment are becoming central to Class 7 truck performance and profitability across global markets.
| Market Scope | |
|---|---|
| Start Year | 2025 |
| Forecast Year | 2026-2035 |
| Start Value | $65.3 Billion |
| Forecast Value | $106.9 Billion |
| CAGR | 5.2% |
Government policy and environmental regulation strongly influence Class 7 truck demand across global regions. Emission compliance frameworks and clean-fleet initiatives are driving faster turnover of existing vehicles, while evolving standards in developing economies are encouraging gradual fleet modernization. These policies shape powertrain selection, capital planning, and long-term operational investments, while connected fleet technologies are rapidly improving productivity and cost control.
The diesel powertrains segment held 80.81% share in 2025 and is forecast to grow at a CAGR of 4.6% through 2035. Diesel engines remain the preferred choice due to their strong torque delivery, fuel efficiency, durability, and favorable operating economics for medium-duty hauling. Widespread fuel availability further supports continued adoption across both mature and developing markets.
The freight delivery segment held 35% share in 2025 and is projected to grow at a CAGR of 5.3% from 2026 to 2035. Class 7 trucks offer an effective balance of payload capacity, maneuverability, and efficiency, making them suitable for medium-distance goods movement and high-frequency delivery operations driven by expanding commerce activity.
Asia Pacific Class 7 Truck Market held 65.5% share, generating USD 25.38 billion in 2025. Growth is supported by sustained infrastructure investment, expanding logistics networks, and policy-backed commercial vehicle upgrades that stimulate demand across construction support, municipal fleets, and regional freight transport.
Key participants active in the Global Class 7 truck market include Volvo, PACCAR, Daimler Trucks, Isuzu Motors, Traton, Ford, Volkswagen, SCANIA, Peterbilt, and Kenworth. To strengthen their positioning, Class 7 truck manufacturers focus on product portfolio diversification, technology integration, and strategic partnerships. Companies invest heavily in powertrain innovation, connected vehicle platforms, and advanced safety systems to align with regulatory and fleet efficiency expectations. Localization of production and supplier networks helps reduce costs and improve regional responsiveness. Manufacturers also expand aftermarket services, financing solutions, and fleet management support to build long-term customer relationships. Strategic collaborations with technology providers accelerate digital adoption, while continuous platform upgrades allow brands to address evolving logistics and infrastructure demands without sacrificing reliability or total cost of ownership.
Table of Contents
Chapter 1 Methodology
- 1.1 Research approach
- 1.2 Quality commitments
- 1.2.1 GMI AI policy & data integrity commitment
- 1.3 Research trail & confidence scoring
- 1.3.1 Research trail components
- 1.3.2 Scoring components
- 1.4 Data collection
- 1.4.1 Partial list of primary sources
- 1.5 Data mining sources
- 1.5.1 Paid sources
- 1.6 Base estimates and calculations
- 1.6.1 Base year calculation
- 1.7 Forecast model
- 1.8 Research transparency addendum
Chapter 2 Executive Summary
- 2.1 Industry 360° synopsis, 2022 - 2035
- 2.2 Key market trends
- 2.2.1 Regional
- 2.2.2 Fuel
- 2.2.3 Application
- 2.2.4 Axle
- 2.2.5 Horsepower
- 2.2.6 Ownership
- 2.2.7 Transmission
- 2.3 TAM Analysis, 2026-2035
- 2.4 CXO perspectives: Strategic imperatives
- 2.4.1 Executive decision points
- 2.4.2 Critical success factors
- 2.5 Future outlook and strategic recommendations
Chapter 3 Industry Insights
- 3.1 Industry ecosystem analysis
- 3.1.1 Supplier landscape
- 3.1.2 Profit margin analysis
- 3.1.3 Cost structure
- 3.1.4 Value addition at each stage
- 3.1.5 Factor affecting the value chain
- 3.1.6 Disruptions
- 3.2 Industry impact forces
- 3.2.1 Growth drivers
- 3.2.1.1 Increasing demand for electric & hybrid class 7 trucks across the globe
- 3.2.1.2 Growing freight transportation activities across North America
- 3.2.1.3 Implementation of stringent emission regulations in Europe
- 3.2.1.4 Rising investments in infrastructure development activities in Asia Pacific
- 3.2.1.5 Growing demand for class 7 from mining and oil & gas sector in MEA
- 3.2.2 Industry pitfalls and challenges
- 3.2.2.1 High initial and maintenance costs
- 3.2.2.2 Shortage of truck drivers
- 3.2.3 Market opportunities
- 3.2.3.1 Electrification of municipal and urban logistics fleets
- 3.2.3.2 Expansion of infrastructure and construction activities in emerging economies
- 3.2.3.3 Growth of flexible ownership, leasing, and Truck-as-a-Service (TaaS) models
- 3.2.3.4 Integration of advanced telematics and fleet analytics solutions
- 3.2.1 Growth drivers
- 3.3 Growth potential analysis
- 3.4 Regulatory landscape
- 3.4.1 North America
- 3.4.1.1 NEVI / IIJA, Advanced Clean Trucks (ACT) Regulation.
- 3.4.2 Europe
- 3.4.2.1 Germany: Electric Mobility Act (EmoG)
- 3.4.2.2 UK: Clean Vehicle Retrofit Accreditation Scheme (CVRAS), Ultra-Low Emission Zone (ULEZ)
- 3.4.2.3 France: Mobility Orientation Law (LOM Act)
- 3.4.2.4 Italy: National Integrated Plan for Energy and Climate (PNIEC)
- 3.4.3 Asia Pacific
- 3.4.3.1 China: New Energy Vehicle (NEV) Mandate
- 3.4.3.2 India: FAME II Scheme
- 3.4.3.3 Japan: Strategic Roadmap for EV/FCV Deployment
- 3.4.3.4 Australia: State-Level Zero-Emission Vehicle Mandates
- 3.4.4 Latin America
- 3.4.4.1 Brazil: National Electric Mobility Policy (PNME)
- 3.4.4.2 Mexico: Urban Zero-Emission Fleet Programs
- 3.4.4.3 Argentina: Provincial EV Incentive Regulations (Buenos Aires)
- 3.4.5 MEA
- 3.4.5.1 UAE: EV Charging Infrastructure Regulation (ADDM/DEWA)
- 3.4.5.2 Saudi Arabia: EV Deployment Regulatory Framework (SASO)
- 3.4.5.3 South Africa: Green Transport Strategy
- 3.4.1 North America
- 3.5 Porter's analysis
- 3.6 PESTEL analysis
- 3.7 Technology and Innovation landscape
- 3.7.1 Current technological trends
- 3.7.2 Emerging technologies
- 3.8 Patent analysis
- 3.9 Pricing Analysis
- 3.9.1 By region
- 3.9.2 By fuel
- 3.10 Production statistics
- 3.10.1 Production hubs
- 3.10.2 Consumption hubs
- 3.10.3 Export and import
- 3.11 Cost breakdown analysis
- 3.12 Sustainability and environmental impact analysis
- 3.12.1 Sustainable practices
- 3.12.2 Waste reduction strategies
- 3.12.3 Energy efficiency in production
- 3.12.4 Eco-friendly initiatives
- 3.12.5 Carbon footprint considerations
- 3.13 Future outlook & opportunities
- 3.14 Fleet procurement & buying behavior analysis
- 3.14.1 Purchase decision criteria for Class 7 trucks
- 3.14.2 OEM selection and brand preference factors
- 3.14.3 Impact of fuel, payload, and uptime on buying decisions
- 3.15 Residual value & used Class 7 truck market dynamics
- 3.16 Financing, leasing & Truck-as-a-Service (TaaS) economics
- 3.17 Aftermarket, service & parts economics
- 3.18 Powertrain transition & fuel migration pathways
Chapter 4 Competitive Landscape, 2025
- 4.1 Introduction
- 4.2 Company market share analysis
- 4.2.1 North America
- 4.2.2 Europe
- 4.2.3 Asia Pacific
- 4.2.4 Latin America
- 4.2.5 MEA
- 4.3 Competitive analysis of major market players
- 4.4 Competitive positioning matrix
- 4.5 Strategic outlook matrix
- 4.6 Key developments
- 4.6.1 Mergers & acquisitions
- 4.6.2 Partnerships & collaborations
- 4.6.3 New Product Launches
- 4.6.4 Expansion Plans and funding
Chapter 5 Market Estimates & Forecast, By Fuel, 2022 - 2035 ($Bn, Units)
- 5.1 Key trends
- 5.2 Diesel
- 5.3 Natural gas
- 5.4 Hybrid electric
- 5.5 Others
Chapter 6 Market Estimates & Forecast, By Application, 2022 - 2035 ($Bn, Units)
- 6.1 Key trends
- 6.2 Freight delivery
- 6.3 Utility services
- 6.4 Construction & mining
- 6.5 Others
Chapter 7 Market Estimates & Forecast, By Axle, 2022 - 2035 ($Bn, Units)
- 7.1 Key trends
- 7.2 4x2
- 7.3 6x4
- 7.4 6x2
Chapter 8 Market Estimates & Forecast, By Horsepower, 2022 - 2035 ($Bn, Units)
- 8.1 Key trends
- 8.2 Below 300HP
- 8.3 300HP - 400HP
- 8.4 400HP - 500HP
- 8.5 500HP & Above
Chapter 9 Market Estimates & Forecast, By Ownership, 2022 - 2035 ($Bn, Units)
- 9.1 Key trends
- 9.2 Fleet operator
- 9.3 Independent operator
Chapter 10 Market Estimates & Forecast, By Transmission, 2022 - 2035 ($Bn, Units)
- 10.1 Key trends
- 10.2 Manual transmission
- 10.3 Automatic transmission
Chapter 11 Market Estimates & Forecast, By Region, 2022 - 2035 ($Bn, Units)
- 11.1 Key trends
- 11.2 North America
- 11.2.1 US
- 11.2.2 Canada
- 11.3 Europe
- 11.3.1 Germany
- 11.3.2 UK
- 11.3.3 France
- 11.3.4 Italy
- 11.3.5 Spain
- 11.3.6 Russia
- 11.3.7 Nordics
- 11.4 Asia Pacific
- 11.4.1 China
- 11.4.2 India
- 11.4.3 Japan
- 11.4.4 Australia
- 11.4.5 South Korea
- 11.4.6 Philippines
- 11.4.7 Indonesia
- 11.5 Latin America
- 11.5.1 Brazil
- 11.5.2 Mexico
- 11.5.3 Argentina
- 11.6 MEA
- 11.6.1 South Africa
- 11.6.2 Saudi Arabia
- 11.6.3 UAE
Chapter 12 Company Profiles
- 12.1 Global Players
- 12.1.1 Daimler Truck
- 12.1.2 Ford Motor Company
- 12.1.3 Hino Motors
- 12.1.4 Isuzu Motors
- 12.1.5 Navistar
- 12.1.6 Scania
- 12.1.7 TRATON
- 12.1.8 Volvo Trucks
- 12.2 Regional Players
- 12.2.1 Ashok Leyland
- 12.2.2 BYD
- 12.2.3 Eicher Motor
- 12.2.4 GMC
- 12.2.5 Hyundai
- 12.2.6 JAC Motors
- 12.2.7 Kenworth
- 12.2.8 Kia
- 12.2.9 Mack Trucks
- 12.2.10 Mahindra & Mahindra
- 12.2.11 Mitsubishi Fuso Truck and Bus Corporation
- 12.2.12 Peterbilt
- 12.2.13 SML Isuzu
- 12.2.14 Tata Motors
- 12.3 Emerging Players
- 12.3.1 Dongfeng Motor
- 12.3.2 Rivian Automotive
- 12.3.3 SAIC Maxus
 2026年全球中重型商用車市場報告
 重型商用車市場規模、佔有率、成長和全球產業分析:按類型、應用和地區分類的洞察,以及 2026-2034 年的預測。中型商用車市場規模、佔有率、成長和全球行業分析:按類型、應用和地區的洞察,2026-2034年的預測
 8級卡車市場:按卡車類型、推進系統、變速箱、引擎功率和最終用途分類-2026-2032年全球預測全球7級卡車市場規模、佔有率、趨勢和成長分析報告(2026-2034年)全球8級卡車市場規模、佔有率、趨勢和成長分析報告(2026-2034年)
 中重型商用車排氣系統市場-全球產業規模、佔有率、趨勢、機會及預測(依燃料類型、後處理類型、零件類型、地區及競爭格局分類,2021-2031年)中重型商用車泵市場-全球產業規模、佔有率、趨勢、機會和預測:按泵類型、技術類型、銷售管道、地區和競爭格局分類,2021-2031年輕型商用車泵市場 - 全球產業規模、佔有率、趨勢、機會及預測(按泵浦類型、技術類型、銷售管道、地區和競爭格局分類,2021-2031年)
 8級卡車市場成長機會、成長要素、產業趨勢分析及2026年至2035年預測