


 |
市場調查報告書
商品編碼
1892865
汽車3D列印市場機會、成長促進因素、產業趨勢分析及預測(2026-2035年)Automotive 3D Printing Market Opportunity, Growth Drivers, Industry Trend Analysis, and Forecast 2026 - 2035 |
||||||
2025 年全球汽車 3D 列印市場價值為 59.3 億美元,預計到 2035 年將以 14.8% 的複合年成長率成長至 231.9 億美元。
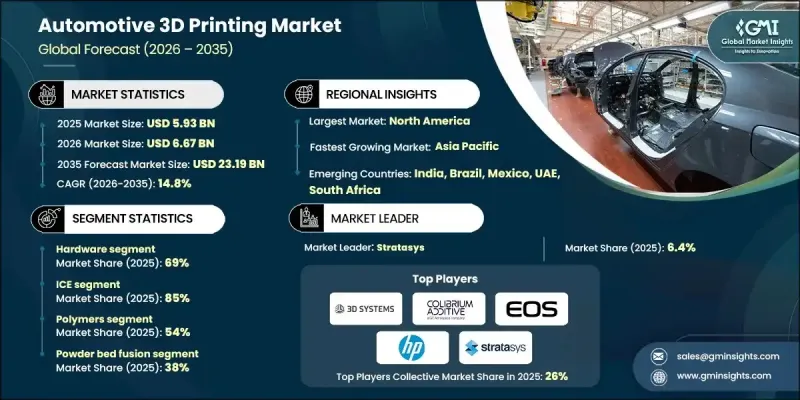
汽車製造商越來越依賴3D列印技術來加速設計測試和迭代,從而在大規模生產前減少缺陷。這些優勢對於新車型和電動車(EV)平台的推出尤其關鍵,能夠幫助製造商獲得競爭優勢,加快產品上市速度,並增強對消費者需求和監管標準的回應能力。輕量化汽車和電動車的日益普及進一步推動了市場成長,因為積層製造技術能夠生產更輕的零件,例如電池外殼、結構支撐和熱管理系統。更輕的零件可以提升車輛性能、提高能源效率並延長電動車的續航里程,這使得3D列印成為現代汽車設計和生產中不可或缺的工具。
| 市場範圍 | |
|---|---|
| 起始年份 | 2025 |
| 預測年份 | 2026-2035 |
| 起始值 | 59.3億美元 |
| 預測值 | 231.9億美元 |
| 複合年成長率 | 14.8% |
到 2025 年,硬體領域佔據了 69% 的市場佔有率,預計到 2035 年將以 15% 的複合年成長率成長。該領域包括粉末床熔融系統、材料擠出機、光固化成型設備、黏結劑噴射生產線和其他生產級 3D 列印硬體。
到 2025 年,內燃機 (ICE) 市佔率將達到 85%,預計從 2026 年到 2035 年將以 15.4% 的複合年成長率成長。傳統汽車應用繼續推動其普及,尤其是在快速原型製作和高性能零件生產方面。
預計2025年,美國汽車3D列印市場規模將達18.5億美元。電動汽車電池外殼、散熱部件和複雜支架的製造是推動3D列印技術應用的主要因素。美國汽車製造商正利用積層製造技術加速早期研發、生產精密零件並提升整體創新能力,進而增強該產業在全球的競爭力。
目錄
第1章:方法論
第2章:執行概要
第3章:行業洞察
- 產業生態系分析
- 供應商格局
- 利潤率
- 成本結構
- 每個階段的價值增加
- 影響價值鏈的因素
- 中斷
- 產業影響因素
- 成長促進因素
- 快速原型製作/加快產品上市速度
- 輕量化組件的需求
- 技術進步
- 供應鏈韌性與靈活性
- 產業陷阱與挑戰
- 材料限制和標準化問題
- 高成本和可擴展性挑戰
- 市場機遇
- 按需備件和售後替換件
- 大規模客製化/限量版車輛
- 電動車及下一代動力總成零件
- 永續/材料高效利用的生產方式
- 成長促進因素
- 成長潛力分析
- 監管環境
- 北美洲
- 聯邦機動車輛安全標準(FMVSS)
- 歐洲環境保護署(EPA)
- 歐洲
- VDA 指引(VDA 5)
- 歐盟型式認證/整車型式認證(WVTA)
- 亞太地區
- 中國GB(國標)國家標準
- 日本JIS要求
- 韓國KS認證
- 汽車業標準 140
- 泰國工業標準協會(TISI)
- 拉丁美洲
- INMETRO(國家計量研究院)
- INTI認證(Instituto Nacional de Tecnologia Industrial)
- NOM 標準(Norma Oficial Mexicana)
- 中東和非洲
- ESMA / 阿拉伯聯合大公國合格評定計劃 (ECAS)
- 海灣合作理事會技術法規
- SABS認證
- 北美洲
- 波特的分析
- PESTEL 分析
- 技術與創新格局
- 當前技術趨勢
- 新興技術
- 定價分析
- 依產品
- 按地區
- 成本細分分析
- 總擁有成本 (TCO) 框架
- 按技術類型分類的總擁有成本
- 單件成本分析
- 積層製造與傳統製造成本比較
- 專利分析
- 永續性和環境方面
- 永續實踐
- 減少廢棄物策略
- 生產中的能源效率
- 環保舉措
- 碳足跡考量
- 用例
第4章:競爭格局
- 介紹
- 公司市佔率分析
- 北美洲
- 歐洲
- 亞太地區
- 拉丁美洲
- MEA
- 主要市場參與者的競爭分析
- 競爭定位矩陣
- 戰略展望矩陣
- 關鍵進展
- 併購
- 合作夥伴關係與合作
- 新產品發布
- 擴張計劃和資金
第5章:市場估算與預測:依產品類型分類,2022-2035年
- 硬體
- 軟體
- 服務
第6章:市場估價與預測:依車輛類型分類,2022-2035年
- 冰
- 搭乘用車
- 商用車輛
- 電動車
- 搭乘用車
- 商用車輛
第7章:市場估計與預測:依材料分類,2022-2035年
- 金屬
- 鋁合金
- 不銹鋼
- 鈦合金
- 鈷鉻
- 其他
- 聚合物
- 陶瓷
- 複合材料
第8章:市場估算與預測:依技術分類,2022-2035年
- 材料擠出
- 槽式光聚合
- 粉末床熔融
- 材料噴射
- 黏結劑噴射成型
- 直接能量沉積
- 片材層壓
第9章:市場估算與預測:依應用領域分類,2022-2035年
- 快速原型製作與設計驗證
- 工具、夾具和工裝
- 生產零件/最終用途製造
- 備用零件及售後市場
第10章:市場估計與預測:依地區分類,2022-2035年
- 北美洲
- 美國
- 加拿大
- 歐洲
- 德國
- 英國
- 法國
- 義大利
- 西班牙
- 北歐
- 俄羅斯
- 波蘭
- 羅馬尼亞
- 亞太地區
- 中國
- 印度
- 日本
- 韓國
- 澳新銀行
- 越南
- 印尼
- 拉丁美洲
- 巴西
- 墨西哥
- 阿根廷
- MEA
- 南非
- 沙烏地阿拉伯
- 阿拉伯聯合大公國
第11章:公司簡介
- 全球公司
- D Systems
- AddUp Solutions
- Bright Laser Technologies (BLT)
- Desktop Metal
- EOS
- Eplus3 D Technology
- Farsoon Technologies
- GE Additive/Colibrium Additive
- HP
- Materialise
- Stratasys
- TRUMPF
- 區域玩家
- Additive Industries
- Formlabs
- Markforged
- Nikon SLM Solutions
- Renishaw
- Voxeljet
- 新興玩家
- Carbon
- Divergent Technologies
- Nano Dimension
- Nexa3 D
- Tritone Technologies
- Velo3 D
The Global Automotive 3D Printing Market was valued at USD 5.93 billion in 2025 and is estimated to grow at a CAGR of 14.8% to reach USD 23.19 billion by 2035.
Automotive manufacturers are increasingly relying on 3D printing to accelerate design testing and iteration, reducing defects before mass production. These advantages are particularly critical for the launch of new vehicle models and electric vehicle (EV) platforms, giving manufacturers a competitive edge, faster time-to-market, and enhanced ability to respond to consumer demand and regulatory standards. The growing adoption of lightweight vehicles and EVs has further fueled market growth, as additive manufacturing enables the production of lighter components, such as battery enclosures, structural supports, and thermal management systems. Lighter parts enhance vehicle performance, improve energy efficiency, and extend EV range, making 3D printing an essential tool in modern automotive design and production.
| Market Scope | |
|---|---|
| Start Year | 2025 |
| Forecast Year | 2026-2035 |
| Start Value | $5.93 Billion |
| Forecast Value | $23.19 Billion |
| CAGR | 14.8% |
The hardware segment held a 69% share in 2025 and is expected to grow at a CAGR of 15% through 2035. This segment includes powder bed fusion systems, material extrusion machines, vat photopolymerization equipment, binder jetting lines, and other production-class 3D printing hardware.
The internal combustion engine (ICE) segment held an 85% share in 2025, expected to grow at a CAGR of 15.4% from 2026 to 2035. Traditional automotive applications continue to drive adoption, particularly for rapid prototyping and high-performance component production.
US Automotive 3D Printing Market generated USD 1.85 billion in 2025. Adoption is driven by the manufacturing of EV battery housings, thermal management parts, and complex brackets. US vehicle manufacturers are leveraging additive manufacturing to accelerate early development, produce intricate components, and boost overall innovation, strengthening the industry's competitiveness globally.
Key players in the Global Automotive 3D Printing Market include Stratasys, 3D Systems, HP, EOS, SLM Solutions, Nikon SLM Solutions, Desktop Metal, Materialise, Colibrium Additive/GE Additive, and GE Additive. Companies in the Global Automotive 3D Printing Market are deploying multiple strategies to reinforce their market presence. Firms are investing in advanced hardware and multi-material printing technologies to meet the evolving demands of lightweight and complex automotive components. Strategic partnerships with automotive OEMs and tier-1 suppliers are being established to integrate additive manufacturing into standard production processes. Companies are expanding regional footprints to target emerging EV and ICE markets and offering cloud-based design platforms to streamline prototyping and design iteration.
Table of Contents
Chapter 1 Methodology
- 1.1 Market scope and definition
- 1.2 Research design
- 1.2.1 Research approach
- 1.2.2 Data collection methods
- 1.3 Data mining sources
- 1.3.1 Global
- 1.3.2 Regional/Country
- 1.4 Base estimates and calculations
- 1.4.1 Base year calculation
- 1.4.2 Key trends for market estimation
- 1.5 Primary research and validation
- 1.5.1 Primary sources
- 1.6 Forecast model
- 1.7 Research assumptions and limitations
Chapter 2 Executive Summary
- 2.1 Industry 360° synopsis
- 2.2 Key market trends
- 2.2.1 Regional
- 2.2.2 Offering
- 2.2.3 Vehicle
- 2.2.4 Material
- 2.2.5 Technology
- 2.2.6 Application
- 2.3 TAM analysis, 2026-2035
- 2.4 CXO perspectives: Strategic imperatives
- 2.4.1 Executive decision points
- 2.4.2 Critical success factors
- 2.5 Future outlook
- 2.6 Strategic recommendations
Chapter 3 Industry Insights
- 3.1 Industry ecosystem analysis
- 3.1.1 Supplier landscape
- 3.1.2 Profit margin
- 3.1.3 Cost structure
- 3.1.4 Value addition at each stage
- 3.1.5 Factor affecting the value chain
- 3.1.6 Disruptions
- 3.2 Industry impact forces
- 3.2.1 Growth drivers
- 3.2.1.1 Rapid prototyping / faster time-to-market
- 3.2.1.2 Lightweight components demand
- 3.2.1.3 Technological advances
- 3.2.1.4 Supply-chain resilience & flexibility
- 3.2.2 Industry pitfalls and challenges
- 3.2.2.1 Material limitations & standardization issues
- 3.2.2.2 High costs & scalability challenges
- 3.2.3 Market opportunities
- 3.2.3.1 On-demand spare parts & aftermarket replacements
- 3.2.3.2 Mass-customized / limited-edition vehicles
- 3.2.3.3 EV & next-gen powertrain components
- 3.2.3.4 Sustainable / material-efficient production
- 3.2.1 Growth drivers
- 3.3 Growth potential analysis
- 3.4 Regulatory landscape
- 3.4.1 North America
- 3.4.1.1 Federal Motor Vehicle Safety Standards (FMVSS)
- 3.4.1.2 Environmental Protection Agency (EPA)Europe
- 3.4.2 Europe
- 3.4.2.1 VDA Guidelines (VDA 5)
- 3.4.2.2 EU Type-Approval / Whole Vehicle Type Approval (WVTA)
- 3.4.3 Asia Pacific
- 3.4.3.1 China GB (Guobiao) national standards
- 3.4.3.2 Japan JIS requirements
- 3.4.3.3 Korea KS certification
- 3.4.3.4 Automotive Industry Standard 140
- 3.4.3.5 Thai Industrial Standards Institute (TISI)
- 3.4.4 Latin America
- 3.4.4.1 INMETRO (National Institute of Metrology)
- 3.4.4.2 INTI certification (Instituto Nacional de Tecnologia Industrial)
- 3.4.4.3 NOM standards (Norma Oficial Mexicana)
- 3.4.5 Middle East & Africa
- 3.4.5.1 ESMA / Emirates Conformity Assessment Scheme (ECAS)
- 3.4.5.2 GCC technical regulations
- 3.4.5.3 SABS certification
- 3.4.1 North America
- 3.5 Porter's analysis
- 3.6 PESTEL analysis
- 3.7 Technology and innovation landscape
- 3.7.1 Current technological trends
- 3.7.2 Emerging technologies
- 3.8 Pricing analysis
- 3.8.1.1 By product
- 3.8.1.2 By region
- 3.9 Cost breakdown analysis
- 3.9.1 Total cost of ownership (TCO) framework
- 3.9.2 TCO by technology type
- 3.9.3 Cost-per-part analysis
- 3.9.4 AM vs. traditional manufacturing cost comparison
- 3.10 Patent analysis
- 3.11 Sustainability and environmental aspects
- 3.11.1 Sustainable practices
- 3.11.2 Waste reduction strategies
- 3.11.3 Energy efficiency in production
- 3.11.4 Eco-friendly initiatives
- 3.11.5 Carbon footprint considerations
- 3.12 Use cases
Chapter 4 Competitive Landscape, 2025
- 4.1 Introduction
- 4.2 Company market share analysis
- 4.2.1 North America
- 4.2.2 Europe
- 4.2.3 Asia Pacific
- 4.2.4 LATAM
- 4.2.5 MEA
- 4.3 Competitive analysis of major market players
- 4.4 Competitive positioning matrix
- 4.5 Strategic outlook matrix
- 4.6 Key developments
- 4.6.1 Mergers & acquisitions
- 4.6.2 Partnerships & collaborations
- 4.6.3 New product launches
- 4.6.4 Expansion plans and funding
Chapter 5 Market Estimates & Forecast, By Offering, 2022 - 2035 ($Mn)
- 5.1 Key trends
- 5.2 Hardware
- 5.3 Software
- 5.4 Services
Chapter 6 Market Estimates & Forecast, By Vehicle, 2022 - 2035 ($Mn)
- 6.1 Key trends
- 6.2 ICE
- 6.2.1 Passenger cars
- 6.2.2 Commercial vehicles
- 6.3 EV
- 6.3.1 Passenger cars
- 6.3.2 Commercial vehicles
Chapter 7 Market Estimates & Forecast, By Material, 2022 - 2035 ($Mn)
- 7.1 Key trends
- 7.2 Metals
- 7.2.1 Aluminum alloys
- 7.2.2 Stainless steel
- 7.2.3 Titanium alloys
- 7.2.4 Cobalt chrome
- 7.2.5 Others
- 7.3 Polymers
- 7.4 Ceramics
- 7.5 Composites
Chapter 8 Market Estimates & Forecast, By Technology, 2022 - 2035 ($Mn)
- 8.1 Key trends
- 8.2 Material extrusion
- 8.3 Vat photopolymerization
- 8.4 Powder bed fusion
- 8.5 Material jetting
- 8.6 Binder jetting
- 8.7 Direct energy deposition
- 8.8 Sheet lamination
Chapter 9 Market Estimates & Forecast, By Application, 2022 - 2035 ($Mn)
- 9.1 Key trends
- 9.2 Rapid prototyping & design validation
- 9.3 Tooling, jigs & fixtures
- 9.4 Production parts/end-use manufacturing
- 9.5 Spare parts & aftermarket
Chapter 10 Market Estimates & Forecast, By Region, 2022 - 2035 ($Mn)
- 10.1 Key trends
- 10.2 North America
- 10.2.1 US
- 10.2.2 Canada
- 10.3 Europe
- 10.3.1 Germany
- 10.3.2 UK
- 10.3.3 France
- 10.3.4 Italy
- 10.3.5 Spain
- 10.3.6 Nordics
- 10.3.7 Russia
- 10.3.8 Poland
- 10.3.9 Romania
- 10.4 Asia Pacific
- 10.4.1 China
- 10.4.2 India
- 10.4.3 Japan
- 10.4.4 South Korea
- 10.4.5 ANZ
- 10.4.6 Vietnam
- 10.4.7 Indonesia
- 10.5 Latin America
- 10.5.1 Brazil
- 10.5.2 Mexico
- 10.5.3 Argentina
- 10.6 MEA
- 10.6.1 South Africa
- 10.6.2 Saudi Arabia
- 10.6.3 UAE
Chapter 11 Company Profiles
- 11.1 Global companies
- 11.1.1 D Systems
- 11.1.2 AddUp Solutions
- 11.1.3 Bright Laser Technologies (BLT)
- 11.1.4 Desktop Metal
- 11.1.5 EOS
- 11.1.6. Eplus3 D Technology
- 11.1.7 Farsoon Technologies
- 11.1.8 GE Additive/Colibrium Additive
- 11.1.9 HP
- 11.1.10 Materialise
- 11.1.11 Stratasys
- 11.1.12 TRUMPF
- 11.2 Regional players
- 11.2.1 Additive Industries
- 11.2.2 Formlabs
- 11.2.3 Markforged
- 11.2.4 Nikon SLM Solutions
- 11.2.5 Renishaw
- 11.2.6 Voxeljet
- 11.3 Emerging players
- 11.3.1 Carbon
- 11.3.2 Divergent Technologies
- 11.3.3 Nano Dimension
- 11.3.4. Nexa3 D
- 11.3.5 Tritone Technologies
- 11.3.6. Velo3 D
 汽車3D列印市場:依材料類型、製程、組件、設備、應用及最終用途分類-2026-2032年全球市場預測
 2026年全球汽車3D列印市場報告
 3D列印汽車市場-全球產業規模、佔有率、趨勢、競爭格局、機會及預測(按材料、技術、應用、地區和競爭情況分類,2021-2031年)汽車3D列印市場-全球產業規模、佔有率、趨勢、機會及預測(依技術、應用、區域及競爭格局分類,2021-2031年)
 汽車3D列印市場規模、佔有率和成長分析(按產品、組件、車輛類型、材料和地區分類)-產業預測(2026-2033年)
 汽車3D列印市場:2025-2030年預測
 全球汽車3D列印市場
 2025-2029 年全球 AI 影像轉 3D 生成器市場
 2032 年高性能生質塑膠市場預測:按產品類型、原料、製造流程、最終用戶和地區進行的全球分析
 室內生物塑膠市場機會、成長動力、產業趨勢分析及 2025 - 2034 年預測