

 |
市場調查報告書
商品編碼
1892837
矽光子學市場機會、成長促進因素、產業趨勢分析及預測(2026-2035年)Silicon Photonics Market Opportunity, Growth Drivers, Industry Trend Analysis, and Forecast 2026 - 2035 |
||||||
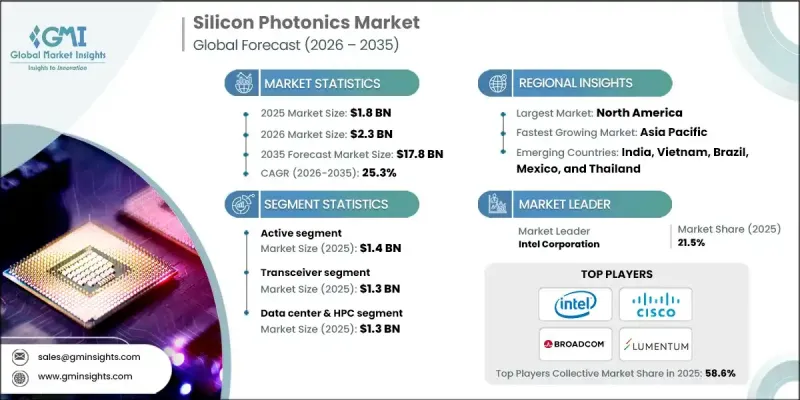
2025 年全球矽光子學市場價值為 18 億美元,預計到 2035 年將以 25.3% 的複合年成長率成長至 178 億美元。
為了滿足日益成長的雲端工作負載需求,超大規模資料中心正在迅速發展,這推動了對高頻寬、高能源效率光鏈路的需求。與傳統的銅互連相比,矽光子技術具有更低的延遲、更高的功率效率和更低的能耗,這對於千兆級資料中心和千兆級伺服器環境中的資料密集型操作至關重要。人工智慧和機器學習工作負載需要大規模並行處理以及GPU之間極高的資料傳輸速率,因此,對於低延遲、高速互連而言,矽光介面必不可少。全球電信營運商正在升級傳輸網路、城域網路和前傳網路,以應對不斷成長的5G流量並為早期部署6G做好準備,這使得矽光子技術成為一種經濟高效的解決方案,既能擴展網路頻寬,又能最佳化功耗。此外,對支援下一代超級電腦、智慧網路和先進通訊基礎設施的緊湊型、高能源效率光互連的需求,也進一步推動了市場的發展。
| 市場範圍 | |
|---|---|
| 起始年份 | 2025 |
| 預測年份 | 2026-2035 |
| 起始值 | 18億美元 |
| 預測值 | 178億美元 |
| 複合年成長率 | 25.3% |
2025年,有源光模組市場規模將達14億美元。其成長主要得益於光纖骨幹網路的擴展和5G基礎設施的部署,這需要高速、低延遲的光互連和交換技術。製造商正致力於最佳化調製器和光電探測器的主動模組,以支援經濟高效的資料中心和5G回傳應用,同時實現與現有光纖網路的無縫整合。
預計2026年至2035年間,感測器市場將以33.4%的複合年成長率成長。推動感測器市場普及的因素包括非通訊應用(如醫療診斷和汽車LiDAR)以及物聯網、智慧出行和智慧醫療等需要緊湊、高靈敏度光學感測器的領域。
預計到 2035 年,加拿大矽光子學市場將以 12.4% 的複合年成長率成長。截至 2024 年,加拿大擁有超過 239 個營運中的資料中心,並且還有幾個新的設施正在開發中。加拿大有利的氣候和低成本再生能源(包括水力發電)的獲取,使該國成為資料中心擴張和高速光互連技術應用的戰略中心。
目錄
第1章:方法論與範圍
第2章:執行概要
第3章:行業洞察
- 產業生態系分析
- 影響價值鏈的因素
- 利潤率分析
- 中斷
- 未來展望
- 製造商
- 經銷商
- 衝擊力
- 成長促進因素
- 資料中心需求不斷成長
- AI/ML工作負載的爆炸性成長與GPU叢集的擴展
- 電信升級至 5G Advanced 和早期 6G 發展
- 消費性電子產品的普及率不斷提高
- 汽車和工業雷射雷達的新興需求
- 產業陷阱與挑戰
- 片上雷射的整合與良率管理
- 高昂的開發和生產成本
- 成長促進因素
- 成長潛力分析
- 監管環境
- 北美洲
- 歐洲
- 亞太地區
- 拉丁美洲
- 中東和非洲
- 波特的分析
- PESTEL 分析
- 技術與創新格局
- 當前技術趨勢
- 新興技術
- 新興商業模式
- 合規要求
- 永續性措施
- 消費者情緒分析
- 專利和智慧財產權分析
- 地緣政治與貿易動態
第4章:競爭格局
- 介紹
- 公司市佔率分析
- 按地區
- 北美洲
- 歐洲
- 亞太地區
- 拉丁美洲
- 中東和非洲
- 市場集中度分析
- 按地區
- 主要參與者的競爭基準化分析
- 財務績效比較
- 收入
- 利潤率
- 研發
- 產品組合比較
- 產品範圍廣度
- 科技
- 創新
- 地理分佈比較
- 全球足跡分析
- 服務網路覆蓋範圍
- 按地區分類的市場滲透率
- 競爭定位矩陣
- 領導人
- 挑戰者
- 追蹤者
- 小眾玩家
- 戰略展望矩陣
- 財務績效比較
- 2021-2024 年主要發展動態
- 併購
- 夥伴關係與合作
- 技術進步
- 擴張和投資策略
- 永續發展計劃
- 數位轉型計劃
- 新興/新創企業競爭對手格局
第5章:市場估算與預測:依產品分類,2022-2035年
- 收發器
- 可變光衰減器
- 轉變
- 電纜
- 感應器
- 其他
第6章:市場估算與預測:依組件分類,2022-2035年
- 積極的
- 雷射
- 數據機
- 光電探測器
- 其他
- 被動的
- 篩選
- 波導
第7章:市場估算與預測:依應用領域分類,2022-2035年
- 資料中心和高效能運算
- 電信
- 醫療的
- 其他
第8章:市場估算與預測:依地區分類,2022-2035年
- 北美洲
- 美國
- 加拿大
- 歐洲
- 英國
- 德國
- 法國
- 義大利
- 西班牙
- 俄羅斯
- 亞太地區
- 中國
- 印度
- 日本
- 韓國
- 澳洲
- 拉丁美洲
- 巴西
- 墨西哥
- MEA
- 南非
- 沙烏地阿拉伯
- 阿拉伯聯合大公國
第9章:公司簡介
- 全球關鍵參與者
- Intel
- IBM
- Cisco
- Broadcom
- Ciena
- Juniper
- 區域關鍵參與者
- 北美洲
- Finisar
- Mellanox
- Luxtera
- Acacia
- 歐洲
- STMicroelectronics
- Rockley Photonics
- Reflex Photonics
- Sicoya
- 亞太地區
- Hamamatsu
- Oclaro
- Ranovus
- GlobalFoundries
- 北美洲
- 小眾/顛覆者
- Neophotonics
The Global Silicon Photonics Market was valued at USD 1.8 billion in 2025 and is estimated to grow at a CAGR of 25.3% to reach USD 17.8 billion by 2035.
The rapid growth of hyperscale data centers to accommodate increasing cloud workloads is driving the demand for high-bandwidth, energy-efficient optical links. Silicon photonics provides lower latency, higher power efficiency, and reduced energy consumption compared to traditional copper interconnects, which is critical for data-intensive operations in multi-gigawatt data centers and multi-gig server environments. AI and machine learning workloads require massive parallel processing and extremely high data-transfer rates between GPUs, making optical silicon interfaces essential for low-latency, high-speed interconnections. Telecom operators worldwide are upgrading transport, metro, and fronthaul networks to handle escalating 5G traffic and prepare for early 6G deployment, positioning silicon photonics as a cost-effective solution for scaling network bandwidth while optimizing power consumption. The market is being further propelled by the need for compact, energy-efficient optical interconnects that support next-generation supercomputers, smart networking, and advanced communication infrastructures.
| Market Scope | |
|---|---|
| Start Year | 2025 |
| Forecast Year | 2026-2035 |
| Start Value | $1.8 Billion |
| Forecast Value | $17.8 billion |
| CAGR | 25.3% |
The active segment reached USD 1.4 billion in 2025. Its growth is fueled by expanding fiber backbones and 5G infrastructure deployments, which require high-speed, low-latency optical interconnects and switching. Manufacturers are focusing on optimizing active modules for modulators and photodetectors to support cost-effective data center and 5G backhaul applications while integrating seamlessly into existing fiber networks.
The sensor segment is projected to grow at a CAGR of 33.4% during 2026-2035. Adoption is being driven by non-communication applications such as healthcare diagnostics and automotive LiDAR, as well as IoT, smart mobility, and smart-health initiatives that demand compact, highly sensitive optical sensors.
Canada Silicon Photonics Market is expected to grow at a CAGR of 12.4% by 2035. With over 239 operational data centers as of 2024 and several new facilities under development, Canada's favorable climate and access to low-cost renewable energy, including hydro, position the country as a strategic hub for data center expansion and high-speed optical interconnect adoption.
Leading companies in the Global Silicon Photonics Market include Intel, Cisco, Ciena, Broadcom, Hamamatsu, Juniper, STMicroelectronics, Acacia, Finisar, Global Foundries, IBM, Lumentum, Luxtera, Mellanox, Neophotonics, Oclaro, Ranovus, Reflex Photonics, Rockley Photonics, and Sicoya. Key strategies adopted by companies in the Global Silicon Photonics Market include investing in research and development to enhance optical performance, energy efficiency, and miniaturization. Firms are forming strategic partnerships with cloud service providers, data center operators, and telecom companies to accelerate adoption. Expanding regional presence and targeting emerging markets allow companies to capture new growth opportunities. Additionally, they are focusing on integrated solutions that combine active and passive components for cost-effective deployment.
Table of Contents
Chapter 1 Methodology & Scope
- 1.1 Market scope and definition
- 1.2 Research design
- 1.2.1 Research approach
- 1.2.2 Data collection methods
- 1.3 Data mining sources
- 1.3.1 Global
- 1.3.2 Regional/Country
- 1.4 Base estimates and calculations
- 1.4.1 Base year calculation
- 1.4.2 Key trends for market estimation
- 1.5 Primary research and validation
- 1.5.1 Primary sources
- 1.6 Forecast model
- 1.7 Research assumptions and limitations
Chapter 2 Executive Summary
- 2.1 Industry 360° synopsis
- 2.2 Key market trends
- 2.2.1 Product trends
- 2.2.2 Component trends
- 2.2.3 Application trends
- 2.2.4 Regional trends
- 2.3 TAM Analysis, 2026-2035 (USD Million)
- 2.4 CXO perspectives: Strategic imperatives
- 2.4.1 Executive decision points
- 2.4.2 Critical Success Factors
- 2.5 Future Outlook and Strategic Recommendations
Chapter 3 Industry Insights
- 3.1 Industry ecosystem analysis
- 3.1.1 Factor affecting the value chain
- 3.1.2 Profit margin analysis
- 3.1.3 Disruptions
- 3.1.4 Future outlook
- 3.1.5 Manufacturers
- 3.1.6 Distributors
- 3.2 Impact forces
- 3.2.1 Growth drivers
- 3.2.1.1 Rising data center demands
- 3.2.1.2 Explosive AI/ML Workload Growth and GPU Cluster Expansion
- 3.2.1.3 Telecom Upgrades to 5G Advanced and Early 6G Development
- 3.2.1.4 Increasing adoption in consumer electronics
- 3.2.1.5 Emerging Demand from Automotive and Industrial LiDAR
- 3.2.2 Industry pitfalls & challenges
- 3.2.2.1 Integration of On-Chip Lasers and Yield Management
- 3.2.2.2 High development and production costs
- 3.2.1 Growth drivers
- 3.3 Growth potential analysis
- 3.4 Regulatory landscape
- 3.4.1 North America
- 3.4.2 Europe
- 3.4.3 Asia Pacific
- 3.4.4 Latin America
- 3.4.5 Middle East & Africa
- 3.5 Porter's analysis
- 3.6 PESTEL analysis
- 3.7 Technology and Innovation landscape
- 3.7.1 Current technological trends
- 3.7.2 Emerging technologies
- 3.8 Emerging Business Models
- 3.9 Compliance Requirements
- 3.10 Sustainability Measures
- 3.11 Consumer Sentiment Analysis
- 3.12 Patent and IP analysis
- 3.13 Geopolitical and trade dynamics
Chapter 4 Competitive Landscape, 2025
- 4.1 Introduction
- 4.2 Company market share analysis
- 4.2.1 By region
- 4.2.1.1 North America
- 4.2.1.2 Europe
- 4.2.1.3 Asia Pacific
- 4.2.1.4 Latin America
- 4.2.1.5 Middle East & Africa
- 4.2.2 Market Concentration Analysis
- 4.2.1 By region
- 4.3 Competitive Benchmarking of key Players
- 4.3.1 Financial Performance Comparison
- 4.3.1.1 Revenue
- 4.3.1.2 Profit Margin
- 4.3.1.3 R&D
- 4.3.2 Product Portfolio Comparison
- 4.3.2.1 Product Range Breadth
- 4.3.2.2 Technology
- 4.3.2.3 Innovation
- 4.3.3 Geographic Presence Comparison
- 4.3.3.1 Global Footprint Analysis
- 4.3.3.2 Service Network Coverage
- 4.3.3.3 Market Penetration by Region
- 4.3.4 Competitive Positioning Matrix
- 4.3.4.1 Leaders
- 4.3.4.2 Challengers
- 4.3.4.3 Followers
- 4.3.4.4 Niche Players
- 4.3.5 Strategic outlook matrix
- 4.3.1 Financial Performance Comparison
- 4.4 Key developments, 2021-2024
- 4.4.1 Mergers and Acquisitions
- 4.4.2 Partnerships and Collaborations
- 4.4.3 Technological Advancements
- 4.4.4 Expansion and Investment Strategies
- 4.4.5 Sustainability Initiatives
- 4.4.6 Digital Transformation Initiatives
- 4.5 Emerging/ Startup Competitors Landscape
Chapter 5 Market Estimates & Forecast, By Product, 2022-2035 (USD Million)
- 5.1 Key trends
- 5.2 Transceivers
- 5.3 Variable optical attenuator
- 5.4 Switch
- 5.5 Cable
- 5.6 Sensor
- 5.7 Others
Chapter 6 Market Estimates & Forecast, By Component, 2022-2035 (USD Million)
- 6.1 Key trends
- 6.2 Active
- 6.2.1 Laser
- 6.2.2 Modulator
- 6.2.3 Photodetector
- 6.2.4 Others
- 6.3 Passive
- 6.3.1 Filter
- 6.3.2 Waveguide
Chapter 7 Market Estimates & Forecast, By Application, 2022-2035 (USD Million)
- 7.1 Key trends
- 7.2 Data center & HPC
- 7.3 Telecommunications
- 7.4 Medical
- 7.5 Others
Chapter 8 Market Estimates & Forecast, By Region, 2022-2035 (USD Million)
- 8.1 Key trends
- 8.2 North America
- 8.2.1 U.S.
- 8.2.2 Canada
- 8.3 Europe
- 8.3.1 UK
- 8.3.2 Germany
- 8.3.3 France
- 8.3.4 Italy
- 8.3.5 Spain
- 8.3.6 Russia
- 8.4 Asia Pacific
- 8.4.1 China
- 8.4.2 India
- 8.4.3 Japan
- 8.4.4 South Korea
- 8.4.5 Australia
- 8.5 Latin America
- 8.5.1 Brazil
- 8.5.2 Mexico
- 8.6 MEA
- 8.6.1 South Africa
- 8.6.2 Saudi Arabia
- 8.6.3 UAE
Chapter 9 Company Profiles
- 9.1 Global Key Players
- 9.1.1 Intel
- 9.1.2 IBM
- 9.1.3 Cisco
- 9.1.4 Broadcom
- 9.1.5 Ciena
- 9.1.6 Juniper
- 9.2 Regional Key Players
- 9.2.1 North America
- 9.2.1.1 Finisar
- 9.2.1.2 Mellanox
- 9.2.1.3 Luxtera
- 9.2.1.4 Acacia
- 9.2.2 Europe
- 9.2.2.1 STMicroelectronics
- 9.2.2.2 Rockley Photonics
- 9.2.2.3 Reflex Photonics
- 9.2.2.4 Sicoya
- 9.2.3 Asia Pacific
- 9.2.3.1 Hamamatsu
- 9.2.3.2 Oclaro
- 9.2.3.3 Ranovus
- 9.2.3.4 GlobalFoundries
- 9.2.1 North America
- 9.3 Niche / Disruptors
- 9.3.1 Neophotonics
 矽光電市場-全球產業規模、佔有率、趨勢、機會、預測:按組件、應用、波導管、產品、材料、地區和競爭對手分類,2021-2031年
 矽光電市場:依產品類型、組件和最終用途分類-2026-2032年全球市場預測
 全球光子封裝市場(2026-2036)
 2026年III-V族矽光電全球市場報告
 矽光電市場:依組件、產品、應用、國家及地區分類-全球產業分析、市場規模、市場佔有率及2025年至2032年預測
 矽光電市場分析及預測(至2035年):依類型、產品、服務、技術、組件、應用、材料類型、裝置、部署及最終用戶分類2026-2034年全球矽光電市場規模、佔有率、趨勢和成長分析報告
 矽光電市場報告:按產品、組件、應用和地區分類(2026-2034 年)2026年全球矽光電市場報告全球矽光子市場:市場規模、佔有率、成長率、產業分析、依類型、應用和地區劃分的分析以及未來預測(2026-2034)