

 |
市場調查報告書
商品編碼
1892696
消費性電子設備光子計算組件市場機會、成長促進因素、產業趨勢分析及預測(2025-2034年)Photonic Computing Components for Consumer Devices Market Opportunity, Growth Drivers, Industry Trend Analysis, and Forecast 2025 - 2034 |
||||||
2024 年全球消費性設備光子運算組件市場價值為 4.85 億美元,預計到 2034 年將以 18.5% 的複合年成長率成長至 25.5 億美元。
消費性電子產品中人工智慧工作負載日益成長的運算需求推動了光子計算加速器的應用,進而促進了市場成長。各國政府和研究機構正大力投資光子系統,以克服傳統電子人工智慧處理器的固有限制。不斷成長的資料生成和處理需求,尤其是在需要高頻寬的設備中,進一步推動了市場發展。 5G 的部署和 6G 技術的開發,也為支援更快的連接速度創造了對光子組件的額外需求。此外,利用成熟的 CMOS 製造製程降低了生產成本,使得光子解決方案能夠在消費性電子產品中得到更快、更廣泛的應用,進而提升設備的效能、效率和緊湊性。
| 市場範圍 | |
|---|---|
| 起始年份 | 2024 |
| 預測年份 | 2025-2034 |
| 起始值 | 4.85億美元 |
| 預測值 | 25.5億美元 |
| 複合年成長率 | 18.5% |
2024年,矽光子學(SOI)領域創造了2.558億美元的收入。 SOI平台具有高整合度和卓越性能,可將數千個組件嵌入到小於10平方毫米的晶片上。這種緊湊的設計提高了消費性電子設備的效率和效能,實現了更快的資料傳輸和更低的功耗。
預計到2024年,AR/VR設備市場將佔據46%的佔有率。這些設備需要高速資料處理、極低延遲和緊湊的外形尺寸,因此成為光子運算元件的主要應用領域。輕巧的AR眼鏡和VR頭顯由於對尺寸和重量的嚴格限制,能夠顯著受益於光子解決方案,在提升用戶體驗的同時提供高性能。
美國消費性電子設備光子計算組件市佔率高達74.9%。該國的成長得益於對先進計算技術的巨額投資以及主要行業參與者的存在。政府的各項舉措,包括對量子和光子技術研究的專項資助,進一步鞏固了美國在該領域的領先地位,並推動了消費電子設備的創新。
目錄
第1章:方法論與範圍
第2章:執行概要
第3章:行業洞察
- 產業生態系分析
- 供應商格局
- 利潤率
- 每個階段的價值增加
- 影響價值鏈的因素
- 產業影響因素
- 成長促進因素
- 對高速資料處理的需求
- 能源效率和熱管理
- 整合光子學和小型化技術的進步
- 產業陷阱與挑戰
- 成本高且製造流程複雜
- 與現有電子架構的兼容性
- 機會
- 人工智慧和邊緣運算加速
- 新興的擴增實境/虛擬實境與元宇宙應用
- 成長促進因素
- 成長潛力分析
- 未來市場趨勢
- 技術與創新格局
- 當前技術趨勢
- 新興技術
- 監管環境
- 標準和合規要求
- 區域監理框架
- 認證標準
- 差距分析
- 風險評估與緩解
- 波特的分析
- PESTEL 分析
- 消費者行為分析
- 購買模式
- 偏好分析
- 消費者行為的區域差異
第4章:競爭格局
- 介紹
- 公司市佔率分析
- 按地區
- 公司矩陣分析
- 主要市場參與者的競爭分析
- 競爭定位矩陣
- 關鍵進展
- 併購
- 合作夥伴關係與合作
- 新產品發布
- 擴張計劃
第5章:市場估計與預測:依技術平台分類,2021-2034年
- 矽光子學(SOI)
- 薄膜鈮酸鋰(TFLN/LNOI)
- 氮化矽(SiN/Si3N4)
- 磷化銦(InP)
- 其他新興平台技術
第6章:市場估算與預測:依組件功能分類,2021-2034年
- 光波導
- 光調製器
- 光電探測器
- 光源
- 光開關和路由組件
- 耦合與介面元件
第7章:市場估算與預測:依消費性電子設備應用分類,2021-2034年
- AR/VR設備
- 智慧型手機和平板電腦
- 汽車系統
- 穿戴式裝置
- 遊戲系統
- 物聯網和邊緣設備
- 其他
第8章:市場估算與預測:依地區分類,2021-2034年
- 北美洲
- 美國
- 加拿大
- 歐洲
- 德國
- 法國
- 英國
- 義大利
- 西班牙
- 俄羅斯
- 亞太地區
- 中國
- 印度
- 日本
- 韓國
- 澳洲
- 拉丁美洲
- 巴西
- 墨西哥
- MEA
- 南非
- 沙烏地阿拉伯
- 阿拉伯聯合大公國
第9章:公司簡介
- Analog Photonics
- Ayar Labs Inc.
- Broadcom Inc.
- Cisco Systems Inc.
- Coherent Corp.
- Intel Corporation
- Lightmatter Inc.
- LIGENTEC SA
- Marvell Technology Inc.
- NVIDIA Corporation
- PICadvanced
- PsiQuantum
- Q.ANT
- Salience Labs
- Xanadu Quantum Technologies
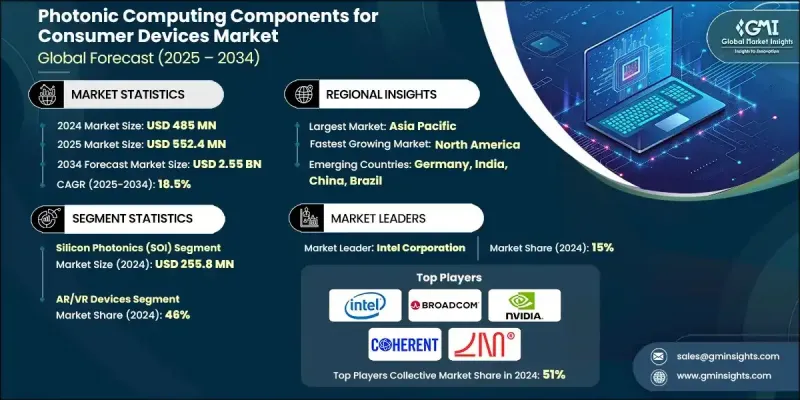
The Global Photonic Computing Components for Consumer Devices Market was valued at USD 485 million in 2024 and is estimated to grow at a CAGR of 18.5% to reach USD 2.55 billion by 2034.
Growth is driven by the increasing computational demands of artificial intelligence workloads on consumer electronics, which are fueling the adoption of photonic computing accelerators. Governments and research organizations are investing heavily in photonic systems to overcome the inherent limitations of traditional electronic AI processors. Rising data generation and processing requirements, particularly in devices requiring high bandwidth, are further propelling the market. The rollout of 5G and the development of 6G technologies are creating additional demand for photonic components to support faster connectivity. Moreover, leveraging established CMOS manufacturing processes has reduced production costs, allowing faster and broader adoption of photonic solutions across consumer electronics, enhancing the performance, efficiency, and compactness of devices.
| Market Scope | |
|---|---|
| Start Year | 2024 |
| Forecast Year | 2025-2034 |
| Start Value | $485 Million |
| Forecast Value | $2.55 Billion |
| CAGR | 18.5% |
The silicon photonics (SOI) segment generated USD 255.8 million in 2024. SOI platforms provide high integration density and superior performance, allowing thousands of components to be embedded on chips smaller than 10mm2. This compact design improves efficiency and performance in consumer devices, enabling faster data transfer and lower power consumption.
The AR/VR devices segment held a 46% share in 2024. These devices require high-speed data processing, minimal latency, and compact form factors, making them prime consumers of photonic computing components. Lightweight AR glasses and VR headsets benefit significantly from photonic solutions due to stringent size and weight constraints, enhancing the user experience while delivering high performance.
U.S. Photonic Computing Components for Consumer Devices Market held 74.9% share. The country's growth is supported by substantial investments in advanced computing technologies and the presence of key industry players. Government initiatives, including dedicated funding for research in quantum and photonic technologies, further strengthen the U.S. position, enabling innovation in consumer devices.
Key companies in the Global Photonic Computing Components for Consumer Devices Market for consumer devices include Broadcom Inc., Lightmatter Inc., Intel Corporation, Coherent Corp., Analog Photonics, Marvell Technology Inc., Cisco Systems Inc., LIGENTEC SA, Ayar Labs Inc., PsiQuantum, PICadvanced, NVIDIA Corporation, Q.ANT, Salience Labs, and Xanadu Quantum Technologies. Companies in the Photonic Computing Components for Consumer Devices Market are focusing on innovation, strategic partnerships, and ecosystem development to strengthen their position. They invest heavily in R&D to enhance the efficiency, speed, and integration density of photonic components. Collaborations with consumer electronics and semiconductor manufacturers help secure long-term adoption in high-demand devices. Leveraging scalable CMOS manufacturing reduces costs and accelerates production. Firms are expanding geographically and building robust supply chains while emphasizing energy efficiency and compactness in their products.
Table of Contents
Chapter 1 Methodology & Scope
- 1.1 Market scope and definition
- 1.2 Research design
- 1.2.1 Research approach
- 1.2.2 Data collection methods
- 1.3 Data mining sources
- 1.3.1 Global
- 1.3.2 Regional
- 1.4 Base estimates and calculations
- 1.4.1 Base year calculation
- 1.4.2 Key trends for market estimation
- 1.5 Primary research and validation
- 1.5.1 Primary sources
- 1.6 Forecast model
- 1.7 Research assumptions and limitations
Chapter 2 Executive Summary
- 2.1 Industry 360° synopsis
- 2.2 Key market trends
- 2.2.1 Regional
- 2.2.2 Technology platform
- 2.2.3 Component function
- 2.2.4 Consumer device application
- 2.3 CXO perspectives: Strategic imperatives
- 2.3.1 Key decision points for industry executives
- 2.3.2 Critical success factors for market players
- 2.4 Future outlook and strategic recommendations
Chapter 3 Industry Insights
- 3.1 Industry ecosystem analysis
- 3.1.1 Supplier landscape
- 3.1.2 Profit margin
- 3.1.3 Value addition at each stage
- 3.1.4 Factor affecting the value chain
- 3.2 Industry impact forces
- 3.2.1 Growth drivers
- 3.2.1.1 Demand for high-speed data processing
- 3.2.1.2 Energy efficiency and thermal management
- 3.2.1.3 Advancements in integrated photonics and miniaturization
- 3.2.2 Industry pitfalls & challenges
- 3.2.2.1 High cost and manufacturing complexity
- 3.2.2.2 Compatibility with existing electronic architectures
- 3.2.3 Opportunities
- 3.2.3.1 AI and edge computing acceleration
- 3.2.3.2 Emerging AR/VR and metaverse applications
- 3.2.1 Growth drivers
- 3.3 Growth potential analysis
- 3.4 Future market trends
- 3.5 Technology and innovation landscape
- 3.5.1 Current technological trends
- 3.5.2 Emerging technologies
- 3.6 Regulatory landscape
- 3.6.1 Standards and compliance requirements
- 3.6.2 Regional regulatory frameworks
- 3.6.3 Certification standards
- 3.7 Gap analysis
- 3.8 Risk assessment and mitigation
- 3.9 Porter's analysis
- 3.10 PESTEL analysis
- 3.11 Consumer behaviour analysis
- 3.11.1 Purchasing patterns
- 3.11.2 Preference analysis
- 3.11.3 Regional variations in consumer behaviour
Chapter 4 Competitive Landscape, 2024
- 4.1 Introduction
- 4.2 Company market share analysis
- 4.2.1 By region
- 4.2.1.1 North America
- 4.2.1.2 Europe
- 4.2.1.3 Asia Pacific
- 4.2.1.4 Latin America
- 4.2.1.5 Middle East and Africa
- 4.2.1 By region
- 4.3 Company matrix analysis
- 4.4 Competitive analysis of major market players
- 4.5 Competitive positioning matrix
- 4.6 Key developments
- 4.6.1 Mergers & acquisitions
- 4.6.2 Partnerships & collaborations
- 4.6.3 New product launches
- 4.6.4 Expansion plans
Chapter 5 Market Estimates & Forecast, By Technology Platform, 2021-2034 (USD Million) (Thousand Units)
- 5.1 Key trends
- 5.2 Silicon photonics (SOI)
- 5.3 Thin-film lithium niobate (TFLN/LNOI)
- 5.4 Silicon nitride (SiN/Si3N4)
- 5.5 Indium phosphide (InP)
- 5.6 Others emerging platform technologies
Chapter 6 Market Estimates & Forecast, By Component Function, 2021-2034 (USD Million) (Thousand Units)
- 6.1 Key trends
- 6.2 Optical waveguides
- 6.3 Optical modulators
- 6.4 photodetectors
- 6.5 Light sources
- 6.6 Optical switches & routing components
- 6.7 Coupling & interface components
Chapter 7 Market Estimates & Forecast, By Consumer Device Application, 2021-2034 (USD Million) (Thousand Units)
- 7.1 Key trends
- 7.2 AR/VR devices
- 7.3 Smartphones & tablets
- 7.4 Automotive systems
- 7.5 Wearable devices
- 7.6 Gaming systems
- 7.7 IoT & edge devices
- 7.8 Others
Chapter 8 Market Estimates & Forecast, By Region, 2021-2034 (USD Million) (Thousand Units)
- 8.1 Key trends
- 8.2 North America
- 8.2.1 U.S.
- 8.2.2 Canada
- 8.3 Europe
- 8.3.1 Germany
- 8.3.2 France
- 8.3.3 UK
- 8.3.4 Italy
- 8.3.5 Spain
- 8.3.6 Russia
- 8.4 Asia Pacific
- 8.4.1 China
- 8.4.2 India
- 8.4.3 Japan
- 8.4.4 South Korea
- 8.4.5 Australia
- 8.5 Latin America
- 8.5.1 Brazil
- 8.5.2 Mexico
- 8.6 MEA
- 8.6.1 South Africa
- 8.6.2 Saudi Arabia
- 8.6.3 UAE
Chapter 9 Company Profiles
- 9.1 Analog Photonics
- 9.2 Ayar Labs Inc.
- 9.3 Broadcom Inc.
- 9.4 Cisco Systems Inc.
- 9.5 Coherent Corp.
- 9.6 Intel Corporation
- 9.7 Lightmatter Inc.
- 9.8 LIGENTEC SA
- 9.9 Marvell Technology Inc.
- 9.10 NVIDIA Corporation
- 9.11 PICadvanced
- 9.12 PsiQuantum
- 9.13 Q.ANT
- 9.14 Salience Labs
- 9.15 Xanadu Quantum Technologies
 光子整合運算市場預測至2034年-全球分析(按整合類型、組件、材料平台、運算架構、波長範圍、應用、最終用戶和地區分類)
 全球光計算市場(2026-2036 年)全球量子光學計算市場(2026-2036 年)
 無線電頻率積體電路(RFIC) 市場分析及至 2035 年預測:按類型、產品類型、技術、組件、應用、材料類型、裝置、最終用戶、功能和安裝配置分類
 光子量子電腦市場可印刷光子電路市場分析及預測(至2035年):依類型、產品類型、技術、組件、應用、材料類型、裝置、製程及最終用戶分類
 2026年全球厚膜混合積體電路市場報告
 無線電頻率積體電路市場-全球產業規模、佔有率、趨勢、機會、預測:按應用、垂直市場、地區和競爭格局分類,2021-2031年
 低功耗藍牙SoC晶片市場:按設定檔版本、整合類型、應用和最終用戶產業分類-全球預測,2026-2032年全球光學量子運算平台市場(按組件、技術類型、部署類型、服務類型、應用和最終用戶分類)預測(2026-2032年)