

 |
市場調查報告書
商品編碼
1892685
集換式卡牌遊戲市場機會、成長促進因素、產業趨勢分析及預測(2026-2035年)Trading Card Games Market Opportunity, Growth Drivers, Industry Trend Analysis, and Forecast 2026 - 2035 |
||||||
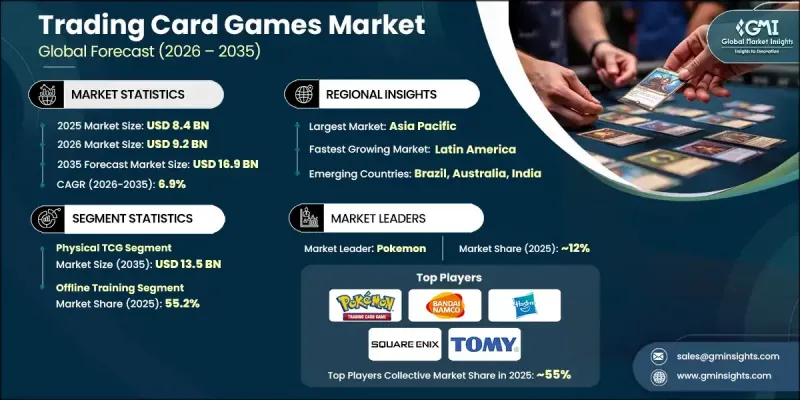
2025 年全球集換式卡牌遊戲市場價值 84 億美元,預計到 2035 年將以 6.9% 的複合年成長率成長至 169 億美元。
隨著區塊鏈技術和NFT的出現,集換式卡牌遊戲(TCG)產業格局正在經歷一場重大變革,它們為數位資產的認證和所有權歷史的確認提供了新的方式。許多歷史悠久的集換式卡牌品牌正在開發可驗證真實性的數位收藏卡,從而將傳統收藏體驗與現代數位互動完美融合。這種轉變為發行商帶來了新的機遇,也吸引了那些重視數位購買透明度和安全性的新興收藏家群體。數位資產作用的擴展正在創造新的參與形式,使收藏家能夠跨平台與他們喜愛的作品互動。 TCG公司與娛樂品牌之間的合作項目正在推動這一趨勢,擴大消費者涵蓋範圍,並增強粉絲忠誠度。這些合作關係有助於新作品迅速獲得認可,並使發行商更容易進入競爭激烈的市場。
| 市場範圍 | |
|---|---|
| 起始年份 | 2025 |
| 預測年份 | 2026-2035 |
| 起始值 | 84億美元 |
| 預測值 | 169億美元 |
| 複合年成長率 | 6.9% |
實體集換式卡牌遊戲市場在2025年創造了70億美元的收入,預計到2035年將達到135億美元。實體卡牌仍然深受收藏家的青睞,他們追求的是具有展示價值和長期投資潛力的實物。擁有和交換實體收藏品的樂趣推動了穩定的需求,並促進了其價值的增值。
2025年,線下零售市場規模將達到46億美元,約佔市佔率的55.2%。分銷管道包括愛好商店、大型商品零售商、漫畫店、便利商店和專業遊戲場所。專業遊戲商店發揮核心作用,因為它們有助於促進社群互動,組織線下遊戲活動,為玩家提供與專門店員交流的機會,並提供數位平台無法完全複製的產品和體驗。
2025年美國集換式卡牌遊戲市場規模達22億美元,預計2026年至2035年將以8%的複合年成長率成長。美國佔北美集換式卡牌遊戲收入的近81%,加拿大貢獻了剩餘的19%。美國收藏家依然對經典系列情有獨鍾,即使市場不斷湧現新的競爭者,這些經典系列也持續保持領先地位。
目錄
第1章:方法論與範圍
第2章:執行概要
第3章:行業洞察
- 產業生態系分析
- 出版商格局
- 利潤率
- 每個階段的價值增加
- 影響價值鏈的因素
- 產業影響因素
- 成長促進因素
- 產業陷阱與挑戰
- 機會
- 成長潛力分析
- 未來市場趨勢
- 監理框架
- 按地區
- 波特五力分析
- PESTEL 分析
第4章:競爭格局
- 介紹
- 公司市佔率分析
- 按地區
- 公司矩陣分析
- 主要市場參與者的競爭分析
- 競爭定位矩陣
- 產品組合基準測試
- 關鍵進展
- 併購
- 合作夥伴關係與合作
- 新產品發布
- 擴張計劃
第5章:市場估算與預測:依產品類型分類 2022-2035 年
- 實體集換式卡牌遊戲
- 補充包
- 補充包
- 起始牌
- 收藏品/高階產品
- 罐裝和泡殼包裝
- 數位集換式卡牌遊戲
第6章:市場估算與預測:依特許經營類型分類,2022-2035年
- 寶可夢
- 萬智牌
- 遊戲王
- 動漫/漫畫集換式卡牌遊戲
- 星際大戰
- 其他(先鋒等)
第7章:市場估價與預測:依發行類型分類,2022-2035年
- 標準套裝
- 特別版/限量版
- 促銷產品
- 重印/再版
第8章:市場估算與預測:依價格區間分類,2022-2035年
- 經濟型(3-15美元)
- 中檔(15 美元 - 50 美元)
- 高級版(50 美元 - 150 美元)
- 超高階(150 美元以上)
第9章:市場估算與預測:依消費族群分類,2022-2035年
- 玩家/遊戲玩家
- 投資者/收藏家
- 兒童/家庭
第10章:市場估價與預測:依配銷通路分類,2022-2035年
- 線上
- 電子商務網站
- 公司自有網站
- 離線
- 大眾零售商店
- 專賣店
- 其他
第11章:市場估計與預測:按地區分類,2022-2035年
- 北美洲
- 美國
- 加拿大
- 歐洲
- 德國
- 英國
- 法國
- 義大利
- 西班牙
- 亞太地區
- 中國
- 印度
- 日本
- 韓國
- 澳洲
- 拉丁美洲
- 巴西
- 墨西哥
- 阿根廷
- MEA
- 阿拉伯聯合大公國
- 沙烏地阿拉伯
- 南非
第12章:公司簡介
- Bandai Namco
- Bushiroad Inc.
- Fanatics/Topps
- Fantasy Flight
- Hasbro
- Kayou
- Konami
- Legend Story Studios
- Nintendo Co., Ltd.
- Panini SpA
- Pokemon
- Ravensburger AG
- Square Enix
- Tomy Co. Ltd.
- Upper Deck Company
The Global Trading Card Games Market was valued at USD 8.4 billion in 2025 and is estimated to grow at a CAGR of 6.9% to reach USD 16.9 billion by 2035.
The landscape of the TCG industry is undergoing a major transformation as blockchain technology and NFTs introduce new ways to authenticate digital assets and confirm ownership history. Many long-standing trading card brands are developing digital collectible cards that maintain verifiable authenticity, helping bridge the experience of traditional collecting with modern digital engagement. This shift is bringing new opportunities for publishers and appealing to emerging collector communities who value transparency and security in their digital purchases. The expanded role of digital assets is creating new forms of participation, enabling collectors to interact with their favorite franchises across multiple platforms. Collaborative projects between TCG companies and entertainment brands are expanding this momentum, broadening consumer reach, and strengthening fan loyalty. These partnerships help new titles gain immediate recognition and make it easier for publishers to enter a highly competitive market.
| Market Scope | |
|---|---|
| Start Year | 2025 |
| Forecast Year | 2026-2035 |
| Start Value | $8.4 Billion |
| Forecast Value | $16.9 Billion |
| CAGR | 6.9% |
The physical trading card games segment generated USD 7 billion in 2025 and is forecasted to reach USD 13.5 billion by 2035. Physical cards remain deeply valued by collectors who seek tangible items with display appeal and long-term investment potential. The enjoyment of owning and exchanging physical collectibles drives steady demand and contributes to their ability to appreciate in value.
The offline retail segment generated USD 4.6 billion in 2025, representing about 55.2% of the market. Distribution involves hobby shops, mass merchandise retailers, comic stores, convenience outlets, and dedicated gaming venues. Specialty gaming stores play a central role because they support community interaction, facilitate in-person play events, connect players with knowledgeable staff, and provide immediate access to products and an experience that digital platforms cannot fully replicate.
U.S. Trading Card Games Market generated USD 2.2 billion in 2025 and is expected to grow at a CAGR of 8% from 2026 to 2035. The US accounts for nearly 81% of North American TCG revenue, with Canada contributing the remaining 19%. Collectors in the United States remain strongly attached to established franchises, and these titles continue to secure leading positions even as the market welcomes new competitors.
Key companies active in the Trading Card Games Market include Bandai Namco, Bushiroad Inc., Fanatics/Topps, Fantasy Flight, Hasbro, Kayou, Konami, Legend Story Studios, Nintendo Co., Ltd., Panini S.p.A., Pokemon, Ravensburger AG, Square Enix, Tomy Co. Ltd., and Upper Deck Company. Companies in the trading card games market are strengthening their competitive position by expanding cross-media partnerships, enhancing product storytelling, and investing in collectible innovations across physical and digital formats. Many publishers are adopting blockchain-based verification tools to increase consumer trust while developing premium card lines to attract long-term collectors. Firms are also focusing on organized play programs to build community engagement and encourage repeat purchases. Limited-edition releases, diversified licensing agreements, and franchise tie-ins remain central to sustaining brand visibility. To support global demand, companies continue to increase production capacity, streamline distribution networks, and enhance regional market penetration.
Table of Contents
Chapter 1 Methodology & Scope
- 1.1 Market scope and definition
- 1.2 Research design
- 1.2.1 Research approach
- 1.2.2 Data collection methods
- 1.3 Data mining sources
- 1.3.1 Global
- 1.3.2 Regional/Country
- 1.4 Base estimates and calculations
- 1.4.1 Base year calculation
- 1.4.2 Key trends for market estimation
- 1.5 Primary research and validation
- 1.5.1 Primary sources
- 1.6 Forecast model
- 1.7 Research assumptions and limitations
Chapter 2 Executive Summary
- 2.1 Industry 360° synopsis
- 2.2 Key market trends
- 2.2.1 Product type trends
- 2.2.2 Franchise trends
- 2.2.3 Release type trends
- 2.2.4 Price range trends
- 2.2.5 Consumer group trends
- 2.2.6 Distribution channel trends
- 2.3 CXO perspective: Strategic imperatives
- 2.3.1 Key decision points for industry executives
- 2.3.2 Critical success factors for market players
- 2.4 Future outlook and strategic recommendations
- 2.5 Strategic recommendations
- 2.5.1 Supply chain diversification strategy
- 2.5.2 Product portfolio enhancement
- 2.5.3 Partnership and alliance opportunities
- 2.5.4 Cost management and pricing strategy
- 2.6 Decision framework
- 2.6.1 Investment priority matrix
- 2.6.2 ROI analysis
Chapter 3 Industry Insights
- 3.1 Industry ecosystem analysis
- 3.1.1 Publisher Landscape
- 3.1.2 Profit Margin
- 3.1.3 Value addition at each stage
- 3.1.4 Factor affecting the value chain
- 3.2 Industry impact forces
- 3.2.1 Growth drivers
- 3.2.2 Industry pitfalls & challenges
- 3.2.3 Opportunities
- 3.3 Growth potential analysis
- 3.4 Future market trends
- 3.5 Regulatory framework
- 3.5.1 By region
- 3.6 Porter's five forces analysis
- 3.7 PESTEL analysis
Chapter 4 Competitive Landscape, 2025
- 4.1 Introduction
- 4.2 Company market share analysis
- 4.2.1 By Region
- 4.3 Company matrix analysis
- 4.4 Competitive analysis of major market players
- 4.5 Competitive positioning matrix
- 4.6 Product portfolio benchmarking
- 4.7 Key developments
- 4.7.1 Mergers & acquisitions
- 4.7.2 Partnerships & collaborations
- 4.7.3 New Product Launches
- 4.7.4 Expansion Plans
Chapter 5 Market Estimates & Forecast, By Product Type 2022 - 2035 (USD Billion) (Million Cards)
- 5.1 Key trends
- 5.2 Physical TCG
- 5.2.1 Booster Packs
- 5.2.2 Booster Boxes
- 5.2.3 Starter Decks
- 5.2.4 Collector/Premium Products
- 5.2.5 Tins & Blister Packs
- 5.3 Digital TCG
Chapter 6 Market Estimates & Forecast, By Franchise, 2022 - 2035 (USD Billion) (Million Cards)
- 6.1 Key trends
- 6.2 Pokemon
- 6.3 Magic: The Gathering
- 6.4 Yu-Gi-Oh!
- 6.5 Anime/Manga TCGs
- 6.6 Star Wars
- 6.7 Others (Vanguard, etc.)
Chapter 7 Market Estimates & Forecast, By Release Type, 2022 - 2035 (USD Billion) (Million Cards)
- 7.1 Key trends
- 7.2 Standard Sets
- 7.3 Special/Limited Editions
- 7.4 Promotional Products
- 7.5 Reprints/Reissues
Chapter 8 Market Estimates & Forecast, By Price Range, 2022 - 2035 (USD Billion) (Million Cards)
- 8.1 Key trends
- 8.2 Economy (USD 3- USD 15)
- 8.3 Mid-Tier (USD 15 - USD 50)
- 8.4 Premium (USD 50 - USD 150)
- 8.5 Ultra-Premium (Above USD 150)
Chapter 9 Market Estimates & Forecast, By Consumer Group, 2022 - 2035 (USD Billion) (Million Cards)
- 9.1 Key trends
- 9.2 Players/Gamers
- 9.3 Investors/Collector
- 9.4 Children/Families
Chapter 10 Market Estimates & Forecast, By Distribution Channel, 2022 - 2035, (USD Billion) (Million Cards)
- 10.1 Key trends
- 10.2 Online
- 10.2.1 E-commerce website
- 10.2.2 Company owned website
- 10.3 Offline
- 10.3.1 Mass Retail Stores
- 10.3.2 Specialty Stores
- 10.3.3 Others
Chapter 11 Market Estimates & Forecast, By Region, 2022 - 2035, (USD Billion) (Million Cards)
- 11.1 Key trends
- 11.2 North America
- 11.2.1 U.S.
- 11.2.2 Canada
- 11.3 Europe
- 11.3.1 Germany
- 11.3.2 U.K.
- 11.3.3 France
- 11.3.4 Italy
- 11.3.5 Spain
- 11.4 Asia Pacific
- 11.4.1 China
- 11.4.2 India
- 11.4.3 Japan
- 11.4.4 South Korea
- 11.4.5 Australia
- 11.5 Latin America
- 11.5.1 Brazil
- 11.5.2 Mexico
- 11.5.3 Argentina
- 11.6 MEA
- 11.6.1 UAE
- 11.6.2 Saudi Arabia
- 11.6.3 South Africa
Chapter 12 Company Profiles (Business Overview, Financial Data, Product Landscape, Strategic Outlook, SWOT Analysis)
- 12.1 Bandai Namco
- 12.2 Bushiroad Inc.
- 12.3 Fanatics/Topps
- 12.4 Fantasy Flight
- 12.5 Hasbro
- 12.6 Kayou
- 12.7 Konami
- 12.8 Legend Story Studios
- 12.9 Nintendo Co., Ltd.
- 12.10 Panini S.p.A.
- 12.11 Pokemon
- 12.12 Ravensburger AG
- 12.13 Square Enix
- 12.14 Tomy Co. Ltd.
- 12.15 Upper Deck Company
 集換式卡牌遊戲市場 - 全球產業規模、佔有率、趨勢、機會、預測:按年齡層、卡牌類型、分銷管道、地區和競爭格局分類,2021-2031年
 按產品類型、格式、價格範圍、年齡層、分銷管道和應用分類的集換式卡牌市場-2026年至2032年全球預測
 行動集換式卡牌遊戲(TCG):全球市場佔有率和排名、總收入和需求預測(2025-2031 年)收藏卡:全球市場佔有率和排名、總收入和需求預測(2025-2031年)熱門集換式卡牌:全球市場佔有率和排名、總銷售額和需求預測(2025-2031年)集換式卡牌:全球市場佔有率和排名、總收入和需求預測(2025-2031年)
 全球集換式卡牌遊戲市場
 全球集換式卡牌遊戲市場行動集換式卡牌遊戲市場按遊戲機制、年齡層、模組、平台類型、受眾人口統計和收益模式分類 - 2025 年至 2030 年全球預測
 行動交換卡遊戲(TCG)的全球市場:2030年為止的預測