


 |
市場調查報告書
商品編碼
1876816
清潔標籤配料市場機會、成長促進因素、產業趨勢分析及預測(2025-2034年)Clean Label Ingredients Market Opportunity, Growth Drivers, Industry Trend Analysis, and Forecast 2025 - 2034 |
||||||
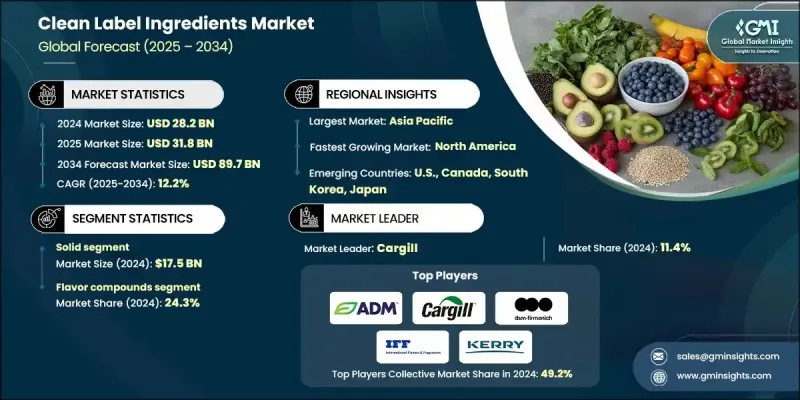
2024 年全球清潔標籤成分市場價值為 282 億美元,預計到 2034 年將以 12.2% 的複合年成長率成長至 897 億美元。
市場快速成長歸功於消費者對透明度、天然來源和加工最少的食品的強勁需求。清潔標籤成分指的是不含人工添加物、色素、防腐劑和合成化學物質的天然且簡單的成分。消費者對清潔且可追溯的食品來源的偏好已成為重要的購買因素,尤其是在注重安全和健康的健康意識強的消費者中。全球健康飲食習慣的趨勢,以及政府對食品添加劑和標籤日益嚴格的監管,正在推動從合成成分向天然來源替代品的轉變。製造商擴大使用有機、植物性和非基因改造成分來重新配製產品,以滿足不斷變化的消費者期望和永續發展目標。此外,天然萃取和發酵技術的進步使得成分更加清潔、穩定,同時又不影響風味、功能或保存期限。這些趨勢、健康意識的提高、監管的演變以及天然加工技術的創新正在重塑全球清潔標籤成分的格局。
| 市場範圍 | |
|---|---|
| 起始年份 | 2024 |
| 預測年份 | 2025-2034 |
| 起始值 | 282億美元 |
| 預測值 | 897億美元 |
| 複合年成長率 | 12.2% |
2024年,固態配料市場規模預計將達175億美元。粉狀蛋白質、顆粒狀防腐劑、結晶甜味劑和脫水香精等固態配料因其穩定性好、易於操作且能適應各種食品生產過程而佔據主導地位。這些固態配料能夠延長保存期限,實現精確的劑量控制,並可無縫整合到大規模食品生產系統中。在烘焙、糖果和加工食品等關鍵應用領域,固態配料的需求仍然旺盛,因為它們在保持產品一致性和口感方面發揮著至關重要的作用。
2024年,香精化合物市佔率達24.3%。源自植物、水果、蔬菜和草藥的天然香料正日益成為食品和飲料配方中不可或缺的成分,這些配方旨在實現複雜而真實的口味,而無需人工添加劑。隨著消費者越來越將天然風味與品質、安全性和感官享受聯繫起來,精油、發酵衍生化合物和植物萃取物的使用正在迅速成長。
受消費者對加工最少、天然且透明的成分偏好驅動,北美清潔標籤成分市場預計在2025年至2034年間將以12.4%的複合年成長率成長。該地區市場成長得益於眾多關注健康、保健和永續發展的領導品牌擴大採用清潔標籤配方。天然防腐、萃取和配方方面的技術創新在保持產品純度的同時,提升了產品性能。此外,企業正優先考慮永續採購,投資再生原料,並擴大有機成分組合,以滿足消費者期望和監管標準。
全球清潔標籤配料市場的主要參與者包括A&B Ingredients、嘉吉、帝斯曼-菲美意、利馬格蘭配料、凱瑞集團、ADM、英聯格、科比昂、國際香料香精公司(IFF)、布里森集團、泰萊和諾維信。這些主要市場參與者正採取一系列策略來鞏固其在清潔標籤配料市場的地位,包括與食品製造商建立戰略合作夥伴關係、擴大區域生產設施以及收購利基天然配料公司以拓展產品組合。持續的研發投入使企業能夠推出創新且永續的清潔標籤配方,以滿足不斷變化的消費者趨勢。
目錄
第1章:方法論與範圍
第2章:執行概要
第3章:行業洞察
- 產業生態系分析
- 供應商格局
- 利潤率
- 每個階段的價值增加
- 影響價值鏈的因素
- 中斷
- 產業影響因素
- 成長促進因素
- 消費者對透明度和天然成分的需求日益成長
- 監理機關推動標籤成分更清晰、減少合成添加劑
- 健康與保健趨勢推動高階產品需求
- 產業陷阱與挑戰
- 天然成分比合成成分成本更高
- 維護產品功能的技術挑戰
- 市場機遇
- 植物性和替代蛋白的新興應用
- 採用先進處理技術
- 成長促進因素
- 成長潛力分析
- 監管環境
- 北美洲
- 歐洲
- 亞太地區
- 拉丁美洲
- 中東和非洲
- 波特的分析
- PESTEL 分析
- 技術與創新格局
- 當前技術趨勢
- 新興技術
- 價格趨勢
- 按地區
- 依產品
- 未來市場趨勢
- 專利格局
- 貿易統計(HS編碼)(註:僅提供重點國家的貿易統計資料)
- 主要進口國
- 主要出口國
- 永續性和環境方面
- 永續實踐
- 減少廢棄物策略
- 生產中的能源效率
- 環保舉措
- 碳足跡考量
第4章:競爭格局
- 介紹
- 公司市佔率分析
- 按地區
- 北美洲
- 歐洲
- 亞太地區
- 拉丁美洲
- MEA
- 按地區
- 公司矩陣分析
- 主要市場參與者的競爭分析
- 競爭定位矩陣
- 關鍵進展
- 併購
- 合作夥伴關係與合作
- 新產品發布
- 擴張計劃
第5章:市場估算與預測:依形式分類,2021-2034年
- 主要趨勢
- 堅硬的
- 粉末和顆粒狀
- 晶體和片狀
- 片劑和壓縮劑型
- 液體
- 溶液和糖漿
- 乳液和懸浮液
- 濃縮液體
- 半固體
- 膏狀物和濃縮物
- 凝膠和粘稠溶液
- 蠟和固體分散體
第6章:市場估算與預測:依類別分類,2021-2034年
- 主要趨勢
- 防腐劑和抗菌劑
- 有機酸(檸檬酸、醋酸、乳酸)
- 精油化合物
- 植物萃取物抗氧化劑
- 鹽和礦物基防腐劑
- 著色劑和顏料
- 花青素和甜菜鹼
- 類胡蘿蔔素和葉黃素
- 葉綠素衍生物
- 礦物和粘土基顏料
- 風味化合物
- 精油和油樹脂
- 天然香料萃取物
- 植物香料
- 味覺調節劑和增強劑
- 甜味劑
- 高強度甜味劑(甜菊糖、羅漢果糖)
- 糖醇(赤藻醣醇、木糖醇)
- 稀有糖(阿洛酮糖、塔格糖)
- 天然糖替代品
- 蛋白質和胺基酸
- 植物性蛋白質濃縮物
- 蛋白質分離物和水解物
- 必需胺基酸混合物
- 生物活性胜肽
- 增稠劑
- 增稠劑
- 凝膠劑
- 穩定系統
- 抗結塊劑
- 其他
第7章:市場估算與預測:依最終用途產業分類,2021-2034年
- 主要趨勢
- 飲料業
- 不含酒精的飲料
- 酒精飲料
- 功能飲料和運動飲料
- 乳製品飲料
- 食品製造
- 烘焙食品和穀物產品
- 糖果和甜點
- 加工食品及即食食品
- 休閒食品及簡便食品
- 乳製品及替代品產業
- 傳統乳製品
- 植物性乳製品替代品
- 發酵乳製品
- 冷凍乳製品甜點
- 肉品及蛋白質產業
- 加工肉製品
- 植物肉替代品
- 海鮮及海鮮
- 蛋白質補充劑和蛋白質棒
- 特殊營養
- 嬰幼兒營養
- 臨床與醫學營養
- 運動與表現營養
- 老年人營養
- 餐飲服務及宴會
- 餐廳和快餐連鎖店
- 機構餐飲
- 食品原料供應
- 其他
第8章:市場估算與預測:依地區分類,2021-2034年
- 主要趨勢
- 北美洲
- 美國
- 加拿大
- 歐洲
- 德國
- 英國
- 法國
- 西班牙
- 義大利
- 歐洲其他地區
- 亞太地區
- 中國
- 印度
- 日本
- 澳洲
- 韓國
- 亞太其他地區
- 拉丁美洲
- 巴西
- 墨西哥
- 阿根廷
- 拉丁美洲其他地區
- 中東和非洲
- 沙烏地阿拉伯
- 南非
- 阿拉伯聯合大公國
- 中東和非洲其他地區
第9章:公司簡介
- A&B Ingredients
- ADM
- Brisan Group
- Cargill
- Corbion
- DSM-Firmenich
- Ingredion
- International Flavors & Fragrances Inc. (IFF)
- Kerry Group
- Limagrain Ingredients
- Novozymes
- Tate & Lyle
The Global Clean Label Ingredients Market was valued at USD 28.2 billion in 2024 and is estimated to grow at a CAGR of 12.2% to reach USD 89.7 billion by 2034.
The market's rapid growth is attributed to the strong consumer demand for transparency, natural sourcing, and minimally processed food products. Clean label ingredients refer to natural and simple ingredients that are free from artificial additives, colors, preservatives, and synthetic chemicals. The preference for clean and traceable food sources has become a significant purchasing factor, especially among health-conscious consumers who prioritize safety and wellness. Global trends toward healthier eating habits, coupled with stricter government regulations regarding food additives and labeling, are encouraging the transition from synthetic ingredients to naturally derived alternatives. Manufacturers are increasingly reformulating products with organic, plant-based, and non-GMO ingredients to align with evolving consumer expectations and sustainability goals. In addition, technological advances in natural extraction and fermentation are enabling cleaner, more stable ingredient profiles without compromising flavor, functionality, or shelf life. These combined trends, health awareness, regulatory evolution, and innovation in natural processing are reshaping the global clean label ingredient landscape.
| Market Scope | |
|---|---|
| Start Year | 2024 |
| Forecast Year | 2025-2034 |
| Start Value | $28.2 Billion |
| Forecast Value | $89.7 Billion |
| CAGR | 12.2% |
The solid form segment generated USD 17.5 billion in 2024. Solid ingredients such as powdered proteins, granulated preservatives, crystalline sweeteners, and dehydrated flavor compounds dominate due to their stability, easy handling, and adaptability across food manufacturing processes. These forms provide manufacturers with extended shelf life, precise dosing control, and seamless integration into large-scale food production systems. Demand remains high across key applications, including bakery, confectionery, and processed food categories, where solid ingredients play a vital role in maintaining consistency and taste.
The flavor compounds segment captured 24.3% share in 2024. Natural flavoring agents sourced from botanicals, fruits, vegetables, and herbs are becoming indispensable for food and beverage formulations that aim to achieve complex and authentic taste profiles without artificial additives. The use of essential oils, fermentation-derived compounds, and plant-based extracts is expanding rapidly as consumers increasingly associate natural flavor with quality, safety, and sensory satisfaction.
North America Clean Label Ingredients Market is expected to record a CAGR of 12.4% between 2025 and 2034, driven by consumer preference for minimally processed, natural, and transparent ingredients. The region's market growth is supported by the rising adoption of clean label formulations across leading brands that focus on health, wellness, and sustainability. Technological innovations in natural preservation, extraction, and formulation are improving product performance while maintaining purity. Moreover, companies are prioritizing sustainable sourcing, investing in renewable raw materials, and expanding organic ingredient portfolios to meet consumer expectations and regulatory standards.
Leading companies operating in the Global Clean Label Ingredients Market include A&B Ingredients, Cargill, DSM-Firmenich, Limagrain Ingredients, Kerry Group, ADM, Ingredion, Corbion, International Flavors & Fragrances Inc. (IFF), Brisan Group, Tate & Lyle, and Novozymes. Key market players are adopting a range of strategies to strengthen their foothold in the Clean Label Ingredients Market. These include strategic partnerships with food manufacturers, expansion of regional production facilities, and acquisition of niche natural ingredient companies to broaden product portfolios. Continuous investment in research and development allows firms to introduce innovative and sustainable clean-label formulations that cater to evolving consumer trends.
Table of Contents
Chapter 1 Methodology & Scope
- 1.1 Market scope and definition
- 1.2 Research design
- 1.2.1 Research approach
- 1.2.2 Data collection methods
- 1.3 Data mining sources
- 1.3.1 Global
- 1.3.2 Regional/Country
- 1.4 Base estimates and calculations
- 1.4.1 Base year calculation
- 1.4.2 Key trends for market estimation
- 1.5 Primary research and validation
- 1.5.1 Primary sources
- 1.6 Forecast model
- 1.7 Research assumptions and limitations
Chapter 2 Executive Summary
- 2.1 Industry 360° synopsis
- 2.2 Key market trends
- 2.2.1 Form trends
- 2.2.2 Category trends
- 2.2.3 End Use industry trends
- 2.2.4 Regional trends
- 2.3 TAM Analysis, 2025-2034
- 2.4 CXO perspectives: strategic imperatives
- 2.4.1 Executive decision points
- 2.4.2 Critical success factors
- 2.5 Future outlook and strategic recommendations
Chapter 3 Industry Insights
- 3.1 Industry ecosystem analysis
- 3.1.1 Supplier landscape
- 3.1.2 Profit margin
- 3.1.3 Value addition at each stage
- 3.1.4 Factor affecting the value chain
- 3.1.5 Disruptions
- 3.2 Industry impact forces
- 3.2.1 Growth drivers
- 3.2.1.1 Rising consumer demand for transparency & natural ingredients
- 3.2.1.2 Regulatory push for cleaner labels & reduced synthetic additives
- 3.2.1.3 Health & wellness trends driving premium product demand
- 3.2.2 Industry pitfalls and challenges
- 3.2.2.1 Higher costs of natural vs synthetic ingredients
- 3.2.2.2 Technical challenges in maintaining product functionality
- 3.2.3 Market opportunities
- 3.2.3.1 Emerging applications in plant-based & alternative proteins
- 3.2.3.2 Advanced processing technology adoption
- 3.2.1 Growth drivers
- 3.3 Growth potential analysis
- 3.4 Regulatory landscape
- 3.4.1 North America
- 3.4.2 Europe
- 3.4.3 Asia Pacific
- 3.4.4 Latin America
- 3.4.5 Middle East & Africa
- 3.5 Porter's analysis
- 3.6 PESTEL analysis
- 3.7 Technology and Innovation landscape
- 3.7.1 Current technological trends
- 3.7.2 Emerging technologies
- 3.8 Price trends
- 3.8.1 By region
- 3.8.2 By product
- 3.9 Future market trends
- 3.10 Patent landscape
- 3.11 Trade statistics (HS code)( Note: the trade statistics will be provided for key countries only)
- 3.11.1 Major importing countries
- 3.11.2 Major exporting countries
- 3.12 Sustainability and environmental aspects
- 3.12.1 Sustainable practices
- 3.12.2 Waste reduction strategies
- 3.12.3 Energy efficiency in production
- 3.12.4 Eco-friendly initiatives
- 3.13 Carbon footprint consideration
Chapter 4 Competitive Landscape, 2024
- 4.1 Introduction
- 4.2 Company market share analysis
- 4.2.1 By region
- 4.2.1.1 North America
- 4.2.1.2 Europe
- 4.2.1.3 Asia Pacific
- 4.2.1.4 LATAM
- 4.2.1.5 MEA
- 4.2.1 By region
- 4.3 Company matrix analysis
- 4.4 Competitive analysis of major market players
- 4.5 Competitive positioning matrix
- 4.6 Key developments
- 4.6.1 Mergers & acquisitions
- 4.6.2 Partnerships & collaborations
- 4.6.3 New product launches
- 4.6.4 Expansion plans
Chapter 5 Market Estimates and Forecast, By Form, 2021-2034 (USD Billion) (Kilo Tons)
- 5.1 Key trends
- 5.2 Solid
- 5.2.1 Powder & granular
- 5.2.2 Crystalline & flake
- 5.2.3 Tablet & compressed forms
- 5.3 Liquid
- 5.3.1 Solutions & syrups
- 5.3.2 Emulsions & suspensions
- 5.3.3 Concentrated liquids
- 5.4 Semi-solid
- 5.4.1 Pastes & concentrates
- 5.4.2 Gels & viscous solutions
- 5.4.3 Wax & solid dispersions
Chapter 6 Market Estimates and Forecast, By Category, 2021-2034 (USD Billion) (Kilo Tons)
- 6.1 Key trends
- 6.2 Preservatives & antimicrobials
- 6.2.1 Organic acids (citric, acetic, lactic)
- 6.2.2 Essential oil compounds
- 6.2.3 Plant extract antioxidants
- 6.2.4 Salt & mineral-based preservatives
- 6.3 Colorants & pigments
- 6.3.1 Anthocyanins & betalains
- 6.3.2 Carotenoids & xanthophylls
- 6.3.3 Chlorophyll derivatives
- 6.3.4 Mineral & clay-based colors
- 6.4 Flavor compounds
- 6.4.1 Essential oils & oleoresins
- 6.4.2 Natural flavor extracts
- 6.4.3 Botanical aromatics
- 6.4.4 Taste modulators & enhancers
- 6.5 Sweetening agents
- 6.5.1 High-intensity sweeteners (stevia, monk fruit)
- 6.5.2 Sugar alcohols (erythritol, xylitol)
- 6.5.3 Rare sugars (allulose, tagatose)
- 6.5.4 Natural sugar alternatives
- 6.6 Proteins & amino acids
- 6.6.1 Plant protein concentrates
- 6.6.2 Protein isolates & hydrolysates
- 6.6.3 Essential amino acid blends
- 6.6.4 Bioactive peptides
- 6.7 Texturizing agents
- 6.7.1 Thickening compounds
- 6.7.2 Gelling agents
- 6.7.3 Stabilizing systems
- 6.7.4 Anti-caking agents
- 6.8 Others
Chapter 7 Market Estimates and Forecast, By End Use Industry, 2021-2034 (USD Billion) (Kilo Tons)
- 7.1 Key trends
- 7.2 Beverages industry
- 7.2.1 Non-alcoholic beverages
- 7.2.2 Alcoholic beverages
- 7.2.3 Functional & sports drinks
- 7.2.4 Dairy-based beverages
- 7.3 Food manufacturing
- 7.3.1 Bakery & cereal products
- 7.3.2 Confectionery & sweets
- 7.3.3 Processed foods & ready meals
- 7.3.4 Snack foods & convenience products
- 7.4 Dairy & alternatives industry
- 7.4.1 Traditional dairy products
- 7.4.2 Plant-based dairy alternatives
- 7.4.3 Fermented dairy products
- 7.4.4 Frozen dairy desserts
- 7.5 Meat & protein industry
- 7.5.1 Processed meat products
- 7.5.2 Plant-based meat alternatives
- 7.5.3 Seafood & marine products
- 7.5.4 Protein supplements & bars
- 7.6 Specialized nutrition
- 7.6.1 Infant & baby nutrition
- 7.6.2 Clinical & medical nutrition
- 7.6.3 Sports & performance nutrition
- 7.6.4 Senior & geriatric nutrition
- 7.7 Food service & catering
- 7.7.1 Restaurant & qsr chains
- 7.7.2 Institutional catering
- 7.7.3 Food ingredients Supply
- 7.8 Others
Chapter 8 Market Estimates and Forecast, By Region, 2021-2034 (USD Billion) (Kilo Tons)
- 8.1 Key trends
- 8.2 North America
- 8.2.1 U.S.
- 8.2.2 Canada
- 8.3 Europe
- 8.3.1 Germany
- 8.3.2 UK
- 8.3.3 France
- 8.3.4 Spain
- 8.3.5 Italy
- 8.3.6 Rest of Europe
- 8.4 Asia Pacific
- 8.4.1 China
- 8.4.2 India
- 8.4.3 Japan
- 8.4.4 Australia
- 8.4.5 South Korea
- 8.4.6 Rest of Asia Pacific
- 8.5 Latin America
- 8.5.1 Brazil
- 8.5.2 Mexico
- 8.5.3 Argentina
- 8.5.4 Rest of Latin America
- 8.6 Middle East and Africa
- 8.6.1 Saudi Arabia
- 8.6.2 South Africa
- 8.6.3 UAE
- 8.6.4 Rest of Middle East and Africa
Chapter 9 Company Profiles
- 9.1 A&B Ingredients
- 9.2 ADM
- 9.3 Brisan Group
- 9.4 Cargill
- 9.5 Corbion
- 9.6 DSM-Firmenich
- 9.7 Ingredion
- 9.8 International Flavors & Fragrances Inc. (IFF)
- 9.9 Kerry Group
- 9.10 Limagrain Ingredients
- 9.11 Novozymes
- 9.12 Tate & Lyle
 潔淨標示防腐劑市場機會、成長要素、產業趨勢分析及2026-2035年預測
 潔淨標示即食食品市場預測至2034年-按產品類型、菜系類型、營養標示、包裝、分銷管道、最終用戶和地區分類的全球分析
 海藻衍生鹿角菜膠替代品市場報告:趨勢、預測和競爭分析(至2035年)
 全球潔淨標示香精市場規模、佔有率、趨勢和成長分析報告(2026-2034年)全球潔淨標示、天然和無添加快速消費品市場預測至2032年:按產品、成分類型、無添加聲明、配銷通路和地區分類
 潔淨標示原料市場-全球產業規模、佔有率、趨勢、機會及預測(按類型、應用、形式、地區及競爭格局分類,2021-2031年)潔淨標示香精市場-全球產業規模、佔有率、趨勢、機會、預測:按類型、形式、分銷管道、地區和競爭格局分類,2021-2031年全球潔淨標示食品市場:預測(至2032年)-按產品、成分類型、形態、包裝類型、分銷管道和地區進行分析潔淨標示和低加工食品市場預測至2032年:按產品類型、成分、分銷管道、形式、來源、認證和地區分類的全球分析潔淨標示和天然食品市場預測至2032年:按產品、成分、來源、分銷管道、應用和地區分類的全球分析