


 |
市場調查報告書
商品編碼
1871217
工業發電設備市場機會、成長促進因素、產業趨勢分析及預測(2025-2034年)Industrial Power Generation Equipment Market Opportunity, Growth Drivers, Industry Trend Analysis, and Forecast 2025 - 2034 |
||||||
2024年全球工業發電設備市場價值為759億美元,預計2034年將以5.3%的複合年成長率成長至1,258億美元。
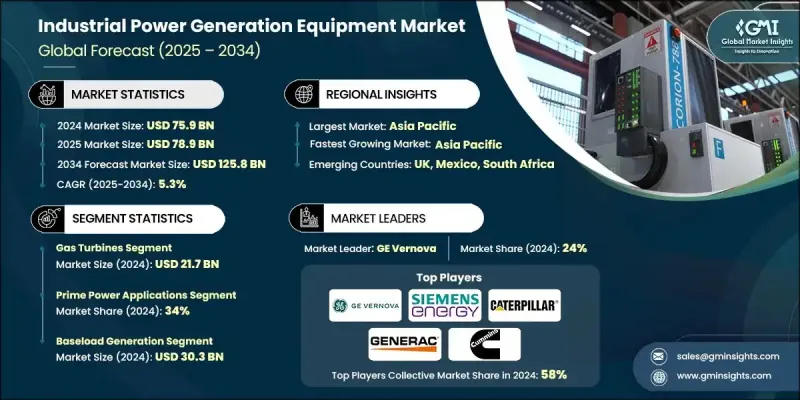
市場成長的驅動力來自各工業領域對高效、可靠且環保的能源解決方案日益成長的需求。儘管柴油和燃氣發電機等傳統系統仍然不可或缺,但再生能源和數位技術的融合已成為明顯的趨勢。隨著各行業不斷發展以實現永續發展目標,具備增強型能源監測、排放控制和再生能源相容性的發電系統正得到更廣泛的應用。儲能技術也變得至關重要,它能夠穩定電力輸出並確保營運的連續性。尤其是在偏遠和低度開發地區,對獨立電網供電的需求持續成長,進一步推動了市場需求。同時,基礎設施現代化和全球永續發展政策也為混合系統創造了機會。儘管前景光明,市場仍面臨一些挑戰,例如先進系統的前期成本高昂、區域法規不統一以及持續的供應鏈中斷。儘管存在這些障礙,但政府對韌性清潔能源基礎設施的大力支持,以及不斷擴展的工業應用,將繼續為市場在不同地域和產業領域的長期成長奠定基礎。
| 市場範圍 | |
|---|---|
| 起始年份 | 2024 |
| 預測年份 | 2025-2034 |
| 起始值 | 759億美元 |
| 預測值 | 1258億美元 |
| 複合年成長率 | 5.3% |
由於燃氣渦輪機具有高運作效率和在大規模工業環境中的適應性,預計在2024年將佔據相當大的市場佔有率。燃氣渦輪啟動速度快、排放低,且在聯合循環和熱電聯產系統中性能卓越,使其成為工業應用的理想選擇。供應鏈壓力持續影響這一領域,尤其是天然氣供應緊張和主要製造商產能有限。儘管如此,燃氣渦輪機可使用氫氣、天然氣和混合燃料等多種燃料,這使其能夠在不斷變化的燃料供應環境下持續穩定運作。
到了2024年,主電源應用領域佔據34%的市場佔有率,成為領先的應用場景類別。這一主導地位主要源自於工業環境和電網接入不穩定的地區對不間斷電源日益成長的需求。能源基礎設施低度開發或不可靠的地區蘊藏著巨大的成長機遇,尤其對於在偏遠地區營運的產業而言更是如此。石油和天然氣平台、採礦作業以及偏遠地區的製造工廠等設施高度依賴主電源系統來維持運作可靠性,即使在離網條件下也能確保正常運作和安全。
2024年,美國工業發電設備市場佔80.4%的市場佔有率,市場規模達165億美元。美國之所以能保持領先地位,得益於其在基礎設施現代化、擴大國內製造業規模以及提升電網韌性(尤其是在農村和低度開發地區)方面所做的努力。工業活動回流和傳統能源系統升級的投資,也推動了對先進發電解決方案的需求。此外,新建基礎設施專案和資料中心不斷成長的電力需求,也支撐著該地區持續的設備部署。
工業發電設備產業的領導者包括洋馬控股、西門子能源股份公司、科勒公司、三菱重工、斗山燃料電池、燃料電池能源公司、瓦錫蘭公司、通用電氣(GE Vernova)、羅爾斯·羅伊斯動力系統、Caterpillar公司、MTU Onsite Energy、康明斯公司、基洛斯卡控股石油與引擎公司、Gene亞機公司、Geneoom Energy、Boom Energy 控股石油公司。為了鞏固自身地位,工業發電設備領域的企業正在實施有針對性的策略,例如擴大混合動力系統產品線和整合數位化能源管理工具。許多企業正在加大研發投入,以開發更具燃料彈性和減排效果的技術。全球製造商也正在與公用事業供應商和工業客戶建立策略合作夥伴關係,以提升專案執行能力和長期服務水準。地理擴張,尤其是在發展中地區,以及服務和支援網路的升級,正在幫助企業獲得新合約並提高客戶留存率。
目錄
第1章:方法論與範圍
第2章:執行概要
第3章:行業洞察
- 產業生態系分析
- 供應商格局
- 利潤率
- 每個階段的價值增加
- 影響價值鏈的因素
- 產業影響因素
- 成長促進因素
- 全球能源需求不斷成長
- 向更清潔能源轉型
- 設備技術進步
- 產業陷阱與挑戰
- 高資本投資需求
- 供應鏈中斷和材料短缺
- 機會
- 擴大再生能源併網
- 基礎設施現代化計劃
- 成長促進因素
- 成長潛力分析
- 未來市場趨勢
- 技術與創新格局
- 當前技術趨勢
- 新興技術
- 價格趨勢
- 按地區
- 依產品類型
- 監管環境
- 標準和合規要求
- 區域監理框架
- 認證標準
- 波特的分析
- PESTEL 分析
第4章:競爭格局
- 介紹
- 公司市佔率分析
- 按地區
- 公司矩陣分析
- 主要市場參與者的競爭分析
- 競爭定位矩陣
- 關鍵進展
- 併購
- 合作夥伴關係與合作
- 新產品發布
- 擴張計劃
第5章:市場估算與預測:依產品類型分類,2021-2034年
- 主要趨勢
- 瓦斯渦輪機
- 航空衍生燃氣渦輪機
- 重型瓦斯渦輪機
- 氫能型和雙燃料渦輪機
- 往復式引擎
- 柴油引擎
- 天然氣引擎
- 雙燃料和靈活燃料引擎
- 高速引擎與中速引擎
- 排放控制和後處理系統
- 蒸汽渦輪機
- 熱電聯產蒸汽系統
- 廢熱回收蒸汽發生器
- 燃料電池
- 質子交換膜(PEM)燃料電池
- 固態氧化物燃料電池
- 熔融碳酸鹽燃料電池
- 混合燃料電池系統及整合
- 電池儲能系統(BESS)
- 鋰離子電池系統
- 液流電池系統和長時存儲
- 混合式發電機-電池系統
- 電網級儲能整合
- 混合及先進系統
- 發電機-儲能混合配置
- 燃料電池-渦輪混合動力系統
- 再生能源-熱能混合發電廠
- 模組化和容器化解決方案
第6章:市場估計與預測:依產能分類,2021-2034年
- 主要趨勢
- 基荷發電
- 峰值生成
- 熱電聯產(CHP)
- 應急電源
第7章:市場估算與預測:依燃料來源分類,2021-2034年
- 主要趨勢
- 渦輪機(瓦斯、蒸汽、風力)
- 引擎(柴油、汽油)
- 鍋爐
- 熱交換器
- 電力變壓器
第8章:市場估算與預測:按應用領域分類 2021-2034 年
- 主要趨勢
- 備用/緊急電源
- 主電源應用
- 削峰填谷與負載管理
- 電網服務及輔助設備
- 分散式發電和微電網
第9章:市場估算與預測:依最終用途產業分類,2021-2034年
- 主要趨勢
- 資料中心和IT基礎設施
- 醫療機構
- 醫藥與研究
- 製造業
- 石油和天然氣產業
第10章:市場估價與預測:依配銷通路分類,2021-2034年
- 主要趨勢
- 直銷
- 間接銷售
第11章:市場估計與預測:按地區分類,2021-2034年
- 主要趨勢
- 北美洲
- 美國
- 加拿大
- 歐洲
- 德國
- 英國
- 法國
- 義大利
- 西班牙
- 亞太地區
- 中國
- 日本
- 印度
- 澳洲
- 韓國
- 拉丁美洲
- 巴西
- 墨西哥
- 阿根廷
- 中東和非洲
- 南非
- 沙烏地阿拉伯
- 阿拉伯聯合大公國
第12章:公司簡介
- General Electric (GE Vernova)
- Siemens Energy AG
- Caterpillar Inc.
- Cummins Inc.
- Rolls-Royce Power Systems
- Mitsubishi Heavy Industries
- Wartsila Corporation
- Generac Holdings Inc.
- Kohler Co.
- MTU Onsite Energy
- Kirloskar Oil Engines
- Yanmar Holdings
- Bloom Energy Corporation
- FuelCell Energy Inc
- Doosan Fuel Cell
The Global Industrial Power Generation Equipment Market was valued at USD 75.9 Billion in 2024 and is estimated to grow at a CAGR of 5.3% to reach USD 125.8 Billion by 2034.
Market growth is fueled by increasing demand for efficient, reliable, and environmentally conscious energy solutions across industrial sectors. While traditional systems like diesel and gas generators remain relevant, there's a clear shift toward integrating renewable energy and digital technologies. As industries evolve to meet sustainability targets, power generation systems with enhanced energy monitoring, emissions control, and renewable energy compatibility are seeing broader adoption. Energy storage technologies are also becoming essential to stabilize power output and ensure operational continuity. The push for grid-independent power, especially in remote and underserved regions, continues to drive demand. Simultaneously, infrastructure modernization and global sustainability policies are creating opportunities for hybrid systems. Although the outlook is promising, the market faces some challenges, such as high upfront costs for advanced systems, inconsistent regional regulations, and ongoing supply chain disruptions. Despite these hurdles, strong government backing for resilient and clean energy infrastructure, combined with expanding industrial applications, continues to position the market for long-term growth across diverse geographic and sectoral landscapes.
| Market Scope | |
|---|---|
| Start Year | 2024 |
| Forecast Year | 2025-2034 |
| Start Value | $75.9 Billion |
| Forecast Value | $125.8 Billion |
| CAGR | 5.3% |
The gas turbines segment held a significant share in 2024 owing to their high operational efficiency and adaptability in large-scale industrial environments. Their fast startup times, reduced emissions, and superior performance in combined cycle and cogeneration setups make them ideal for industrial applications. Supply chain pressures continue to affect this segment, especially with natural gas availability and limited production capacity among leading manufacturers. Nonetheless, their ability to run on multiple fuel types such as hydrogen, natural gas, and blended alternatives supports consistent deployment across changing fuel supply dynamics.
The prime power applications segment accounted for a 34% share in 2024, making it the leading use-case category. This dominance is driven by growing demand for uninterrupted power supply in industrial environments and areas without stable grid access. Regions with underdeveloped or unreliable energy infrastructure present significant growth opportunities, especially for industries that operate in remote zones. Facilities such as oil and gas platforms, mining operations, and remote manufacturing plants rely heavily on prime power systems to maintain operational reliability, ensuring uptime and safety even in off-grid conditions.
U.S. Industrial Power Generation Equipment Market held an 80.4% share in 2024, contributing USD 16.5 Billion. The country's lead position is supported by efforts to modernize outdated infrastructure, expand domestic manufacturing, and improve grid resilience, particularly in rural and underserved communities. Investments in reshoring industrial activity and upgrading legacy energy systems have boosted the need for advanced power generation solutions. Rising power demand from new infrastructure projects and data centers also underpins sustained equipment deployment across the region.
Leading players in the industrial power generation equipment industry include Yanmar Holdings, Siemens Energy AG, Kohler Co., Mitsubishi Heavy Industries, Doosan Fuel Cell, FuelCell Energy Inc., Wartsila Corporation, General Electric (GE Vernova), Rolls-Royce Power Systems, Caterpillar Inc., MTU Onsite Energy, Cummins Inc., Kirloskar Oil Engines, Generac Holdings Inc., and Bloom Energy Corporation. To strengthen their position, companies in the industrial power generation equipment space are implementing targeted strategies such as expanding hybrid system offerings and integrating digital energy management tools. Many are investing in R&D to develop more fuel-flexible and emission-reducing technologies. Global manufacturers are also forming strategic partnerships with utility providers and industrial customers to enhance project execution and long-term service capabilities. Geographic expansion, especially in developing regions, along with upgrades to service and support networks, is helping firms secure new contracts and improve customer retention.
Table of Contents
Chapter 1 Methodology and Scope
- 1.1 Market scope and definition
- 1.2 Research design
- 1.2.1 Research approach
- 1.2.2 Data collection methods
- 1.3 Data mining sources
- 1.3.1 Global
- 1.3.2 Regional/Country
- 1.4 Base estimates and calculations
- 1.4.1 Base year calculation
- 1.4.2 Key trends for market estimation
- 1.5 Primary research and validation
- 1.5.1 Primary sources
- 1.6 Forecast model
- 1.7 Research assumptions and limitations
Chapter 2 Executive Summary
- 2.1 Industry 360° synopsis
- 2.2 Key market trends
- 2.2.1 Regional
- 2.2.2 Product type
- 2.2.3 Capacity
- 2.2.4 Fuel source
- 2.2.5 Application
- 2.2.6 End use industry
- 2.2.7 Distribution channel
- 2.3 CXO perspectives: strategic imperatives
- 2.3.1 Key decision points for industry executives
- 2.3.2 Critical success factors for market players
- 2.4 Future outlook and strategic recommendations
Chapter 3 Industry Insights
- 3.1 Industry ecosystem analysis
- 3.1.1 Supplier landscape
- 3.1.2 Profit margin
- 3.1.3 Value addition at each stage
- 3.1.4 Factor affecting the value chain
- 3.2 Industry impact forces
- 3.2.1 Growth drivers
- 3.2.1.1 Rising global energy demand
- 3.2.1.2 Transition toward cleaner energy
- 3.2.1.3 Technological advancements in equipment
- 3.2.2 Industry pitfalls & challenges
- 3.2.2.1 High capital investment requirements
- 3.2.2.2 Supply chain disruptions and material shortages
- 3.2.3 Opportunities
- 3.2.3.1 Expansion of renewable energy integration
- 3.2.3.2 Infrastructure modernization initiatives
- 3.2.1 Growth drivers
- 3.3 Growth potential analysis
- 3.4 Future market trends
- 3.5 Technology and innovation landscape
- 3.5.1 Current technological trends
- 3.5.2 Emerging technologies
- 3.6 Price trends
- 3.6.1 By region
- 3.6.2 By product type
- 3.7 Regulatory landscape
- 3.7.1 Standards and compliance requirements
- 3.7.2 Regional regulatory frameworks
- 3.7.3 Certification standards
- 3.8 Porter's analysis
- 3.9 PESTEL analysis
Chapter 4 Competitive Landscape, 2024
- 4.1 Introduction
- 4.2 Company market share analysis
- 4.2.1 By region
- 4.2.1.1 North America
- 4.2.1.2 Europe
- 4.2.1.3 Asia Pacific
- 4.2.1.4 Latin America
- 4.2.1.5 Middle East and Africa
- 4.2.1 By region
- 4.3 Company matrix analysis
- 4.4 Competitive analysis of major market players
- 4.5 Competitive positioning matrix
- 4.6 Key developments
- 4.6.1 Mergers & acquisitions
- 4.6.2 Partnerships & collaborations
- 4.6.3 New product launches
- 4.6.4 Expansion plans
Chapter 5 Market Estimates and Forecast, By Product Type, 2021 - 2034 (USD Billion) (Thousand Units)
- 5.1 Key trends
- 5.2 Gas turbines
- 5.2.1 Aeroderivative gas turbines
- 5.2.2 Heavy-duty gas turbines
- 5.2.3 Hydrogen-capable & dual-fuel turbines
- 5.3 Reciprocating engines
- 5.3.1 Diesel engines
- 5.3.2 Natural gas engines
- 5.3.3 Dual-fuel & flexible fuel engines
- 5.3.4 High-speed vs medium-speed engine
- 5.3.5 Emissions control & after-treatment systems
- 5.4 Steam turbines
- 5.4.1 Combined heat & power steam systems
- 5.4.2 Waste heat recovery steam generators
- 5.5 Fuel cells
- 5.5.1 Proton exchange membrane (PEM) fuel cells
- 5.5.2 solid oxide fuel cells
- 5.5.3 Molten carbonate fuel cells
- 5.5.4 Hybrid fuel cell systems & integration
- 5.6 Battery energy storage systems (BESS)
- 5.6.1 Lithium-ion battery systems
- 5.6.2 Flow battery systems & long-duration storage
- 5.6.3 Hybrid generator-battery system
- 5.6.4 Grid-scale energy storage integration
- 5.7 Hybrid & advanced systems
- 5.7.1 Generator-storage hybrid configurations
- 5.7.2 Fuel cell-turbine hybrid systems
- 5.7.3 Renewable-thermal hybrid plants
- 5.7.4 Modular & containerized solutions
Chapter 6 Market Estimates and Forecast, By Capacity, 2021 - 2034 (USD Billion) (Thousand Units)
- 6.1 Key trends
- 6.2 Baseload generation
- 6.3 Peak generation
- 6.4 Combined heat and power (CHP)
- 6.5 Emergency power
Chapter 7 Market Estimates and Forecast, By Fuel Source, 2021 - 2034 (USD Billion) (Thousand Units)
- 7.1 Key trends
- 7.2 Turbines (gas, steam, wind)
- 7.3 Engines (diesel, gas)
- 7.4 Boilers
- 7.5 Heat exchangers
- 7.6 Power transformers
Chapter 8 Market Estimates and Forecast, By Application 2021 - 2034 (USD Billion) (Thousand Units)
- 8.1 Key trends
- 8.2 Standby/emergency power
- 8.3 Prime power applications
- 8.4 Peak shaving & load management
- 8.5 Grid services & ancillary
- 8.6 Distributed generation & microgrids
Chapter 9 Market Estimates and Forecast, By End Use Industry, 2021 - 2034 (USD Billion) (Thousand Units)
- 9.1 Key trends
- 9.2 Data centers & IT infrastructure
- 9.3 Healthcare facilities
- 9.4 Pharmaceutical & research
- 9.5 Manufacturing industries
- 9.6 Oil & gas industry
Chapter 10 Market Estimates and Forecast, By Distribution Channel, 2021 - 2034 (USD Billion) (Thousand Units)
- 10.1 Key trends
- 10.2 Direct sales
- 10.3 Indirect sales
Chapter 11 Market Estimates and Forecast, By Region, 2021 - 2034 (USD Billion) (Thousand Units)
- 11.1 Key trends
- 11.2 North America
- 11.2.1 U.S.
- 11.2.2 Canada
- 11.3 Europe
- 11.3.1 Germany
- 11.3.2 UK
- 11.3.3 France
- 11.3.4 Italy
- 11.3.5 Spain
- 11.4 Asia Pacific
- 11.4.1 China
- 11.4.2 Japan
- 11.4.3 India
- 11.4.4 Australia
- 11.4.5 South Korea
- 11.5 Latin America
- 11.5.1 Brazil
- 11.5.2 Mexico
- 11.5.3 Argentina
- 11.6 Middle East and Africa
- 11.6.1 South Africa
- 11.6.2 Saudi Arabia
- 11.6.3 UAE
Chapter 12 Company Profiles
- 12.1 General Electric (GE Vernova)
- 12.2 Siemens Energy AG
- 12.3 Caterpillar Inc.
- 12.4 Cummins Inc.
- 12.5 Rolls-Royce Power Systems
- 12.6 Mitsubishi Heavy Industries
- 12.7 Wartsila Corporation
- 12.8 Generac Holdings Inc.
- 12.9 Kohler Co.
- 12.10 MTU Onsite Energy
- 12.11 Kirloskar Oil Engines
- 12.12 Yanmar Holdings
- 12.13 Bloom Energy Corporation
- 12.14 FuelCell Energy Inc
- 12.15 Doosan Fuel Cell
 分散式發電市場:按技術、功率輸出、電網類型、應用和最終用戶分類-2026年至2032年全球市場預測
 獨立型發電經營者 (IPP)
 2026年全球低熱水泥市場報告私人電廠市場:依技術、容量、電廠類型、營運模式、所有權模式及最終用戶分類-2026-2032年全球市場預測2026年全球分散式發電市場報告低溫餘熱發電系統市場按技術類型、溫度範圍、功率輸出、所有權模式、最終用戶產業、應用、安裝類型和銷售管道,全球預測,2026-2032年
 全球分散式發電市場規模、佔有率、趨勢和成長分析報告(2026-2034年)
 全球社區能源系統市場:預測(至2034年)-依能源來源、系統配置、儲能技術、數位化/控制平台、所有權/經營模式、應用、最終用戶和地區進行分析
 分散式能源產出系統市場-全球產業規模、佔有率、趨勢、機會、預測:按技術、最終用戶、地區和競爭對手分類,2021-2031年
 2026-2030年全球可再生分散式能源發電(RDEG)技術市場