


 |
市場調查報告書
商品編碼
1843275
全球天然氣發電市場(按技術、最終用戶、燃料來源、電力輸出和地區分類)- 2030 年預測Natural Gas Power Generation Market by Technology (Combined Cycle, Open Cycle, Cogeneration), End User (Power Utilities, Industrial, Residential & Commercial), Fuel Source (Pipeline, Liquefied), Power Output, and Region - Global Forecast to 2030 |
||||||
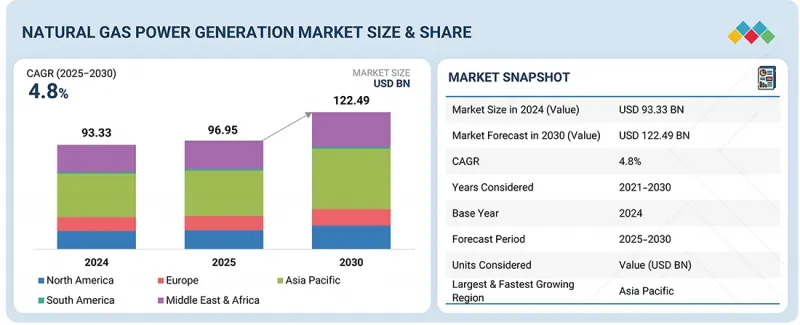
全球天然氣發電市場預計將從 2025 年的 969.5 億美元成長到 2030 年的 1,224.9 億美元,複合年成長率為 4.8%。
全球對更清潔、更靈活能源來源的需求不斷成長,推動了市場的發展。快速的都市化和工業化正在推動電力消耗,尤其是在新興經濟體。
| 調查範圍 | |
|---|---|
| 調查年份 | 2021-2030 |
| 基準年 | 2024 |
| 預測期 | 2025-2030 |
| 單元 | 100萬美元,兆瓦 |
| 部分 | 技術、燃料來源、電力輸出、最終用途、地區 |
| 目標區域 | 北美、歐洲、亞太地區、中東和非洲、南美 |
與煤炭相比,天然氣的碳排放相對較低,使其成為日益嚴格的環境法規背景下備受青睞的過渡燃料。複合迴圈和開式循環技術的進步提高了效率,並降低了營業成本。此外,天然氣發電廠能夠提供穩定的電網和快速的推出能力,並支援間歇性可再生能源的整合。液化天然氣貿易的成長進一步改善了燃料的可近性。
“按燃料來源分類,管道天然氣預計在預測期內仍將是最大的組成部分。”
管道天然氣為發電廠提供可靠、持續且經濟高效的燃料供應,以支持穩定的發電。憑藉完善的管道和配送網路等基礎設施,管道天然氣可以無縫地為集中式和分散式發電設施供電。此外,管道天然氣的碳排放低於其他石化燃料,符合全球能源轉型目標和以清潔能源來源為目標的法規結構。工業化、都市化以及重點地區電力需求的不斷成長將進一步推動管道天然氣的應用。此外,管道基礎設施的持續投資和擴建計劃鞏固了管道天然氣在市場上的主導地位,使其保持了首選燃料來源的地位。
“根據最終用途,預計發電將成為預測期內天然氣發電市場中最賺錢的部分。”
電力公司主要營運大型天然氣發電廠,提供穩定可靠的電力,以滿足日益成長的住宅、商業和工業需求。該領域受益於規模經濟、完善的基礎設施以及促進清潔能源來源發展的監管支持。電力需求的不斷成長,加上減少二氧化碳排放的需求,正推動電力公司採用天然氣作為主要燃料。此外,對電網現代化和擴建計劃的持續投資進一步鞏固了電力公司在市場中的主導地位,使其成為整個預測期內領先的終端用戶細分市場。
“按地區分類,預計中東和非洲將在預測期內成為第二大天然氣發電地區。”
由於豐富的天然氣蘊藏量以及工業和城市領域不斷成長的能源需求,中東和非洲已成為天然氣發電市場的第二大地區。沙烏地阿拉伯、阿拉伯聯合大公國和南非等國家正在經歷快速的經濟發展和都市化,推動了對可靠和清潔電源的需求。各國政府正在增加對天然氣基礎設施的投資,包括複合迴圈發電廠和液化天然氣終端,以減少對石油的依賴並增強能源安全。此外,有利的法規結構和採用清潔能源的獎勵正在鼓勵公用事業和獨立電力生產商擴大其天然氣產能。該地區對能源多樣化以及燃氣發電廠與可再生相結合的戰略重點進一步加強了市場成長。
本報告研究了全球天然氣發電市場,提供了關鍵促進因素和限制因素、競爭格局和未來趨勢的資訊。
目錄
第1章 引言
第2章調查方法
第3章執行摘要
第4章 主要發現
- 天然氣發電市場機會誘人
- 天然氣發電市場(按地區)
- 天然氣發電市場(按燃料技術)
- 按燃料來源分類的天然氣發電市場
- 天然氣發電市場(按產量)
- 天然氣發電市場(按最終用途分類)
- 亞太天然氣發電市場(依燃料來源及國家分列)
第5章 市場概況
- 介紹
- 市場動態
- 驅動程式
- 抑制因素
- 機會
- 任務
- 影響客戶業務的趨勢/中斷
- 供應鏈分析
- 生態系分析
- 技術分析
- 主要技術
- 鄰近技術
- 互補技術
- 案例研究分析
- 專利分析
- 大型會議和活動(2025-2026)
- 定價分析
- 天然氣發電廠資本投資(依產量分列)(2024年)
- 各地區天然氣發電廠平均資本支出(2022-2024年)
- 貿易分析
- 進口資料(HS編碼8411)
- 出口資料(HS編碼8411)
- 關稅和監管格局
- 海關分析
- 監管機構、政府機構和其他組織
- 規定
- 波特五力分析
- 主要相關利益者和採購標準
- 投資金籌措場景
- 人工智慧/發電AI對天然氣發電市場的影響
- 人工智慧/發電人工智慧在天然氣發電終端用途的應用
- 人工智慧/發電人工智慧對各地區天然氣電力供應鏈的影響
- 全球宏觀經濟展望
- 介紹
- 關注碳中和移動和工業
- 技術進步
- 資金籌措和政府政策支持
- 通貨膨脹背景下的高資本投資
- 2025年美國關稅對天然氣發電市場的影響
- 介紹
- 主要關稅稅率
- 價格影響分析
- 對國家的影響
- 對進出口的影響
- 全球天然氣發電的關稅變化和成長
- 對最終用途應用的影響
6. 天然氣發電市場(依技術)
- 介紹
- 複合迴圈
- 開放式循環
- 汽電共生
第7章:以燃料來源分類的天然氣發電市場
- 介紹
- 管道天然氣
- 液化天然氣
第 8 章:天然氣發電市場(按產量)
- 介紹
- 50MW或以下
- 51~200MW
- 201~500MW
- 501~1,000MW
- 超過1000兆瓦
9. 天然氣發電市場(依最終用途)
- 介紹
- 電力公司
- 工業
- 住宅和商業
第 10 章:按地區分類的天然氣發電市場
- 介紹
- 亞太地區
- 中國
- 印尼
- 韓國
- 泰國
- 日本
- 其他亞太地區
- 北美洲
- 美國
- 加拿大
- 墨西哥
- 南美洲
- 巴西
- 阿根廷
- 南美洲其他地區
- 歐洲
- 俄羅斯
- 英國
- 德國
- 義大利
- 法國
- 其他歐洲國家
- 中東和非洲
- GCC
- 伊朗
- 阿爾及利亞
- 奈及利亞
- 其他中東和非洲地區
第11章 競爭格局
- 概述
- 主要參與企業的策略/優勢(2021-2025)
- 市佔率分析(2024年)
- 收益分析(2020-2024)
- 公司估值及財務指標
- 比較品牌
- 企業評估矩陣:主要企業(2024年)
- 公司評估矩陣:Start-Ups/中小企業(2024 年)
- 競爭場景
第12章:公司簡介
- 主要企業
- GE VERNOVA
- SIEMENS ENERGY
- MITSUBISHI HEAVY INDUSTRIES, LTD.
- WARTSILA
- ANSALDO ENERGIA
- TECOGEN, INC.
- DESTINUS ENERGY
- BECHTEL CORPORATION
- FLUOR CORPORATION
- WORLEY
- CATERPILLAR
- MCDERMOTT
- CLARKE ENERGY
- BURNS & MCDONNELL
- CALPINE
- 其他公司
- CAPSTONE GREEN ENERGY HOLDINGS, INC.
- NAUTIX
- 2G ENERGY
- BOSCH INDUSTRIEKESSEL GMBH
- LARSEN & TOUBRO LIMITED
- BHARAT HEAVY ELECTRICALS LIMITED
- KAWASAKI HEAVY INDUSTRIES, LTD.
- SULZER LTD
- ALINTA ENERGY
- LATVENERGO AS
- GEORGIA POWER-SOUTHERN COMPANY
第13章 附錄
The global natural gas power generation market is expected to grow from USD 96.95 billion in 2025 to USD 122.49 billion in 2030, with a CAGR of 4.8%. The natural gas power generation market is driven by the increasing global demand for cleaner and more flexible energy sources. Rapid urbanization and industrialization are boosting electricity consumption, particularly in emerging economies.
| Scope of the Report | |
|---|---|
| Years Considered for the Study | 2021-2030 |
| Base Year | 2024 |
| Forecast Period | 2025-2030 |
| Units Considered | Value (USD Million); Volume (MW) |
| Segments | Technology, Fuel Source, Power Output, End-use Application, and Region |
| Regions covered | North America, Europe, Asia Pacific, Middle East & Africa, and South America |
The relatively lower carbon emissions of natural gas compared to coal make it a preferred transition fuel amid tightening environmental regulations. Advancements in combined cycle and open cycle technologies enhance efficiency and reduce operational costs. Additionally, natural gas power plants offer grid stability and quick ramp-up capabilities, supporting the integration of intermittent renewable energy sources. Rising LNG trade further improves fuel accessibility.
"By fuel source, the pipeline natural gas segment is expected to remain the largest segment during the forecast period."
By fuel source, the pipeline natural gas segment is projected to remain the largest segment in the natural gas power generation market throughout the forecast period. Pipeline natural gas offers a reliable, continuous, and cost-effective fuel supply for power plants, supporting stable electricity generation. Its well-established infrastructure, including extensive pipelines and distribution networks, ensures seamless delivery to both centralized and decentralized power generation facilities. Additionally, pipeline natural gas is favored for its lower carbon emissions compared to other fossil fuels, aligning with global energy transition goals and regulatory frameworks targeting cleaner energy sources. Growing industrialization, urbanization, and rising electricity demand in key regions further drive the adoption of pipeline natural gas. Moreover, ongoing investments in pipeline infrastructure and expansion projects reinforce its dominance in the market, maintaining its position as the preferred fuel source.
"By end-use application, power utilities is projected to be the most lucrative segment of the natural gas power generation market during the forecast period."
By end user, the power utilities segment is projected to be the most lucrative in the natural gas power generation market during the forecast period. Power utilities primarily operate large-scale natural gas power plants that provide consistent and reliable electricity to meet growing residential, commercial, and industrial demand. The segment benefits from economies of scale, established infrastructure, and regulatory support promoting cleaner energy sources. Increasing electricity demand, coupled with the need to reduce carbon emissions, drives utilities to adopt natural gas as a key fuel. Additionally, ongoing investments in grid modernization and expansion projects further strengthen the dominance of power utilities in the market, making them the leading end-user segment throughout the forecast period.
"By region, Middle East & Africa is expected to be the second-largest region in the natural gas power generation market during the forecast period."
The Middle East & Africa is emerging as the second-largest region in the natural gas power generation market, driven by abundant natural gas reserves and growing energy demand across industrial and urban sectors. Rapid economic development and urbanization in countries such as Saudi Arabia, the UAE, and South Africa are fueling the need for reliable and cleaner power sources. Governments are increasingly investing in natural gas infrastructure, including combined cycle plants and LNG terminals, to reduce dependence on oil and enhance energy security. Additionally, favorable regulatory frameworks and incentives for cleaner energy adoption encourage utilities and independent power producers to expand natural gas capacity. The region's strategic focus on energy diversification and integration of gas-fired plants with renewable energy further strengthens market growth.
Breakdown of Primaries:
In-depth interviews have been conducted with various key industry participants, subject-matter experts, C-level executives of key market players, and industry consultants, among other experts, to obtain and verify critical qualitative and quantitative information and assess future market prospects. The distribution of primary interviews is as follows:
By Company Type: Tier 1- 30%, Tier 2- 55%, and Tier 3- 15%
By Designation: C-Level Executives - 30%, Directors- 20%, and Others- 50%
By Region: North America- 20%, Europe- 8%, Asia Pacific- 55%, Middle East & Africa- 13%, and South America- 4%
Note: Others include product engineers, product specialists, and engineering leads.
Note: The tiers of the companies are defined based on their total revenues as of 2023. Tier 1: > USD 1 billion, Tier 2: From USD 500 million to USD 1 billion, and Tier 3: < USD 500 million
The natural gas power generation market is dominated by a few major players that have a wide regional presence. The leading players in the natural gas power generation market are GE Vernova (US), Siemens Energy (Germany), Tecogen, Inc. (US), Destinus Energy (US), Bechtel Corporation (US), Fluor Corporation (US), Worley (Australia), MITSUBISHI HEAVY INDUSTRIES, LTD. (Japan), Caterpillar Inc. (US), Wartsila (Finland), McDermott (US) and Clarke Energy (UK), among others.
Study Coverage:
The report defines, describes, and forecasts the natural gas power generation market by technology, fuel source, power output, and end user. It also offers a detailed qualitative and quantitative analysis of the market. The report provides a comprehensive review of the major market drivers, restraints, opportunities, and challenges. It also covers various important aspects of the market. These include an analysis of the competitive landscape, market dynamics, market estimates in terms of value, and future trends in natural gas power generation market.
Key Benefits of Buying the Report
- The natural gas power generation market is driven by the global transition toward cleaner and more flexible energy sources, particularly as countries aim to reduce carbon emissions while ensuring a reliable electricity supply. Natural gas offers a lower-emission alternative to coal and oil, making it ideal for meeting growing power demand in industrial, commercial, and residential sectors. Its fast ramp-up capabilities support grid stability and the integration of intermittent renewable energy sources such as solar and wind. Supportive government policies, emission regulations, and incentives for cleaner fuels are encouraging investment in gas-fired power plants. Technological advancements in combined cycle, open cycle, and LNG infrastructure are enhancing efficiency, reducing operational costs, and improving energy security. With the rising need for sustainable and reliable power, natural gas remains a crucial bridge fuel in the global energy transition.
- Product Development/Innovation: The natural gas power generation market is advancing through technological innovations aimed at improving efficiency, flexibility, and environmental performance. Companies are focusing on combined cycle and open cycle advancements that maximize energy output while reducing fuel consumption and emissions. Innovations in turbine design, heat recovery systems, and combustion technologies are enhancing operational efficiency and lowering greenhouse gas intensity. Modular and scalable gas-fired power plants enable faster deployment and flexible integration with renewable energy sources. Digitalization, including real-time monitoring, predictive maintenance, and smart grid integration, is optimizing plant performance and reliability. Additionally, developments in carbon capture, hydrogen blending, and co-firing strategies are further reducing the environmental footprint of natural gas power generation, making it a key transitional technology in the global shift toward sustainable energy.
- Market Development: In September 2025, Electricity Supply Board (ESB) of Ireland and GE Vernova partnered on a major life extension and modernization project for the Dublin Bay power plant to boost performance, reliability, output, and support Ireland's Net Zero 2040 targets. Under a new service agreement, GE Vernova will deploy its GT26 High Efficiency (HE) upgrade, SEMIPOL technology for Static Excitation Equipment (SEE), and Startup Frequency Converter (SFC). The project, scheduled for completion in 2026, will modernize the facility, which was commissioned in 2002 and currently produces up to 415 MW with a single-shaft GT26 gas turbine.
- Market Diversification: In August 2025, GE Vernova will invest in its Quebec factories at Sorel-Tracy (hydropower) and La Prairie (grid) sites. The move aligns with Hydro-Quebec's USD 200 billion 2035 Action Plan, including USD 150 billion in capital expansion to upgrade the grid, boost hydropower and wind capacity, and modernize infrastructure. GE Vernova's expansion aims to strengthen energy resilience, meet customer needs, and support long-term energy security.
- Competitive Assessment: Assessment of rankings of some of the key players, including of GE Vernova (US), Siemens Energy (Germany), Tecogen, Inc. (US), Destinus Energy (US), Bechtel Corporation (US), Fluor Corporation (US), Worley (Australia), MITSUBISHI HEAVY INDUSTRIES, LTD. (Japan), Caterpillar Inc. (US), Wartsila (Finland), McDermott (US) and Clarke Energy (UK), among others.
TABLE OF CONTENTS
1 INTRODUCTION
- 1.1 STUDY OBJECTIVES
- 1.2 MARKET DEFINITION
- 1.3 STUDY SCOPE
- 1.3.1 MARKETS COVERED AND REGIONAL SCOPE
- 1.3.2 INCLUSIONS AND EXCLUSIONS
- 1.3.3 YEARS CONSIDERED
- 1.4 CURRENCY CONSIDERED
- 1.5 UNIT CONSIDERED
- 1.6 LIMITATIONS
- 1.7 STAKEHOLDERS
2 RESEARCH METHODOLOGY
- 2.1 RESEARCH DATA
- 2.1.1 SECONDARY DATA
- 2.1.1.1 List of key secondary sources
- 2.1.1.2 Key data from secondary sources
- 2.1.2 PRIMARY DATA
- 2.1.2.1 List of primary interview participants
- 2.1.2.2 Key industry insights
- 2.1.2.3 Key data from primary sources
- 2.1.2.4 Breakdown of primaries
- 2.1.1 SECONDARY DATA
- 2.2 MARKET SIZE ESTIMATION
- 2.2.1 BOTTOM-UP APPROACH
- 2.2.1.1 Regional analysis
- 2.2.1.2 Country analysis
- 2.2.1.3 Demand-side assumptions
- 2.2.1.4 Demand-side calculations
- 2.2.2 TOP-DOWN APPROACH
- 2.2.2.1 Supply-side assumptions
- 2.2.2.2 Supply-side calculations
- 2.2.1 BOTTOM-UP APPROACH
- 2.3 MARKET BREAKDOWN AND DATA TRIANGULATION
- 2.4 FORECAST
- 2.5 RESEARCH ASSUMPTIONS
- 2.6 RISK ANALYSIS
- 2.7 RESEARCH LIMITATIONS
3 EXECUTIVE SUMMARY
4 PREMIUM INSIGHTS
- 4.1 ATTRACTIVE OPPORTUNITIES FOR PLAYERS IN NATURAL GAS POWER GENERATION MARKET
- 4.2 NATURAL GAS POWER GENERATION MARKET, BY REGION
- 4.3 NATURAL GAS POWER GENERATION MARKET, BY FUEL TECHNOLOGY
- 4.4 NATURAL GAS POWER GENERATION MARKET, BY FUEL SOURCE
- 4.5 NATURAL GAS POWER GENERATION MARKET, BY POWER OUTPUT
- 4.6 NATURAL GAS POWER GENERATION MARKET, BY END-USE APPLICATION
- 4.7 NATURAL GAS POWER GENERATION MARKET IN ASIA PACIFIC, BY FUEL SOURCE AND COUNTRY
5 MARKET OVERVIEW
- 5.1 INTRODUCTION
- 5.2 MARKET DYNAMICS
- 5.2.1 DRIVERS
- 5.2.1.1 Shift from coal to cleaner energy alternatives
- 5.2.1.2 High efficiency of combined-cycle gas turbines
- 5.2.1.3 Expanding gas-fired capacity
- 5.2.2 RESTRAINTS
- 5.2.2.1 Volatile price of natural gas
- 5.2.2.2 High infrastructure costs
- 5.2.2.3 Alternative cheaper clean energy technologies
- 5.2.3 OPPORTUNITIES
- 5.2.3.1 Emphasis on securing sustainable energy future
- 5.2.3.2 Expansion of LNG infrastructure
- 5.2.3.3 Ongoing technological advancements in CCUS
- 5.2.4 CHALLENGES
- 5.2.4.1 Global commitments to achieve net-zero emissions
- 5.2.4.2 Fuel-related security challenges due to import reliance
- 5.2.1 DRIVERS
- 5.3 TRENDS/DISRUPTIONS IMPACTING CUSTOMER BUSINESS
- 5.4 SUPPLY CHAIN ANALYSIS
- 5.5 ECOSYSTEM ANALYSIS
- 5.6 TECHNOLOGY ANALYSIS
- 5.6.1 KEY TECHNOLOGIES
- 5.6.1.1 Carbon capture, utilization, and storage (CCUS) for gas plants
- 5.6.1.2 Hybrid power plants
- 5.6.2 ADJACENT TECHNOLOGIES
- 5.6.2.1 Natural gas pipeline & distribution infrastructure
- 5.6.2.2 Reciprocating engines
- 5.6.3 COMPLEMENTARY TECHNOLOGIES
- 5.6.3.1 Smart grids
- 5.6.3.2 Energy management systems
- 5.6.1 KEY TECHNOLOGIES
- 5.7 CASE STUDY ANALYSIS
- 5.7.1 REAL-TIME AND AI-ENABLED MONITORING OF STEAM SYSTEM FAULTS DELIVERS COST SAVINGS AND PREDICTIVE MAINTENANCE
- 5.7.2 ADVANCED GRID-BALANCING ASSETS ENHANCE FLEXIBILITY AND DECARBONIZATION IN CALIFORNIA'S GRID INFRASTRUCTURE
- 5.7.3 SCE HYBRID PLANT COMBINES BATTERY STORAGE AND PEAKER TURBINE FOR GRID FLEXIBILITY AND EMISSIONS REDUCTION
- 5.8 PATENT ANALYSIS
- 5.9 KEY CONFERENCES AND EVENTS, 2025-2026
- 5.10 PRICING ANALYSIS
- 5.10.1 INDICATIVE CAPITAL EXPENDITURE ON NATURAL GAS POWER PLANTS, BY POWER OUTPUT, 2024
- 5.10.2 AVERAGE CAPITAL EXPENDITURE ON NATURAL GAS POWER PLANTS, BY REGION, 2022-2024
- 5.11 TRADE ANALYSIS
- 5.11.1 IMPORT DATA (HS CODE 8411)
- 5.11.2 EXPORT DATA (HS CODE 8411)
- 5.12 TARIFF AND REGULATORY LANDSCAPE
- 5.12.1 TARIFF ANALYSIS
- 5.12.2 REGULATORY BODIES, GOVERNMENT AGENCIES, AND OTHER ORGANIZATIONS
- 5.12.3 REGULATIONS
- 5.13 PORTER'S FIVE FORCES ANALYSIS
- 5.13.1 THREAT OF NEW ENTRANTS
- 5.13.2 THREAT OF SUBSTITUTES
- 5.13.3 BARGAINING POWER OF SUPPLIERS
- 5.13.4 BARGAINING POWER OF BUYERS
- 5.13.5 INTENSITY OF COMPETITIVE RIVALRY
- 5.14 KEY STAKEHOLDERS AND BUYING CRITERIA
- 5.14.1 KEY STAKEHOLDERS IN BUYING PROCESS
- 5.14.2 BUYING CRITERIA
- 5.15 INVESTMENT AND FUNDING SCENARIO
- 5.16 IMPACT OF AI/GEN AI ON NATURAL GAS POWER GENERATION MARKET
- 5.16.1 ADOPTION OF AI/GEN AI IN NATURAL GAS POWER GENERATION END-USE APPLICATIONS
- 5.16.2 IMPACT OF AI/GEN AI ON NATURAL GAS POWER GENERATION SUPPLY CHAIN, BY REGION
- 5.17 GLOBAL MACROECONOMIC OUTLOOK
- 5.17.1 INTRODUCTION
- 5.17.2 FOCUS ON CARBON-NEUTRAL MOBILITY AND INDUSTRY
- 5.17.3 TECHNOLOGICAL ADVANCEMENTS
- 5.17.4 FINANCING AND GOVERNMENT POLICY SUPPORT
- 5.17.5 HIGH CAPEX AMID INFLATION
- 5.18 IMPACT OF 2025 US TARIFF ON NATURAL GAS POWER GENERATION MARKET
- 5.18.1 INTRODUCTION
- 5.18.2 KEY TARIFF RATES
- 5.18.3 PRICE IMPACT ANALYSIS
- 5.18.4 IMPACT ON COUNTRIES/REGIONS
- 5.18.4.1 US
- 5.18.4.2 Europe
- 5.18.4.3 Asia Pacific
- 5.18.5 IMPACT ON IMPORTS/EXPORTS
- 5.18.6 TARIFF SHIFTS AND GROWTH IN GLOBAL NATURAL GAS POWER GENERATION
- 5.18.7 IMPACT ON END-USE APPLICATIONS
6 NATURAL GAS POWER GENERATION MARKET, BY TECHNOLOGY
- 6.1 INTRODUCTION
- 6.2 COMBINED CYCLE
- 6.2.1 GROWING DEMAND FOR LOW-EMISSION POWER GENERATION SOLUTIONS TO FOSTER MARKET GROWTH
- 6.3 OPEN CYCLE
- 6.3.1 SUITABILITY FOR PEAKING POWER PLANTS AND BACKUP GENERATION TO BOOST DEMAND
- 6.4 COGENERATION
- 6.4.1 EMPHASIS ON COST SAVINGS TO DRIVE MARKET
7 NATURAL GAS POWER GENERATION MARKET, BY FUEL SOURCE
- 7.1 INTRODUCTION
- 7.2 PIPELINE NATURAL GAS
- 7.2.1 PROMOTION OF CLEANER ENERGY SOURCES TO SUPPORT MARKET GROWTH
- 7.3 LIQUEFIED NATURAL GAS
- 7.3.1 INNOVATIONS IN LIQUEFACTION, SHIPPING, AND REGASIFICATION TO FOSTER MARKET GROWTH
8 NATURAL GAS POWER GENERATION MARKET, BY POWER OUTPUT
- 8.1 INTRODUCTION
- 8.2 UP TO 50 MW
- 8.2.1 RISING DEMAND FOR DECENTRALIZED POWER SOLUTIONS TO DRIVE MARKET
- 8.3 51-200 MW
- 8.3.1 SUITABILITY FOR REGIONAL GRIDS, INDUSTRIAL CLUSTERS, AND URBAN CENTERS TO BOOST DEMAND
- 8.4 201-500 MW
- 8.4.1 LARGE-SCALE ELECTRICITY DEMAND FROM URBAN CENTERS, INDUSTRIAL HUBS, AND NATIONAL GRIDS TO FOSTER MARKET GROWTH
- 8.5 501-1,000 MW
- 8.5.1 INTEGRATION OF DIGITAL TWIN PLATFORMS TO OFFER GROWTH OPPORTUNITIES
- 8.6 ABOVE 1,000 MW
- 8.6.1 RAPID TECHNOLOGICAL AND DIGITAL ADVANCEMENTS TO BOOST DEMAND
9 NATURAL GAS POWER GENERATION MARKET, BY END-USE APPLICATION
- 9.1 INTRODUCTION
- 9.2 POWER UTILITIES
- 9.2.1 GOVERNMENT-BACKED CLEAN ENERGY INITIATIVES TO BOOST DEMAND
- 9.3 INDUSTRIAL
- 9.3.1 ADOPTION OF DIGITAL AND AUTOMATED CONTROL SYSTEMS TO FUEL MARKET GROWTH
- 9.4 RESIDENTIAL & COMMERCIAL
- 9.4.1 RISING DEMAND FOR DECENTRALIZED AND BACKUP POWER SOLUTIONS ACROSS URBAN CENTERS TO DRIVE MARKET
10 NATURAL GAS POWER GENERATION MARKET, BY REGION
- 10.1 INTRODUCTION
- 10.2 ASIA PACIFIC
- 10.2.1 CHINA
- 10.2.1.1 Increasing investment in modern gas-fired power plants to boost demand
- 10.2.2 INDONESIA
- 10.2.2.1 Emphasis on reducing carbon emissions to drive market
- 10.2.3 SOUTH KOREA
- 10.2.3.1 Expansion of combined-cycle gas turbine plants in coastal regions to fuel market growth
- 10.2.4 THAILAND
- 10.2.4.1 Rising demand in electricity generation and industrial consumption to foster market growth
- 10.2.5 JAPAN
- 10.2.5.1 Focus on minimizing dependency on fossil fuels to drive market
- 10.2.6 REST OF ASIA PACIFIC
- 10.2.1 CHINA
- 10.3 NORTH AMERICA
- 10.3.1 US
- 10.3.1.1 Surging consumption in electric power sector to fuel market growth
- 10.3.2 CANADA
- 10.3.2.1 Rising need to phase out coal-fired power plants to foster market growth
- 10.3.3 MEXICO
- 10.3.3.1 Emphasis on modernizing power fleet to boost demand
- 10.3.1 US
- 10.4 SOUTH AMERICA
- 10.4.1 BRAZIL
- 10.4.1.1 Growing applications in powering industrial growth and energy-intensive operations to fuel market growth
- 10.4.2 ARGENTINA
- 10.4.2.1 Rising demand for flexible energy sources to complement renewable energy sources to drive market
- 10.4.3 REST OF SOUTH AMERICA
- 10.4.1 BRAZIL
- 10.5 EUROPE
- 10.5.1 RUSSIA
- 10.5.1.1 Abundance of reserves and extensive pipeline network to boost demand
- 10.5.2 UK
- 10.5.2.1 Rapid electrification across transport, heating, and digital infrastructure to fuel market growth
- 10.5.3 GERMANY
- 10.5.3.1 Emphasis on modernizing high-efficiency gas infrastructure to support market growth
- 10.5.4 ITALY
- 10.5.4.1 Development of hydrogen-ready infrastructure to boost demand
- 10.5.5 FRANCE
- 10.5.5.1 Expansion of LNG infrastructure to foster market growth
- 10.5.6 REST OF EUROPE
- 10.5.1 RUSSIA
- 10.6 MIDDLE EAST & AFRICA
- 10.6.1 GCC
- 10.6.1.1 Saudi Arabia
- 10.6.1.1.1 Government initiatives to diversify energy mix to offer growth opportunities
- 10.6.1.2 UAE
- 10.6.1.2.1 Emphasis on modernizing natural gas infrastructure to drive market
- 10.6.1.3 Rest of GCC
- 10.6.1.1 Saudi Arabia
- 10.6.2 IRAN
- 10.6.2.1 Expansion of energy-intensive industries to drive market
- 10.6.3 ALGERIA
- 10.6.3.1 Presence of strong export-oriented gas industry to boost demand
- 10.6.4 NIGERIA
- 10.6.4.1 Increasing demand for reliable electricity to fuel economic development to drive market
- 10.6.5 REST OF MIDDLE EAST & AFRICA
- 10.6.1 GCC
11 COMPETITIVE LANDSCAPE
- 11.1 OVERVIEW
- 11.2 KEY PLAYER STRATEGIES/RIGHT TO WIN, 2021-2025
- 11.3 MARKET SHARE ANALYSIS, 2024
- 11.4 REVENUE ANALYSIS, 2020-2024
- 11.5 COMPANY VALUATION AND FINANCIAL METRICS
- 11.6 BRAND COMPARISON
- 11.7 COMPANY EVALUATION MATRIX: KEY PLAYERS, 2024
- 11.7.1 STARS
- 11.7.2 EMERGING LEADERS
- 11.7.3 PERVASIVE PLAYERS
- 11.7.4 PARTICIPANTS
- 11.7.5 COMPANY FOOTPRINT: KEY PLAYERS, 2024
- 11.7.5.1 Company footprint
- 11.7.5.2 Region footprint
- 11.7.5.3 End-use application footprint
- 11.7.5.4 Technology footprint
- 11.7.5.5 Fuel source footprint
- 11.8 COMPANY EVALUATION MATRIX: STARTUPS/SMES, 2024
- 11.8.1 PROGRESSIVE COMPANIES
- 11.8.2 RESPONSIVE COMPANIES
- 11.8.3 DYNAMIC COMPANIES
- 11.8.4 STARTING BLOCKS
- 11.8.5 COMPETITIVE BENCHMARKING: STARTUPS/SMES, 2024
- 11.8.5.1 Detailed list of key startups/SMEs
- 11.8.5.2 Competitive benchmarking of key startups/SMEs
- 11.9 COMPETITIVE SCENARIO
- 11.9.1 DEALS
- 11.9.2 OTHER DEVELOPMENTS
12 COMPANY PROFILES
- 12.1 KEY PLAYERS
- 12.1.1 GE VERNOVA
- 12.1.1.1 Business overview
- 12.1.1.2 Products/Solutions/Services offered
- 12.1.1.3 Recent developments
- 12.1.1.3.1 Deals
- 12.1.1.3.2 Other developments
- 12.1.1.4 MnM view
- 12.1.1.4.1 Key strengths/Right to win
- 12.1.1.4.2 Strategic choices
- 12.1.1.4.3 Weaknesses/Competitive threats
- 12.1.2 SIEMENS ENERGY
- 12.1.2.1 Business overview
- 12.1.2.2 Products/Solutions/Services offered
- 12.1.2.3 Recent developments
- 12.1.2.3.1 Developments
- 12.1.2.4 MnM view
- 12.1.2.4.1 Key strengths/Right to win
- 12.1.2.4.2 Strategic choices
- 12.1.2.4.3 Weaknesses/Competitive threats
- 12.1.3 MITSUBISHI HEAVY INDUSTRIES, LTD.
- 12.1.3.1 Business overview
- 12.1.3.2 Products/Solutions/Services offered
- 12.1.3.3 Recent developments
- 12.1.3.3.1 Developments
- 12.1.3.4 MnM view
- 12.1.3.4.1 Key strengths/Right to win
- 12.1.3.4.2 Strategic choices
- 12.1.3.4.3 Weaknesses/Competitive threats
- 12.1.4 WARTSILA
- 12.1.4.1 Business overview
- 12.1.4.2 Products/Solutions/Services offered
- 12.1.4.3 Recent developments
- 12.1.4.3.1 Developments
- 12.1.4.4 MnM view
- 12.1.4.4.1 Key strengths/Right to win
- 12.1.4.4.2 Strategic choices
- 12.1.4.4.3 Weaknesses/Competitive threats
- 12.1.5 ANSALDO ENERGIA
- 12.1.5.1 Business overview
- 12.1.5.2 Products/Solutions/Services offered
- 12.1.5.3 Recent developments
- 12.1.5.3.1 Developments
- 12.1.5.4 MnM view
- 12.1.5.4.1 Key strengths/Right to win
- 12.1.5.4.2 Strategic choices
- 12.1.5.4.3 Weaknesses/Competitive threats
- 12.1.6 TECOGEN, INC.
- 12.1.6.1 Business overview
- 12.1.6.2 Products/Solutions/Services offered
- 12.1.6.3 Recent developments
- 12.1.6.3.1 Deals
- 12.1.6.3.2 Other developments
- 12.1.7 DESTINUS ENERGY
- 12.1.7.1 Business overview
- 12.1.7.2 Products/Solutions/Services offered
- 12.1.7.3 Recent developments
- 12.1.7.3.1 Deals
- 12.1.8 BECHTEL CORPORATION
- 12.1.8.1 Business overview
- 12.1.8.2 Products/Solutions/Services offered
- 12.1.8.3 Recent developments
- 12.1.8.3.1 Developments
- 12.1.9 FLUOR CORPORATION
- 12.1.9.1 Business overview
- 12.1.9.2 Products/Solutions/Services offered
- 12.1.9.3 Recent developments
- 12.1.9.3.1 Developments
- 12.1.10 WORLEY
- 12.1.10.1 Business overview
- 12.1.10.2 Products/Solutions/Services offered
- 12.1.10.3 Recent developments
- 12.1.10.3.1 Developments
- 12.1.11 CATERPILLAR
- 12.1.11.1 Business overview
- 12.1.11.2 Products/Solutions/Services offered
- 12.1.12 MCDERMOTT
- 12.1.12.1 Business overview
- 12.1.12.2 Products/Solutions/Services offered
- 12.1.13 CLARKE ENERGY
- 12.1.13.1 Business overview
- 12.1.13.2 Products/Solutions/Services offered
- 12.1.14 BURNS & MCDONNELL
- 12.1.14.1 Business overview
- 12.1.14.2 Products/Solutions/Services offered
- 12.1.15 CALPINE
- 12.1.15.1 Business overview
- 12.1.15.2 Products/Solutions/Services offered
- 12.1.1 GE VERNOVA
- 12.2 OTHER PLAYERS
- 12.2.1 CAPSTONE GREEN ENERGY HOLDINGS, INC.
- 12.2.2 NAUTIX
- 12.2.3 2G ENERGY
- 12.2.4 BOSCH INDUSTRIEKESSEL GMBH
- 12.2.5 LARSEN & TOUBRO LIMITED
- 12.2.6 BHARAT HEAVY ELECTRICALS LIMITED
- 12.2.7 KAWASAKI HEAVY INDUSTRIES, LTD.
- 12.2.8 SULZER LTD
- 12.2.9 ALINTA ENERGY
- 12.2.10 LATVENERGO AS
- 12.2.11 GEORGIA POWER - SOUTHERN COMPANY
13 APPENDIX
- 13.1 INSIGHTS FROM INDUSTRY EXPERTS
- 13.2 DISCUSSION GUIDE
- 13.3 KNOWLEDGESTORE: MARKETSANDMARKETS' SUBSCRIPTION PORTAL
- 13.4 CUSTOMIZATION OPTIONS
- 13.5 RELATED REPORTS
- 13.6 AUTHOR DETAILS
List of Tables
- TABLE 1 INCLUSIONS AND EXCLUSIONS IN NATURAL GAS POWER GENERATION MARKET
- TABLE 2 NATURAL GAS POWER GENERATION MARKET SIZE ESTIMATION METHODOLOGY (DEMAND SIDE)
- TABLE 3 NATURAL GAS POWER GENERATION MARKET: RISK ANALYSIS
- TABLE 4 NATURAL GAS POWER GENERATION MARKET SNAPSHOT
- TABLE 5 ROLE OF COMPANIES IN NATURAL GAS POWER GENERATION ECOSYSTEM
- TABLE 6 LIST OF KEY PATENTS, 2019-2022
- TABLE 7 LIST OF KEY CONFERENCES AND EVENTS, 2025-2026
- TABLE 8 INDICATIVE CAPITAL EXPENDITURE ON NATURAL GAS POWER PLANTS, BY POWER OUTPUT, 2024 (USD MILLION/MW)
- TABLE 9 AVERAGE CAPITAL EXPENDITURE ON NATURAL GAS POWER GENERATION, BY REGION, 2022-2024 (USD MILLION/MW)
- TABLE 10 IMPORT DATA FOR HS CODE 8411-COMPLIANT PRODUCTS, BY COUNTRY, 2020-2024 (USD THOUSAND)
- TABLE 11 EXPORT DATA FOR HS CODE 8411-COMPLIANT PRODUCTS, BY COUNTRY, 2020-2024 (USD THOUSAND)
- TABLE 12 IMPORT DATA FOR HS CODE 8411-COMPLIANT PRODUCTS (EXCLUDING GENERATING SETS), 2024
- TABLE 13 NORTH AMERICA: REGULATORY BODIES, GOVERNMENT AGENCIES, AND OTHER ORGANIZATIONS
- TABLE 14 EUROPE: REGULATORY BODIES, GOVERNMENT AGENCIES, AND OTHER ORGANIZATIONS
- TABLE 15 ASIA PACIFIC: REGULATORY BODIES, GOVERNMENT AGENCIES, AND OTHER ORGANIZATIONS
- TABLE 16 MIDDLE EAST & AFRICA: REGULATORY BODIES, GOVERNMENT AGENCIES, AND OTHER ORGANIZATIONS
- TABLE 17 SOUTH AMERICA: REGULATORY BODIES, GOVERNMENT AGENCIES, AND OTHER ORGANIZATIONS
- TABLE 18 REGULATIONS IN NORTH AMERICA
- TABLE 19 REGULATIONS IN EUROPE
- TABLE 20 REGULATIONS IN ASIA PACIFIC
- TABLE 21 REGULATIONS IN MIDDLE EAST & AFRICA
- TABLE 22 REGULAIONS IN IN SOUTH AMERICA
- TABLE 23 IMPACT OF PORTER'S FIVE FORCES ANALYSIS
- TABLE 24 INFLUENCE OF KEY STAKEHOLDERS ON BUYING PROCESS FOR TOP END-USE APPLICATIONS (%)
- TABLE 25 KEY BUYING CRITERIA FOR TOP THREE END-USE APPLICATIONS
- TABLE 26 US-ADJUSTED RECIPROCAL TARIFF RATES, 2024 (USD BILLION)
- TABLE 27 EXPECTED CHANGE IN PRICES AND LIKELY IMPACT ON END-USE APPLICATIONS DUE TO TARIFF
- TABLE 28 NATURAL GAS POWER GENERATION MARKET, BY TECHNOLOGY, 2021-2024 (USD MILLION)
- TABLE 29 NATURAL GAS POWER GENERATION MARKET, BY TECHNOLOGY, 2025-2030 (USD MILLION)
- TABLE 30 COMBINED CYCLE: NATURAL GAS POWER GENERATION MARKET, BY REGION, 2021-2024 (USD MILLION)
- TABLE 31 COMBINED CYCLE: NATURAL GAS POWER GENERATION MARKET, BY REGION, 2025-2030 (USD MILLION)
- TABLE 32 OPEN CYCLE: NATURAL GAS POWER GENERATION MARKET, BY REGION, 2021-2024 (USD MILLION)
- TABLE 33 OPEN CYCLE: NATURAL GAS POWER GENERATION MARKET, BY REGION, 2025-2030 (USD MILLION)
- TABLE 34 COGENERATION: NATURAL GAS POWER GENERATION MARKET, BY REGION, 2021-2024 (USD MILLION)
- TABLE 35 COGENERATION: NATURAL GAS POWER GENERATION MARKET, BY REGION, 2025-2030 (USD MILLION)
- TABLE 36 NATURAL GAS POWER GENERATION MARKET, BY FUEL SOURCE, 2021-2024 (USD MILLION)
- TABLE 37 NATURAL GAS POWER GENERATION MARKET, BY FUEL SOURCE, 2025-2030 (USD MILLION)
- TABLE 38 PIPELINE NATURAL GAS: NATURAL GAS POWER GENERATION MARKET, BY REGION, 2021-2024 (USD MILLION)
- TABLE 39 PIPELINE NATURAL GAS: NATURAL GAS POWER GENERATION MARKET, BY REGION, 2025-2030 (USD MILLION)
- TABLE 40 LIQUEFIED NATURAL GAS: NATURAL GAS POWER GENERATION MARKET, BY REGION, 2021-2024 (USD MILLION)
- TABLE 41 LIQUEFIED NATURAL GAS: NATURAL GAS POWER GENERATION MARKET, BY REGION, 2025-2030 (USD MILLION)
- TABLE 42 NATURAL GAS POWER GENERATION MARKET, BY POWER OUTPUT, 2021-2024 (USD MILLION)
- TABLE 43 NATURAL GAS POWER GENERATION MARKET, BY POWER OUTPUT, 2025-2030 (USD MILLION)
- TABLE 44 UP TO 50 MW: NATURAL GAS POWER GENERATION MARKET, BY REGION, 2021-2024 (USD MILLION)
- TABLE 45 UP TO 50 MW: NATURAL GAS POWER GENERATION MARKET, BY REGION, 2025-2030 (USD MILLION)
- TABLE 46 51-200 MW: NATURAL GAS POWER GENERATION MARKET, BY REGION, 2021-2024 (USD MILLION)
- TABLE 47 51-200 MW: NATURAL GAS POWER GENERATION MARKET, BY REGION, 2025-2030 (USD MILLION)
- TABLE 48 201-500 MW: NATURAL GAS POWER GENERATION MARKET, BY REGION, 2021-2024 (USD MILLION)
- TABLE 49 201-500 MW: NATURAL GAS POWER GENERATION MARKET, BY REGION, 2025-2030 (USD MILLION)
- TABLE 50 501-1,000 MW: NATURAL GAS POWER GENERATION MARKET, BY REGION, 2021-2024 (USD MILLION)
- TABLE 51 501-1,000 MW: NATURAL GAS POWER GENERATION MARKET, BY REGION, 2025-2030 (USD MILLION)
- TABLE 52 ABOVE 1,000 MW: NATURAL GAS POWER GENERATION MARKET, BY REGION, 2021-2024 (USD MILLION)
- TABLE 53 ABOVE 1,000 MW: NATURAL GAS POWER GENERATION MARKET, BY REGION, 2025-2030 (USD MILLION)
- TABLE 54 NATURAL GAS POWER GENERATION MARKET, BY END-USE APPLICATION, 2021-2024 (USD MILLION)
- TABLE 55 NATURAL GAS POWER GENERATION MARKET, BY END-USE APPLICATION, 2025-2030 (USD MILLION)
- TABLE 56 POWER UTILITIES: NATURAL GAS POWER GENERATION MARKET, BY REGION, 2021-2024 (USD MILLION)
- TABLE 57 POWER UTILITIES: NATURAL GAS POWER GENERATION MARKET, BY REGION, 2025-2030 (USD MILLION)
- TABLE 58 INDUSTRIAL: NATURAL GAS POWER GENERATION MARKET, BY REGION, 2021-2024 (USD MILLION)
- TABLE 59 INDUSTRIAL: NATURAL GAS POWER GENERATION MARKET, BY REGION, 2025-2030 (USD MILLION)
- TABLE 60 RESIDENTIAL & COMMERCIAL: NATURAL GAS POWER GENERATION MARKET, BY REGION, 2021-2024 (USD MILLION)
- TABLE 61 RESIDENTIAL & COMMERCIAL: NATURAL GAS POWER GENERATION MARKET, BY REGION, 2025-2030 (USD MILLION)
- TABLE 62 NATURAL GAS POWER GENERATION MARKET, BY REGION, 2021-2024 (USD MILLION)
- TABLE 63 NATURAL GAS POWER GENERATION MARKET, BY REGION, 2025-2030 (USD MILLION)
- TABLE 64 NATURAL GAS POWER GENERATION MARKET, BY REGION, 2021-2024 (MW)
- TABLE 65 NATURAL GAS POWER GENERATION MARKET, BY REGION, 2025-2030 (MW)
- TABLE 66 ASIA PACIFIC: NATURAL GAS POWER GENERATION MARKET, BY TECHNOLOGY, 2021-2024 (USD MILLION)
- TABLE 67 ASIA PACIFIC: NATURAL GAS POWER GENERATION MARKET, BY TECHNOLOGY, 2025-2030 (USD MILLION)
- TABLE 68 ASIA PACIFIC: NATURAL GAS POWER GENERATION MARKET, BY POWER OUTPUT, 2021-2024 (USD MILLION)
- TABLE 69 ASIA PACIFIC: NATURAL GAS POWER GENERATION MARKET, BY TYPE, 2025-2030 (USD MILLION)
- TABLE 70 ASIA PACIFIC: NATURAL GAS POWER GENERATION MARKET, BY FUEL SOURCE, 2021-2024 (USD MILLION)
- TABLE 71 ASIA PACIFIC: NATURAL GAS POWER GENERATION MARKET, BY APPLICATION, 2025-2030 (USD MILLION)
- TABLE 72 ASIA PACIFIC: NATURAL GAS POWER GENERATION MARKET, BY END-USE APPLICATION, 2021-2024 (USD MILLION)
- TABLE 73 ASIA PACIFIC: NATURAL GAS POWER GENERATION MARKET, BY END-USE APPLICATION, 2025-2030 (USD MILLION)
- TABLE 74 ASIA PACIFIC: NATURAL GAS POWER GENERATION MARKET, BY COUNTRY, 2021-2024 (USD MILLION)
- TABLE 75 ASIA PACIFIC: NATURAL GAS POWER GENERATION MARKET, BY COUNTRY, 2025-2030 (USD MILLION)
- TABLE 76 CHINA: NATURAL GAS POWER GENERATION MARKET, BY END-USE APPLICATION, 2021-2024 (USD MILLION)
- TABLE 77 CHINA: NATURAL GAS POWER GENERATION MARKET, BY END-USE APPLICATION, 2025-2030 (USD MILLION)
- TABLE 78 INDONESIA: NATURAL GAS POWER GENERATION MARKET, BY END-USE APPLICATION, 2021-2024 (USD MILLION)
- TABLE 79 INDONESIA: NATURAL GAS POWER GENERATION MARKET, BY END-USE APPLICATION, 2025-2030 (USD MILLION)
- TABLE 80 SOUTH KOREA: NATURAL GAS POWER GENERATION MARKET, BY END-USE APPLICATION, 2021-2024 (USD MILLION)
- TABLE 81 SOUTH KOREA: NATURAL GAS POWER GENERATION MARKET, BY END-USE APPLICATION, 2025-2030 (USD MILLION)
- TABLE 82 THAILAND: NATURAL GAS POWER GENERATION MARKET, BY END-USE APPLICATION, 2021-2024 (USD MILLION)
- TABLE 83 THAILAND: NATURAL GAS POWER GENERATION MARKET, BY END-USE APPLICATION, 2025-2030 (USD MILLION)
- TABLE 84 JAPAN: NATURAL GAS POWER GENERATION MARKET, BY END-USE APPLICATION, 2021-2024 (USD MILLION)
- TABLE 85 JAPAN: NATURAL GAS POWER GENERATION MARKET, BY END-USE APPLICATION, 2025-2030 (USD MILLION)
- TABLE 86 REST OF ASIA PACIFIC: NATURAL GAS POWER GENERATION MARKET, BY END-USE APPLICATION, 2021-2024 (USD MILLION)
- TABLE 87 REST OF ASIA PACIFIC: NATURAL GAS POWER GENERATION MARKET, BY END-USE APPLICATION, 2025-2030 (USD MILLION)
- TABLE 88 NORTH AMERICA: NATURAL GAS POWER GENERATION MARKET, BY TECHNOLOGY, 2021-2024 (USD MILLION)
- TABLE 89 NORTH AMERICA: NATURAL GAS POWER GENERATION MARKET, BY TECHNOLOGY, 2025-2030 (USD MILLION)
- TABLE 90 NORTH AMERICA: NATURAL GAS POWER GENERATION MARKET, BY POWER OUTPUT, 2021-2024 (USD MILLION)
- TABLE 91 NORTH AMERICA: NATURAL GAS POWER GENERATION MARKET, BY POWER OUTPUT, 2025-2030 (USD MILLION)
- TABLE 92 NORTH AMERICA: NATURAL GAS POWER GENERATION MARKET, BY FUEL SOURCE, 2021-2024 (USD MILLION)
- TABLE 93 NORTH AMERICA: NATURAL GAS POWER GENERATION MARKET, BY APPLICATION, 2025-2030 (USD MILLION)
- TABLE 94 NORTH AMERICA: NATURAL GAS POWER GENERATION MARKET, BY END-USE APPLICATION, 2021-2024 (USD MILLION)
- TABLE 95 NORTH AMERICA: NATURAL GAS POWER GENERATION MARKET, BY END-USE APPLICATION, 2025-2030 (USD MILLION)
- TABLE 96 NORTH AMERICA: NATURAL GAS POWER GENERATION MARKET, BY COUNTRY, 2021-2024 (USD MILLION)
- TABLE 97 NORTH AMERICA: NATURAL GAS POWER GENERATION MARKET, BY COUNTRY, 2025-2030 (USD MILLION)
- TABLE 98 US: NATURAL GAS POWER GENERATION MARKET, BY END-USE APPLICATION, 2021-2024 (USD MILLION)
- TABLE 99 US: NATURAL GAS POWER GENERATION MARKET, BY END-USE APPLICATION, 2025-2030 (USD MILLION)
- TABLE 100 CANADA: NATURAL GAS POWER GENERATION MARKET, BY END-USE APPLICATION, 2021-2024 (USD MILLION)
- TABLE 101 CANADA: NATURAL GAS POWER GENERATION MARKET, BY END-USE APPLICATION, 2025-2030 (USD MILLION)
- TABLE 102 MEXICO: NATURAL GAS POWER GENERATION MARKET, BY END-USE APPLICATION, 2021-2024 (USD MILLION)
- TABLE 103 MEXICO: NATURAL GAS POWER GENERATION MARKET, BY END-USE APPLICATION, 2025-2030 (USD MILLION)
- TABLE 104 SOUTH AMERICA: NATURAL GAS POWER GENERATION MARKET, BY TECHNOLOGY, 2021-2024 (USD MILLION)
- TABLE 105 SOUTH AMERICA: NATURAL GAS POWER GENERATION MARKET, BY TECHNOLOGY, 2025-2030 (USD MILLION)
- TABLE 106 SOUTH AMERICA: NATURAL GAS POWER GENERATION MARKET, BY POWER OUTPUT, 2021-2024 (USD MILLION)
- TABLE 107 SOUTH AMERICA: NATURAL GAS POWER GENERATION MARKET, BY POWER OUTPUT, 2025-2030 (USD MILLION)
- TABLE 108 SOUTH AMERICA: NATURAL GAS POWER GENERATION MARKET, BY FUEL SOURCE, 2021-2024 (USD MILLION)
- TABLE 109 SOUTH AMERICA: NATURAL GAS POWER GENERATION MARKET, BY APPLICATION, 2025-2030 (USD MILLION)
- TABLE 110 SOUTH AMERICA: NATURAL GAS POWER GENERATION MARKET, BY END-USE APPLICATION, 2021-2024 (USD MILLION)
- TABLE 111 SOUTH AMERICA: NATURAL GAS POWER GENERATION MARKET, BY END-USE APPLICATION, 2025-2030 (USD MILLION)
- TABLE 112 SOUTH AMERICA: NATURAL GAS POWER GENERATION MARKET, BY COUNTRY, 2021-2024 (USD MILLION)
- TABLE 113 SOUTH AMERICA: NATURAL GAS POWER GENERATION MARKET, BY COUNTRY, 2025-2030 (USD MILLION)
- TABLE 114 BRAZIL: NATURAL GAS POWER GENERATION MARKET, BY END-USE APPLICATION, 2021-2024 (USD MILLION)
- TABLE 115 BRAZIL: NATURAL GAS POWER GENERATION MARKET, BY END-USE APPLICATION, 2025-2030 (USD MILLION)
- TABLE 116 ARGENTINA: NATURAL GAS POWER GENERATION MARKET, BY END-USE APPLICATION, 2021-2024 (USD MILLION)
- TABLE 117 ARGENTINA: NATURAL GAS POWER GENERATION MARKET, BY END-USE APPLICATION, 2025-2030 (USD MILLION)
- TABLE 118 REST OF SOUTH AMERICA: NATURAL GAS POWER GENERATION MARKET, BY END-USE APPLICATION, 2021-2024 (USD MILLION)
- TABLE 119 REST OF SOUTH AMERICA: NATURAL GAS POWER GENERATION MARKET, BY END-USE APPLICATION, 2025-2030 (USD MILLION)
- TABLE 120 EUROPE: NATURAL GAS POWER GENERATION MARKET, BY TECHNOLOGY, 2021-2024 (USD MILLION)
- TABLE 121 EUROPE: NATURAL GAS POWER GENERATION MARKET, BY TECHNOLOGY, 2025-2030 (USD MILLION)
- TABLE 122 EUROPE: NATURAL GAS POWER GENERATION MARKET, BY POWER OUTPUT, 2021-2024 (USD MILLION)
- TABLE 123 EUROPE: NATURAL GAS POWER GENERATION MARKET, BY POWER OUTPUT, 2025-2030 (USD MILLION)
- TABLE 124 EUROPE: NATURAL GAS POWER GENERATION MARKET, BY FUEL SOURCE, 2021-2024 (USD MILLION)
- TABLE 125 EUROPE: NATURAL GAS POWER GENERATION MARKET, BY FUEL SOURCE, 2025-2030 (USD MILLION)
- TABLE 126 EUROPE: NATURAL GAS POWER GENERATION MARKET, BY END-USE APPLICATION, 2021-2024 (USD MILLION)
- TABLE 127 EUROPE: NATURAL GAS POWER GENERATION MARKET, BY END-USE APPLICATION, 2025-2030 (USD MILLION)
- TABLE 128 EUROPE: NATURAL GAS POWER GENERATION MARKET, BY COUNTRY, 2021-2024 (USD MILLION)
- TABLE 129 EUROPE: NATURAL GAS POWER GENERATION MARKET, BY COUNTRY, 2025-2030 (USD MILLION)
- TABLE 130 RUSSIA: NATURAL GAS POWER GENERATION MARKET, BY END-USE APPLICATION, 2021-2024 (USD MILLION)
- TABLE 131 RUSSIA: NATURAL GAS POWER GENERATION MARKET, BY END-USE APPLICATION, 2025-2030 (USD MILLION)
- TABLE 132 UK: NATURAL GAS POWER GENERATION MARKET, BY END-USE APPLICATION, 2021-2024 (USD MILLION)
- TABLE 133 UK: NATURAL GAS POWER GENERATION MARKET, BY END-USE APPLICATION, 2025-2030 (USD MILLION)
- TABLE 134 GERMANY: NATURAL GAS POWER GENERATION MARKET, BY END-USE APPLICATION, 2021-2024 (USD MILLION)
- TABLE 135 GERMANY: NATURAL GAS POWER GENERATION MARKET, BY END-USE APPLICATION, 2025-2030 (USD MILLION)
- TABLE 136 ITALY: NATURAL GAS POWER GENERATION MARKET, BY END-USE APPLICATION, 2021-2024 (USD MILLION)
- TABLE 137 ITALY: NATURAL GAS POWER GENERATION MARKET, BY END-USE APPLICATION, 2025-2030 (USD MILLION)
- TABLE 138 FRANCE: NATURAL GAS POWER GENERATION MARKET, BY END-USE APPLICATION, 2021-2024 (USD MILLION)
- TABLE 139 FRANCE: NATURAL GAS POWER GENERATION MARKET, BY END-USE APPLICATION, 2025-2030 (USD MILLION)
- TABLE 140 NATURAL GAS POWER GENERATION MARKET IN REST OF EUROPE, BY END-USE APPLICATION, 2021-2024 (USD MILLION)
- TABLE 141 NATURAL GAS POWER GENERATION MARKET IN REST OF EUROPE, BY END-USE APPLICATION, 2025-2030 (USD MILLION)
- TABLE 142 MIDDLE EAST & AFRICA: NATURAL GAS POWER GENERATION MARKET, BY TECHNOLOGY, 2021-2024 (USD MILLION)
- TABLE 143 MIDDLE EAST & AFRICA: NATURAL GAS POWER GENERATION MARKET, BY TECHNOLOGY, 2025-2030 (USD MILLION)
- TABLE 144 MIDDLE EAST & AFRICA: NATURAL GAS POWER GENERATION MARKET, BY POWER OUTPUT, 2021-2024 (USD MILLION)
- TABLE 145 MIDDLE EAST & AFRICA: NATURAL GAS POWER GENERATION MARKET, BY POWER OUTPUT, 2025-2030 (USD MILLION)
- TABLE 146 MIDDLE EAST & AFRICA: NATURAL GAS POWER GENERATION MARKET, BY FUEL SOURCE, 2021-2024 (USD MILLION)
- TABLE 147 MIDDLE EAST & AFRICA: NATURAL GAS POWER GENERATION MARKET, BY FUEL SOURCE, 2025-2030 (USD MILLION)
- TABLE 148 MIDDLE EAST & AFRICA: NATURAL GAS POWER GENERATION MARKET, BY END-USE APPLICATION, 2021-2024 (USD MILLION)
- TABLE 149 MIDDLE EAST & AFRICA: NATURAL GAS POWER GENERATION MARKET, BY END-USE APPLICATION, 2025-2030 (USD MILLION)
- TABLE 150 MIDDLE EAST & AFRICA: NATURAL GAS POWER GENERATION MARKET, BY COUNTRY, 2021-2024 (USD MILLION)
- TABLE 151 MIDDLE EAST & AFRICA: NATURAL GAS POWER GENERATION MARKET, BY COUNTRY, 2025-2030 (USD MILLION)
- TABLE 152 GCC: NATURAL GAS POWER GENERATION MARKET, BY COUNTRY, 2021-2024 (USD MILLION)
- TABLE 153 GCC: NATURAL GAS POWER GENERATION MARKET, BY COUNTRY, 2025-2030 (USD MILLION)
- TABLE 154 SAUDI ARABIA: NATURAL GAS POWER GENERATION MARKET, BY END-USE APPLICATION, 2021-2024 (USD MILLION)
- TABLE 155 SAUDI ARABIA: NATURAL GAS POWER GENERATION MARKET, BY END-USE APPLICATION, 2025-2030 (USD MILLION)
- TABLE 156 UAE: NATURAL GAS POWER GENERATION MARKET, BY END-USE APPLICATION, 2021-2024 (USD MILLION)
- TABLE 157 UAE: NATURAL GAS POWER GENERATION MARKET, BY END-USE APPLICATION, 2025-2030 (USD MILLION)
- TABLE 158 REST OF GCC: NATURAL GAS POWER GENERATION MARKET, BY END-USE APPLICATION, 2021-2024 (USD MILLION)
- TABLE 159 REST OF GCC: NATURAL GAS POWER GENERATION MARKET, BY END-USE APPLICATION, 2025-2030 (USD MILLION)
- TABLE 160 IRAN: NATURAL GAS POWER GENERATION MARKET, BY END-USE APPLICATION, 2021-2024 (USD MILLION)
- TABLE 161 IRAN: NATURAL GAS POWER GENERATION MARKET, BY END-USE APPLICATION, 2025-2030 (USD MILLION)
- TABLE 162 ALGERIA: NATURAL GAS POWER GENERATION MARKET, BY END-USE APPLICATION, 2021-2024 (USD MILLION)
- TABLE 163 NATURAL GAS POWER GENERATION MARKET IN ALGERIA, BY END-USE APPLICATION, 2025-2030 (USD MILLION)
- TABLE 164 NIGERIA: NATURAL GAS POWER GENERATION MARKET, BY END-USE APPLICATION, 2021-2024 (USD MILLION)
- TABLE 165 NATURAL GAS POWER GENERATION MARKET IN NIGERIA, BY END-USE APPLICATION, 2025-2030 (USD MILLION)
- TABLE 166 REST OF MIDDLE EAST & AFRICA: NATURAL GAS POWER GENERATION MARKET, BY END-USE APPLICATION, 2021-2024 (USD MILLION)
- TABLE 167 REST OF MIDDLE EAST & AFRICA: NATURAL GAS POWER GENERATION MARKET, BY END-USE APPLICATION, 2025-2030 (USD MILLION)
- TABLE 168 NATURAL GAS POWER GENERATION MARKET: OVERVIEW OF STRATEGIES ADOPTED BY KEY PLAYERS, JANUARY 2021-SEPTEMBER 2025
- TABLE 169 NATURAL GAS POWER GENERATION MARKET: DEGREE OF COMPETITION, 2024
- TABLE 170 NATURAL GAS POWER GENERATION MARKET: REGION FOOTPRINT
- TABLE 171 NATURAL GAS POWER GENERATION MARKET: END-USE APPLICATION FOOTPRINT
- TABLE 172 NATURAL GAS POWER GENERATION MARKET: TECHNOLOGY FOOTPRINT
- TABLE 173 NATURAL GAS POWER GENERATION MARKET: FUEL SOURCE FOOTPRINT
- TABLE 174 NATURAL GAS POWER GENERATION MARKET: DETAILED LIST OF KEY STARTUPS/SMES
- TABLE 175 NATURAL GAS POWER GENERATION MARKET: COMPETITIVE BENCHMARKING OF KEY STARTUPS/SMES
- TABLE 176 NATURAL GAS POWER GENERATION MARKET: DEALS, JANUARY 2021-SEPTEMBER 2025
- TABLE 177 NATURAL GAS POWER GENERATION MARKET: OTHER DEVELOPMENTS, JANUARY 2021-SEPTEMBER 2025
- TABLE 178 GE VERNOVA: COMPANY OVERVIEW
- TABLE 179 GE VERNOVA: PRODUCTS/SOLUTIONS/SERVICES OFFERED
- TABLE 180 GE VERNOVA: DEALS
- TABLE 181 GE VERNOVA: OTHER DEVELOPMENTS
- TABLE 182 SIEMENS ENERGY: COMPANY OVERVIEW
- TABLE 183 SIEMENS ENERGY: PRODUCTS/SOLUTIONS/SERVICES OFFERED
- TABLE 184 SIEMENS ENERGY: DEVELOPMENTS
- TABLE 185 MITSUBISHI HEAVY INDUSTRIES, LTD.: COMPANY OVERVIEW
- TABLE 186 MITSUBISHI HEAVY INDUSTRIES, LTD.: PRODUCTS/SOLUTIONS/ SERVICES OFFERED
- TABLE 187 MITSUBISHI HEAVY INDUSTRIES, LTD.: DEVELOPMENTS
- TABLE 188 WARTSILA: COMPANY OVERVIEW
- TABLE 189 WARTSILA: PRODUCTS/SOLUTIONS/SERVICES OFFERED
- TABLE 190 WARTSILA: DEVELOPMENTS
- TABLE 191 ANSALDO ENERGIA: COMPANY OVERVIEW
- TABLE 192 ANSALDO ENERGIA: PRODUCTS/SOLUTIONS/SERVICES OFFERED
- TABLE 193 ANSALDO ENERGIA: DEVELOPMENTS
- TABLE 194 TECOGEN, INC.: COMPANY OVERVIEW
- TABLE 195 TECOGEN, INC.: PRODUCTS/SOLUTIONS/SERVICES OFFERED
- TABLE 196 TECOGEN, INC.: DEALS
- TABLE 197 TECOGEN, INC.: OTHER DEVELOPMENTS
- TABLE 198 DESTINUS ENERGY: COMPANY OVERVIEW
- TABLE 199 DESTINUS ENERGY: PRODUCTS/SOLUTIONS/SERVICES OFFERED
- TABLE 200 DESTINUS ENERGY: DEALS
- TABLE 201 BECHTEL CORPORATION: COMPANY OVERVIEW
- TABLE 202 BECHTEL CORPORATION: PRODUCTS/SOLUTIONS/SERVICES OFFERED
- TABLE 203 BECHTEL CORPORATION: DEVELOPMENTS
- TABLE 204 FLUOR CORPORATION: COMPANY OVERVIEW
- TABLE 205 FLUOR CORPORATION: PRODUCTS/SOLUTIONS/SERVICES OFFERED
- TABLE 206 FLUOR CORPORATION: DEVELOPMENTS
- TABLE 207 WORLEY: COMPANY OVERVIEW
- TABLE 208 WORLEY: PRODUCTS/SOLUTIONS/SERVICES OFFERED
- TABLE 209 WORLEY: DEVELOPMENTS
- TABLE 210 CATERPILLAR: COMPANY OVERVIEW
- TABLE 211 CATERPILLAR: PRODUCTS/SOLUTIONS/SERVICES OFFERED
- TABLE 212 MCDERMOTT: COMPANY OVERVIEW
- TABLE 213 MCDERMOTT: PRODUCTS/SOLUTIONS/SERVICES OFFERED
- TABLE 214 CLARKE ENERGY: COMPANY OVERVIEW
- TABLE 215 CLARKE ENERGY: PRODUCTS/SOLUTIONS/SERVICES OFFERED
- TABLE 216 BURNS & MCDONNELL: COMPANY OVERVIEW
- TABLE 217 BURNS & MCDONNELL: PRODUCTS/SOLUTIONS/SERVICES OFFERED
- TABLE 218 CALPINE: COMPANY OVERVIEW
- TABLE 219 CALPINE: PRODUCTS/SOLUTIONS/SERVICES OFFERED
- TABLE 220 CAPSTONE GREEN ENERGY HOLDINGS, INC.: COMPANY OVERVIEW
- TABLE 221 NAUTIX: COMPANY OVERVIEW
- TABLE 222 2G ENERGY: COMPANY OVERVIEW
- TABLE 223 BOSCH INDUSTRIEKESSEL GMBH: COMPANY OVERVIEW
- TABLE 224 LARSEN & TOUBRO LIMITED: COMPANY OVERVIEW
- TABLE 225 BHARAT HEAVY ELECTRICALS LIMITED: COMPANY OVERVIEW
- TABLE 226 KAWASAKI HEAVY INDUSTRIES, LTD.: COMPANY OVERVIEW
- TABLE 227 SULZER LTD: COMPANY OVERVIEW
- TABLE 228 ALINTA ENERGY: COMPANY OVERVIEW
- TABLE 229 LATVENERGO AS: COMPANY OVERVIEW
- TABLE 230 GEORGIA POWER - SOUTHERN COMPANY: COMPANY OVERVIEW
List of Figures
- FIGURE 1 NATURAL GAS POWER GENERATION MARKET SEGMENTATION AND REGIONAL SCOPE
- FIGURE 2 DURATION CONSIDERED
- FIGURE 3 NATURAL GAS POWER GENERATION MARKET: RESEARCH DESIGN
- FIGURE 4 KEY METRICS CONSIDERED TO ANALYZE DEMAND FOR NATURAL GAS POWER GENERATION
- FIGURE 5 NATURAL GAS POWER GENERATION MARKET: BOTTOM-UP APPROACH
- FIGURE 6 NATURAL GAS POWER GENERATION MARKET SIZE ESTIMATION: TOP-DOWN APPROACH
- FIGURE 7 KEY STEPS CONSIDERED FOR ASSESSING SUPPLY OF NATURAL GAS POWER GENERATION
- FIGURE 8 NATURAL GAS POWER GENERATION MARKET: SUPPLY-SIDE ANALYSIS
- FIGURE 9 DATA TRIANGULATION
- FIGURE 10 COMBINED CYCLE TO HOLD LARGEST MARKET SHARE IN 2025
- FIGURE 11 LIQUEFIED NATURAL GAS TO RECORD HIGHER CAGR DURING FORECAST PERIOD
- FIGURE 12 501-1,000 MW SEGMENT TO DOMINATE MARKET IN 2025
- FIGURE 13 POWER UTILITIES TO ACCOUNT FOR LARGEST MARKET SHARE IN 2030
- FIGURE 14 ASIA PACIFIC CAPTURED LARGEST MARKET SHARE IN 2024
- FIGURE 15 FAVORABLE GOVERNMENT POLICIES AND REGULATIONS PROMOTING CLEANER ENERGY TO DRIVE NATURAL GAS POWER GENERATION MARKET
- FIGURE 16 ASIA PACIFIC TO RECORD HIGHEST CAGR DURING FORECAST PERIOD
- FIGURE 17 COMBINED CYCLE SEGMENT TO HOLD LARGEST MARKET SHARE IN 2030
- FIGURE 18 PIPELINE NATURAL GAS TO ACCOUNT FOR LARGER MARKET SHARE IN 2030
- FIGURE 19 501-1,000 MW SEGMENT TO CAPTURE LARGEST MARKET SHARE IN 2030
- FIGURE 20 POWER UTILITIES SEGMENT TO ACCOUNT FOR LARGEST MARKET SHARE IN 2030
- FIGURE 21 PIPELINE NATURAL GAS SEGMENT AND CHINA HELD LARGEST SHARES OF ASIA PACIFIC NATURAL GAS POWER GENERATION MARKET IN 2024
- FIGURE 22 DRIVERS, RESTRAINTS, OPPORTUNITIES, AND CHALLENGES
- FIGURE 23 NATURAL GAS CONSUMPTION, BY REGION, 2014-2024
- FIGURE 24 NATURAL GAS CONSUMPTION IN US, 2020-2024
- FIGURE 25 TRENDS/DISRUPTIONS IMPACTING CUSTOMER BUSINESS
- FIGURE 26 NATURAL GAS POWER GENERATION SUPPLY CHAIN ANALYSIS
- FIGURE 27 NATURAL GAS POWER GENERATION ECOSYSTEM ANALYSIS
- FIGURE 28 PATENTS APPLIED AND GRANTED, 2015-2024
- FIGURE 29 AVERAGE CAPITAL EXPENDITURE ON NATURAL GAS POWER GENERATION, BY REGION, 2022-2024
- FIGURE 30 IMPORT DATA FOR HS CODE 8411-COMPLIANT PRODUCTS, 2020-2024
- FIGURE 31 EXPORT DATA FOR HS CODE 8411-COMPLIANT PRODUCTS, 2020-2024
- FIGURE 32 PORTER'S FIVE FORCES ANALYSIS
- FIGURE 33 INFLUENCE OF KEY STAKEHOLDERS ON BUYING PROCESS FOR TOP END-USE APPLICATIONS
- FIGURE 34 KEY BUYING CRITERIA FOR TOP END-USE APPLICATIONS
- FIGURE 35 INVESTMENT AND FUNDING SCENARIO, 2020-2024
- FIGURE 36 IMPACT OF AI/GEN AI ON NATURAL GAS POWER GENERATION SUPPLY CHAIN, BY REGION
- FIGURE 37 NATURAL GAS POWER GENERATION MARKET SHARE, BY TECHNOLOGY, 2024
- FIGURE 38 NATURAL GAS POWER GENERATION MARKET SHARE, BY FUEL SOURCE, 2024
- FIGURE 39 NATURAL GAS POWER GENERATION MARKET SHARE, BY POWER OUTPUT, 2024
- FIGURE 40 NATURAL GAS POWER GENERATION MARKET SHARE, BY END-USE APPLICATION, 2024
- FIGURE 41 ASIA PACIFIC TO BE FASTEST-GROWING REGION DURING FORECAST PERIOD
- FIGURE 42 ASIA PACIFIC: NATURAL GAS POWER GENERATION MARKET SNAPSHOT
- FIGURE 43 MIDDLE EAST & AFRICA: NATURAL GAS POWER GENERATION MARKET SNAPSHOT
- FIGURE 44 MARKET SHARE ANALYSIS OF COMPANIES OFFERING NATURAL GAS POWER GENERATION SOLUTIONS, 2024
- FIGURE 45 NATURAL GAS POWER GENERATION MARKET: REVENUE ANALYSIS OF TOP FIVE PLAYERS, 2020-2024
- FIGURE 46 COMPANY VALUATION
- FIGURE 47 FINANCIAL METRICS (EV/EBITDA)
- FIGURE 48 BRAND COMPARISON
- FIGURE 49 NATURAL GAS POWER GENERATION MARKET: COMPANY EVALUATION MATRIX (KEY PLAYERS), 2024
- FIGURE 50 NATURAL GAS POWER GENERATION MARKET: COMPANY FOOTPRINT
- FIGURE 51 NATURAL GAS POWER GENERATION MARKET: COMPANY EVALUATION MATRIX (STARTUPS/SMES), 2024
- FIGURE 52 GE VERNOVA: COMPANY SNAPSHOT
- FIGURE 53 SIEMENS ENERGY: COMPANY SNAPSHOT
- FIGURE 54 MITSUBISHI HEAVY INDUSTRIES, LTD.: COMPANY SNAPSHOT
- FIGURE 55 WARTSILA: COMPANY SNAPSHOT
- FIGURE 56 TECOGEN, INC.: COMPANY SNAPSHOT
- FIGURE 57 FLUOR CORPORATION: COMPANY SNAPSHOT
- FIGURE 58 WORLEY: COMPANY SNAPSHOT
- FIGURE 59 CATERPILLAR: COMPANY SNAPSHOT
 氨發電市場預測至2034年-按氨類型、電廠類型、技術、應用、最終用戶和地區分類的全球分析
 發電市場規模、佔有率、成長及全球產業分析:按類型、應用和地區分類,並預測至2026-2034年
 2026年全球發電市場報告
 住宅發電市場-全球產業規模、佔有率、趨勢、機會及預測(按類型、技術、功率輸出、應用、分銷管道、地區和競爭格局分類,2021-2031年)商業發電市場-全球產業規模、佔有率、趨勢、機會及預測(按類型、動力來源、電網、地區和競爭格局分類,2021-2031年)工業發電市場-全球產業規模、佔有率、趨勢、機會及預測(按類型、來源、最終用戶、地區和競爭格局分類,2021-2031年)發電市場-全球產業規模、佔有率、趨勢、機會和預測,按類型、最終用戶、能源、電網、地區和競爭格局分類,2021-2031年預測
 發電市場規模、佔有率和成長分析(按類型、最終用戶、能源、電網和地區分類)-2026-2033年產業預測2025年最值得關注的20家全球發電公司
 潮汐發電市場機會、成長促進因素、產業趨勢分析及預測(2025-2034年)