

 |
市場調查報告書
商品編碼
1782110
線上旅行社市場機會、成長動力、產業趨勢分析及 2025 - 2034 年預測Online Travel Agency Market Opportunity, Growth Drivers, Industry Trend Analysis, and Forecast 2025 - 2034 |
||||||
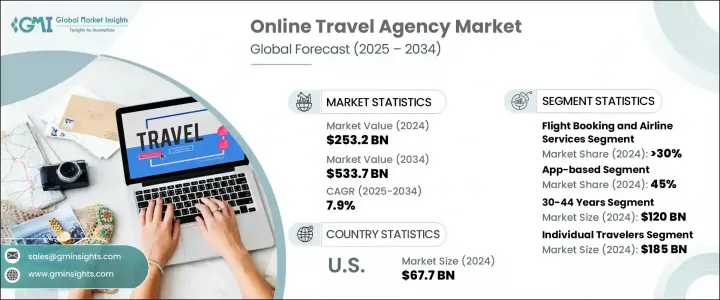
2024年,全球線上旅行社市場規模達2,532億美元,預計到2034年將以7.9%的複合年成長率成長,達到5,337億美元。這一強勁勢頭主要得益於網際網路普及率的提高、智慧型手機的廣泛使用,以及旅行者行為的轉變,他們更青睞便捷的數位化優先預訂體驗。多年來,線上旅行社透過為使用者提供單一平台,直接存取包括航班、住宿、租車和旅遊體驗在內的各種旅遊服務,徹底改變了傳統的旅遊規劃流程。
隨著消費者期望的不斷演變,旅客如今需要無縫銜接、快速且靈活的自助服務。全球流動性的不斷增強,加上各地區用戶數位化程度的不斷提升,進一步加速了線上旅遊服務的普及。可支配收入的成長、對個人化旅行體驗的更多關注,以及年輕一代對探索新目的地的興趣日益濃厚,也促進了該行業的強勁成長。數位化互動已成為人們旅行方式的核心支柱,這為持續投資於用戶體驗、在地化和客戶保留策略的OTA供應商帶來了更廣泛的市場機會。
| 市場範圍 | |
|---|---|
| 起始年份 | 2024 |
| 預測年份 | 2025-2034 |
| 起始值 | 2532億美元 |
| 預測值 | 5337億美元 |
| 複合年成長率 | 7.9% |
在服務類別中,航班預訂和航空公司服務佔2024年OTA市場總額的30%以上,創造了超過800億美元的收入。這些服務仍然是OTA流量的主要動力,因為旅客通常從航班開始預訂旅程。隨著全球航空公司拓展國內和國際航線,越來越多的用戶轉向數位平台比較價格、即時查看航班時刻表並獲取促銷票價。 OTA透過提供靈活的搜尋選項、即時票價更新和客製化票價套餐等智慧工具,持續最佳化航班預訂體驗。包括新興分銷標準實施在內的最新進展,使平台能夠展示豐富的內容,例如座位佈局、額外服務選項和個人化優惠,最終提升客戶參與度並增加轉換率。
根據預訂模式,市場可細分為基於應用程式、基於網路、語音和對話式預訂以及社交媒體和新興管道。基於應用程式的細分市場在 2024 年佔據 45% 的市場佔有率,佔據主導地位,預計 2025 年至 2034 年的複合年成長率為 8.5%。全球超過 70 億人使用智慧型手機,對智慧型手機的依賴日益加深,行動應用程式已成為旅遊計畫的首選介面。旅行者擴大使用應用程式,不僅預訂航班和酒店,還管理行程變更、接收即時更新和解鎖獨家優惠。行動平台提供額外的功能,例如基於位置的通知、離線存取預訂和客製化的忠誠度計劃,使其比傳統的基於網路的平台更具吸引力。這種個人化的參與在推動重複使用和客戶滿意度方面發揮了關鍵作用。
從終端用戶來看,OTA市場分為個人旅客和商務旅客。 2024年,個人旅行者佔據主導地位,為市場貢獻了約1850億美元的收入。靈活性、透明度和可自訂選項繼續吸引這一群體,尤其是在後疫情時代,單人旅行、工作休閒融合的長假以及即興出遊等趨勢日益盛行。消費者越來越青睞數位化工具,這些工具使他們能夠根據自己的意願規劃行程、進行即時預訂、查看同行點評,並接收人工智慧產生的旅遊建議。 OTA正利用這一趨勢,提供動態打包、個人化促銷和互動式介面,從而簡化旅行規劃體驗。
從地區來看,美國在2024年佔據了北美OTA市場75%以上的佔有率,創造了677億美元的收入。較高的數位素養、廣泛的網路存取以及強勁的電子商務應用,使美國成為線上旅遊預訂的領先市場。美國在旅遊服務領域率先採用新興技術,樹立了全球標竿。預測定價、人工智慧行程規劃器和多平台整合等先進功能正在不斷推出,以滿足精通科技的旅客的期望。
OTA 供應商也在透過策略性技術投資、新創公司收購以及與旅遊服務提供者的合作來完善其數位生態系統。語音預訂、智慧聊天機器人和即時動態定價引擎等創新技術正成為提升客戶旅程體驗的標準配置。該行業也在響應日益成長的永續旅行需求,整合環保住宿、低排放交通和文化沉浸式體驗的推薦。這些改進,加上在資料安全、行程個人化和綜合旅遊套餐方面的持續努力,正在重塑人們透過線上平台預訂和體驗旅行的方式。
目錄
第1章:方法論與範圍
第2章:執行摘要
第3章:行業洞察
- 產業生態系統分析
- 供應商概況
- 利潤率
- 成本結構
- 每個階段的增值
- 影響價值鏈的因素
- 中斷
- 分銷通路和行銷策略
- 產業衝擊力
- 成長動力
- 自助遊的偏好日益成長
- 可支配所得和旅遊支出增加
- 網路和智慧型手機普及率不斷上升
- 預訂平台和服務的技術進步
- 產業陷阱與挑戰
- 資料隱私和安全問題
- 複雜的預訂和取消政策
- 市場機會
- 個性化和人工智慧驅動的旅行解決方案興起
- 新興市場的擴張
- 成長動力
- 成長潛力分析
- 監管格局
- 北美洲
- 歐洲
- 亞太地區
- 拉丁美洲
- 中東和非洲
- 波特的分析
- PESTEL分析
- 技術和創新格局
- 當前技術趨勢
- 新興技術
- 永續性和負責任的旅行
- 永續旅遊平台開發
- 碳足跡追蹤和抵消
- 航班碳排放計算器整合
- 碳補償計劃合作夥伴關係
- 永續的交通選擇
- 綠色旅遊建議
- 環保住宿推廣
- 綠色認證過濾
- 永續的酒店合作夥伴關係
- 節能物業推廣
- 本地和負責任的旅遊
- 永續旅遊內容與教育
- 負責任的旅遊指南
- 環境影響意識
- 當地社區支持計劃
- 野生動物和保育旅遊
- 碳足跡追蹤和抵消
- 企業社會責任(CSR)
- 環境永續性舉措
- 碳中和營運
- 再生能源的使用
- 減少廢棄物計劃
- 永續的辦公室實踐
- 社會影響力與社區發展
- 當地社區支持計劃
- 教育和技能發展
- 多元化和包容性舉措
- 慈善捐贈和志願服務
- 道德商業行為
- 公平勞動實踐
- 供應商行為準則
- 反腐敗政策
- 透明的報告標準
- 環境永續性舉措
- 永續旅遊平台開發
- 專利分析
- 用例
第4章:競爭格局
- 介紹
- 公司市佔率分析
- 北美洲
- 歐洲
- 亞太地區
- 拉丁美洲
- 中東和非洲
- 競爭定位矩陣
- 戰略展望矩陣
- 關鍵進展
- 併購
- 夥伴關係與合作
- 新產品發布
- 擴張計劃和資金
第5章:市場估計與預測:按服務,2021 - 2034 年
- 主要趨勢
- 住宿預訂服務
- 飯店預訂平台
- 另類住宿平台
- 長期住宿和公司住房
- 航班預訂和航空服務
- 國內航班預訂
- 國際航班預訂
- 輔助服務及附加服務
- 地面交通和汽車租賃
- 汽車租賃服務
- 替代交通
- 多式聯運
- 活動、體驗和旅遊
- 旅遊和觀光
- 娛樂和活動
- 美食和餐飲體驗
- 旅行套餐和組合
- 航班和酒店套餐
- 全包度假套餐
- 客製化和個人化包裝
第6章:市場估計與預測:以預訂方式,2021 年至 2034 年
- 主要趨勢
- 基於應用程式
- 基於網路
- 語音和對話預訂
- 社群媒體和新興管道
第7章:市場估計與預測:依年齡段,2021 - 2034 年
- 主要趨勢
- 最長 29 年
- 30至44歲
- 45至59歲
- 60歲以上
第8章:市場估計與預測:按旅行者分類,2021 年至 2034 年
- 主要趨勢
- 休閒旅客
- 商務旅客
- 娛樂、體育和活動旅行者
- 教育旅行者
- 其他
第9章:市場估計與預測:依商業模式,2021 - 2034 年
- 主要趨勢
- 基於佣金的模式
- 商家模式
- 廣告和行銷收入
- 訂閱和會員模式
第10章:市場估計與預測:依最終用途,2021 - 2034 年
- 主要趨勢
- 個人旅行者
- 商務旅客
第 11 章:市場估計與預測:按地區,2021 年至 2034 年
- 北美洲
- 美國
- 加拿大
- 歐洲
- 英國
- 德國
- 法國
- 義大利
- 西班牙
- 俄羅斯
- 北歐人
- 亞太地區
- 中國
- 印度
- 日本
- 韓國
- 澳洲
- 東南亞
- 拉丁美洲
- 巴西
- 墨西哥
- 阿根廷
- 智利
- MEA
- 南非
- 沙烏地阿拉伯
- 阿拉伯聯合大公國
第12章:公司簡介
- Agoda Company
- Airbnb
- Almosafer
- Booking Holding
- Cleartrip
- Despegar.com
- eDreams ODIGEO
- Expedia
- Hays Travel
- Lastminute.com Group
- MakeMyTrip
- Rakuten Travel
- Skyscanner
- Tongcheng Travel Holdings
- Traveloka
- Trip.com Group
- Tripadvisor
- Trivago NV
- Webjet
- Yatra Online
The Global Online Travel Agency Market was valued at USD 253.2 billion in 2024 and is estimated to grow at a CAGR of 7.9% to reach USD 533.7 billion by 2034. This strong momentum is primarily fueled by growing internet penetration, the widespread use of smartphones, and a shift in traveler behavior favoring convenient, digital-first booking experiences. Over the years, OTAs have transformed the traditional travel planning process by offering users direct access to a wide range of travel services-including flights, accommodations, car rentals, and tour experiences-all from a single platform.
As consumer expectations continue to evolve, travelers now demand seamless, self-service options that are both fast and flexible. Increasing global mobility, paired with the digital maturity of users across regions, has further accelerated the adoption of online travel services. The rise in discretionary income, greater focus on personalized travel experiences, and the growing interest among younger demographics in exploring new destinations also contribute to the robust growth of this sector. Digital engagement has become a central pillar in how people approach travel, leading to broader market opportunities for OTA providers who continue to invest in user experience, localization, and customer retention strategies.
| Market Scope | |
|---|---|
| Start Year | 2024 |
| Forecast Year | 2025-2034 |
| Start Value | $253.2 Billion |
| Forecast Value | $533.7 Billion |
| CAGR | 7.9% |
Among the service categories, flight booking and airline services accounted for more than 30% of the total OTA market in 2024, generating over USD 80 billion in revenue. These services remain a primary driver of OTA traffic as travelers often begin their booking journey with flights. With global airlines expanding their domestic and international routes, users are increasingly turning to digital platforms to compare prices, view schedules in real-time, and access promotional fares. OTAs continue to optimize the flight booking experience by offering smart tools like flexible search options, real-time fare updates, and customized fare bundles. Recent advancements, including the implementation of emerging distribution standards, have allowed platforms to showcase rich content like seat layouts, extra service options, and personalized deals, which ultimately improve customer engagement and increase conversions.
The market is segmented by booking mode into app-based, web-based, voice and conversational booking, and social media and emerging channels. The app-based segment led the market with a 45% share in 2024 and is forecast to grow at a CAGR of 8.5% from 2025 to 2034. The growing reliance on smartphones-used by over 7 billion people globally-has made mobile apps the go-to interface for trip planning. Travelers are increasingly using apps not just to book flights and hotels but also to manage itinerary changes, receive real-time updates, and unlock exclusive offers. Mobile platforms offer additional functionality such as location-based notifications, offline access to bookings, and customized loyalty programs, making them more appealing than traditional web-based platforms. This personalized engagement has played a critical role in driving repeat usage and customer satisfaction.
In terms of end use, the OTA market is divided into individual and corporate travelers. Individual travelers were the dominant segment in 2024, contributing approximately USD 185 billion to the market. Flexibility, transparency, and customizable options continue to attract this segment, particularly in a post-pandemic world where trends like solo travel, extended vacations blending work and leisure, and spontaneous getaways have become more common. Consumers increasingly prefer digital tools that allow them to plan trips on their own terms, access instant bookings, view peer reviews, and receive AI-generated travel suggestions. OTAs are capitalizing on this trend by offering dynamic packaging, personalized promotions, and interactive interfaces that simplify the travel planning experience.
Regionally, the United States held over 75% of the North American OTA market in 2024, generating USD 67.7 billion in revenue. High digital literacy, widespread internet access, and strong e-commerce adoption make the US a leading market for online travel booking. The country's early embrace of emerging technologies in travel services has set a global benchmark. Advanced features such as predictive pricing, AI trip planners, and multi-platform integration are being continuously rolled out to meet the expectations of tech-savvy travelers.
OTA providers are also refining their digital ecosystems through strategic technology investments, startup acquisitions, and partnerships with travel service providers. Innovations such as voice-activated booking, intelligent chatbots, and real-time dynamic pricing engines are becoming standard offerings to enhance customer journeys. The industry is also responding to the increasing demand for sustainable travel options, integrating recommendations for eco-conscious accommodations, low-emission transportation, and cultural immersion experiences. These enhancements, combined with ongoing efforts in data security, trip personalization, and integrated travel packages, are reshaping how people book and experience travel through online platforms.
Table of Contents
Chapter 1 Methodology & Scope
- 1.1 Market scope and definition
- 1.2 Research design
- 1.2.1 Research approach
- 1.2.2 Data collection methods
- 1.3 Data mining sources
- 1.3.1 Global
- 1.3.2 Regional/Country
- 1.4 Base estimates and calculations
- 1.4.1 Base year calculation
- 1.4.2 Key trends for market estimation
- 1.5 Primary research and validation
- 1.5.1 Primary sources
- 1.6 Forecast model
- 1.7 Research assumptions and limitations
Chapter 2 Executive Summary
- 2.1 Industry synopsis, 2021 - 2034
- 2.2 Key market trends
- 2.2.1 Regional
- 2.2.2 Service
- 2.2.3 Mode of booking
- 2.2.4 Age group
- 2.2.5 Traveler
- 2.2.6 Business model
- 2.2.7 End use
- 2.3 TAM Analysis, 2025-2034
- 2.4 CXO perspectives: Strategic imperatives
- 2.4.1 Key decision points for industry executives
- 2.4.2 Critical success factors for market players
- 2.5 Future outlook and strategic recommendations
Chapter 3 Industry Insights
- 3.1 Industry ecosystem analysis
- 3.1.1 Supplier Landscape
- 3.1.2 Profit Margin
- 3.1.3 Cost structure
- 3.1.4 Value addition at each stage
- 3.1.5 Factor affecting the value chain
- 3.1.6 Disruptions
- 3.1.7 Distribution channels and marketing strategies
- 3.2 Industry impact forces
- 3.2.1 Growth drivers
- 3.2.1.1 Growing preference for self-travel
- 3.2.1.2 Increased disposable income and travel spending
- 3.2.1.3 Rising internet and smartphone penetration
- 3.2.1.4 Technological advancements in booking platforms and services
- 3.2.2 Industry pitfalls and challenges
- 3.2.2.1 Data privacy and security concerns
- 3.2.2.2 Complex booking and cancellation policies
- 3.2.3 Market opportunities
- 3.2.3.1 Rise in personalized and AI-driven travel solutions
- 3.2.3.2 Expansion in emerging markets
- 3.2.1 Growth drivers
- 3.3 Growth potential analysis
- 3.4 Regulatory landscape
- 3.4.1 North America
- 3.4.2 Europe
- 3.4.3 Asia Pacific
- 3.4.4 Latin America
- 3.4.5 Middle East & Africa
- 3.5 Porter’s analysis
- 3.6 PESTEL analysis
- 3.7 Technology and innovation landscape
- 3.7.1 Current technologies trends
- 3.7.2 Emerging technologies
- 3.8 Sustainability and responsible travel
- 3.8.1 Sustainable travel platform development
- 3.8.1.1 Carbon footprint tracking and offsetting
- 3.8.1.1.1 Flight carbon calculator integration
- 3.8.1.1.2 Carbon offset program partnerships
- 3.8.1.1.3 Sustainable transportation options
- 3.8.1.1.4 Green travel recommendations
- 3.8.1.2 Eco-friendly accommodation promotion
- 3.8.1.2.1 Green certification filtering
- 3.8.1.2.2 Sustainable hotel partnerships
- 3.8.1.2.3 Energy-efficient property promotion
- 3.8.1.2.4 Local and responsible tourism
- 3.8.1.3 Sustainable travel content and education
- 3.8.1.3.1 Responsible travel guides
- 3.8.1.3.2 Environmental impact awareness
- 3.8.1.3.3 Local community support programs
- 3.8.1.3.4 Wildlife and conservation tourism
- 3.8.1.1 Carbon footprint tracking and offsetting
- 3.8.2 Corporate social responsibility (CSR)
- 3.8.2.1 Environmental sustainability initiatives
- 3.8.2.1.1 Carbon neutral operations
- 3.8.2.1.2 Renewable energy usage
- 3.8.2.1.3 Waste reduction programs
- 3.8.2.1.4 Sustainable office practices
- 3.8.2.2 Social impact and community development
- 3.8.2.2.1 Local community support programs
- 3.8.2.2.2 Education and skill development
- 3.8.2.2.3 Diversity and inclusion initiatives
- 3.8.2.2.4 Charitable giving and volunteering
- 3.8.2.3 Ethical business practices
- 3.8.2.3.1 Fair labor practices
- 3.8.2.3.2 Supplier code of conduct
- 3.8.2.3.3 Anti-corruption policies
- 3.8.2.3.4 Transparent reporting standards
- 3.8.2.1 Environmental sustainability initiatives
- 3.8.1 Sustainable travel platform development
- 3.9 Patent analysis
- 3.10 Use cases
Chapter 4 Competitive Landscape, 2024
- 4.1 Introduction
- 4.2 Company market share analysis
- 4.2.1 North America
- 4.2.2 Europe
- 4.2.3 Asia Pacific
- 4.2.4 Latin America
- 4.2.5 Middle East & Africa
- 4.3 Competitive positioning matrix
- 4.4 Strategic outlook matrix
- 4.5 Key developments
- 4.5.1 Mergers & acquisitions
- 4.5.2 Partnerships & collaborations
- 4.5.3 New Product Launches
- 4.5.4 Expansion Plans and funding
Chapter 5 Market Estimates & Forecast, By Service, 2021 - 2034 ($Bn)
- 5.1 Key trends
- 5.2 Accommodation booking services
- 5.2.1 Hotel booking platforms
- 5.2.2 Alternative accommodation platforms
- 5.2.3 Extended stay and corporate housing
- 5.3 Flight booking and airline services
- 5.3.1 Domestic flight booking
- 5.3.2 International flight booking
- 5.3.3 Ancillary services and add-ons
- 5.4 Ground transportation and car rental
- 5.4.1 Car rental services
- 5.4.2 Alternative transportation
- 5.4.3 Multi modal transportation
- 5.5 Activities, experiences, and tours
- 5.5.1 Tours and sightseeing
- 5.5.2 Entertainment and events
- 5.5.3 Food and dining experiences
- 5.6 Travel packages and bundles
- 5.6.1 Flight and hotel packages
- 5.6.2 All-inclusive vacation packages
- 5.6.3 Custom and personalized packages
Chapter 6 Market Estimates & Forecast, By Mode of Booking, 2021 - 2034 ($Bn)
- 6.1 Key trends
- 6.2 App-based
- 6.3 Web-based
- 6.4 Voice and conversational booking
- 6.5 Social media and emerging channels
Chapter 7 Market Estimates & Forecast, By Age Group, 2021 - 2034 ($Bn)
- 7.1 Key trends
- 7.2 Up to 29 years
- 7.3 30 to 44 years
- 7.4 45 to 59 years
- 7.5 60 years and above
Chapter 8 Market Estimates & Forecast, By Traveler, 2021 - 2034 ($Bn)
- 8.1 Key trends
- 8.2 Leisure travelers
- 8.3 Business travelers
- 8.4 Entertainment, sports, and event travelers
- 8.5 Educational travelers
- 8.6 Others
Chapter 9 Market Estimates & Forecast, By Business Model, 2021 - 2034 ($Bn)
- 9.1 Key trends
- 9.2 Commission-based models
- 9.3 Merchant models
- 9.4 Advertising and marketing revenue
- 9.5 Subscription and membership models
Chapter 10 Market Estimates & Forecast, By End Use, 2021 - 2034 ($Bn)
- 10.1 Key trends
- 10.2 Individual travelers
- 10.3 Corporate travelers
Chapter 11 Market Estimates & Forecast, By Region, 2021 - 2034 ($Bn)
- 11.1 North America
- 11.1.1 U.S.
- 11.1.2 Canada
- 11.2 Europe
- 11.2.1 UK
- 11.2.2 Germany
- 11.2.3 France
- 11.2.4 Italy
- 11.2.5 Spain
- 11.2.6 Russia
- 11.2.7 Nordics
- 11.3 Asia Pacific
- 11.3.1 China
- 11.3.2 India
- 11.3.3 Japan
- 11.3.4 South Korea
- 11.3.5 Australia
- 11.3.6 Southeast Asia
- 11.4 Latin America
- 11.4.1 Brazil
- 11.4.2 Mexico
- 11.4.3 Argentina
- 11.4.4 Chile
- 11.5 MEA
- 11.5.1 South Africa
- 11.5.2 Saudi Arabia
- 11.5.3 UAE
Chapter 12 Company Profiles
- 12.1 Agoda Company
- 12.2 Airbnb
- 12.3 Almosafer
- 12.4 Booking Holding
- 12.5 Cleartrip
- 12.6 Despegar.com
- 12.7 eDreams ODIGEO
- 12.8 Expedia
- 12.9 Hays Travel
- 12.10 Lastminute.com Group
- 12.11 MakeMyTrip
- 12.12 Rakuten Travel
- 12.13 Skyscanner
- 12.14 Tongcheng Travel Holdings
- 12.15 Traveloka
- 12.16 Trip.com Group
- 12.17 Tripadvisor
- 12.18 Trivago NV
- 12.19 Webjet
- 12.20 Yatra Online
 線上旅遊預訂服務市場:按交通方式、旅遊類型、預訂管道、設備、支付方式、旅遊時間、客戶群和預訂週期分類-2026-2032年全球市場預測
 全球線上旅遊預訂市場規模、佔有率、趨勢和成長分析報告(2026-2034)
 線上旅遊市場規模、佔有率、趨勢及預測(按服務類型、平台、預訂方式、年齡層和地區分類,2026-2034 年)
 按平台類型、年齡層和地區分類的線上旅遊市場
 線上旅遊預訂服務市場 - 全球產業規模、佔有率、趨勢、機會及預測(按服務類型、平台、支付方式、地區和競爭格局分類,2021-2031年)線上旅遊市場-2026-2031年預測日本線上住宿市場報告(按平台(行動應用程式、網站)、預訂方式(第三方線上入口網站、直接/自有入口網站)和地區分類,2026-2034 年)
 線上旅遊市場規模、佔有率和成長分析(按服務、預訂方式、平台、旅客、應用和地區分類)-2026-2033年產業預測線上旅遊市場按平台、服務類型、預訂類型、支付方式和旅客類型分類-2025-2030 年全球預測電子旅遊市場按服務類型、平台類型、旅行方式和最終用戶分類-2025-2030 年全球預測