


 |
市場調查報告書
商品編碼
1750498
非易腐牛奶市場機會、成長動力、產業趨勢分析及 2025 - 2034 年預測Non-Perishable Milk Market Opportunity, Growth Drivers, Industry Trend Analysis, and Forecast 2025 - 2034 |
||||||
2024年,全球非易腐牛奶市場規模達2,005億美元,預計到2034年將以5.6%的複合年成長率成長,達到3,432億美元。這一成長主要源於人們對保存期限更長、冷藏要求更低的乳製品日益成長的需求。非易腐牛奶已從缺乏冷藏設施地區的實用選擇發展成為全球主流選擇。消費者越來越傾向於選擇便利、營養豐富且保存期限較長的乳製品。隨著都市化進程的加速和飲食偏好的轉變,該產業正不斷拓展其覆蓋範圍,涵蓋不同的消費群。
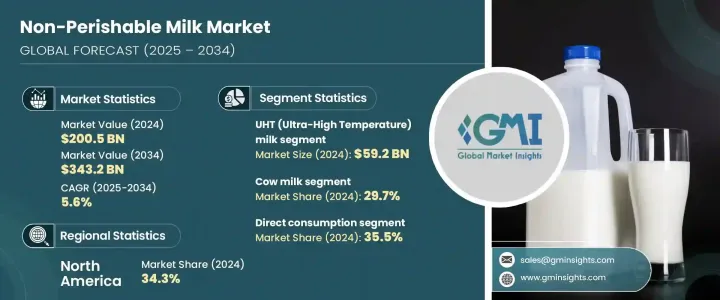
人們對強化牛奶、有機牛奶和無乳糖牛奶日益成長的興趣塑造了市場。隨著製造商應對不斷變化的健康和生活方式趨勢,這些偏好正在重塑產品開發策略。技術創新,尤其是加工方法的創新,也促進了市場擴張。超高溫(UHT)處理和高溫短時(HTST)技術的進步,加上無菌包裝,提高了非易腐牛奶的安全性、品質和保存期限。這些因素促進了非易腐牛奶的分銷和消費成長,尤其是在冷藏食品供應有限的地區。同時,人們對高鈣飲食的認知不斷提高,這促使人們形成了更高的牛奶消費模式。即使是植物性替代品也在非易腐食品領域佔有一席之地,這反映出消費者對永續性和健康日益成長的重視。
| 市場範圍 | |
|---|---|
| 起始年份 | 2024 |
| 預測年份 | 2025-2034 |
| 起始值 | 2005億美元 |
| 預測值 | 3432億美元 |
| 複合年成長率 | 5.6% |
就產品細分而言,非易腐牛奶市場包括超高溫滅菌牛奶、淡奶、甜煉乳、奶粉等。其中,超高溫滅菌牛奶在2024年佔據主導地位,市佔率為29.5%,價值592億美元。其主導地位歸功於其多功能性和無需冷藏即可長時間保鮮的能力,使其成為城鄉居民的首選。奶粉和淡奶也已成熟,尤其是在價格實惠且需要長期儲存的地區。甜煉乳在烹飪應用中仍然佔有重要地位,儘管在某些地區,人們對健康的擔憂略微抑制了其成長率。
依來源分類,市場可分為牛奶、羊奶、水牛奶、植物奶和其他奶類。 2024年,牛奶佔整個市場的29.7%,預計到2034年將以5.3%的複合年成長率成長。牛奶持續受歡迎的原因是其提供超高溫滅菌和奶粉兩種形式,非常符合當前消費者對便利、即食乳製品的需求。羊奶正逐漸受到尋求乳糖不耐受友善或易消化替代品的消費者的青睞。同時,水牛奶因其較高的脂肪含量和地區偏好,仍保持著小眾市場的吸引力。
不易腐的牛奶通路包括超市及大賣場、專賣店、便利商店、線上零售、餐飲服務網點、B2B直銷等。 2024年,超市和大賣場佔了最大的市場佔有率,達到31.5%。它們之所以受歡迎,是因為它們能夠在一個地方提供種類繁多的產品,使其成為日常消費者的首選。專賣店因其高階產品,尤其是以健康為中心或植物性的牛奶,而越來越受到青睞。便利商店在滿足單份或便攜裝牛奶的需求方面發揮關鍵作用。受送貨上門的便利性和電商平台的擴張推動,線上零售正在快速成長。餐飲服務管道繼續依賴超高溫滅菌奶和奶粉來確保穩定供應和易於儲存。面向企業的直銷依然強勁,尤其是在機構和商業領域。其他分銷方式包括自動販賣機和以出口為重點的管道,這些管道正在幫助品牌開拓尚未開發的市場。
從地區來看,2024年北美佔據了非易腐牛奶市場的最大佔有率,貢獻了總收入的34.3%。由於消費者生活方式的轉變以及對保存期限較長的營養選擇的興趣日益濃厚,該地區市場對超高溫滅菌牛奶和其他長效乳製品的接受度不斷提高。歐洲緊跟在後,由於其便利性和對冷鏈的依賴較少,歐洲消費者對超高溫滅菌牛奶的偏好也較為強烈。
拉克塔利斯國際公司、雀巢公司、恆天然合作Group Limited、達能公司和Arla Foods等主要產業參與者在推動市場成長方面發揮了重要作用。它們的影響力在創新、加工技術和全球分銷能力方面尤為明顯。這些公司持續投資於產品開發,並擴大其影響力,以滿足全球對非易腐乳製品日益成長的需求。
目錄
第1章:方法論與範圍
第2章:執行摘要
第3章:行業洞察
- 產業生態系統分析
- 影響價值鏈的因素
- 利潤率分析
- 製造商
- 經銷商
- 對貿易的影響
- 貿易量中斷
- 報復措施
- 對產業的影響
- 供給側影響(原料)
- 主要材料價格波動
- 供應鏈重組
- 生產成本影響
- 供給側影響(原料)
- 需求面影響(銷售價格)
- 價格傳導至終端市場
- 市佔率動態
- 消費者反應模式
- 受影響的主要公司
- 策略產業反應
- 供應鏈重組
- 定價和產品策略
- 政策參與
- 展望與未來考慮
- 供應商格局
- 利潤率分析
- 重要新聞和舉措
- 監管框架和標準
- 食品安全法規
- 標籤要求
- 品質標準
- 進出口法規
- 有機和清潔標籤認證
- 衝擊力
- 成長動力
- 都市化與生活方式的演變
- 加工和包裝技術的進步
- 零售擴張和政府支持
- 產業陷阱與挑戰
- 供應鏈中斷
- 經濟不確定性
- 市場機會
- 成長動力
- 產品概述
- 不易腐壞的牛奶加工技術
- 延長保存期限的方法
- 營養成分比較
- 感官特徵
- 製造流程分析
- 超高溫滅菌處理
- 蒸發和冷凝
- 噴霧乾燥
- 無菌包裝
- 品質控制流程
- 原料分析與採購策略
- 定價分析
- 永續性和環境影響評估
- 成長潛力分析
- 波特的分析
- PESTEL分析
第4章:競爭格局
- 介紹
- 市佔率分析
- 戰略框架
- 併購
- 合資與合作
- 新產品開發
- 擴張策略
- 競爭基準測試
- 供應商格局
- 競爭定位矩陣
- 戰略儀表板
- 品牌定位與消費者認知分析
- 新參與者的市場進入策略
- 自有品牌分析與策略
第5章:市場估計與預測:依產品類型,2021 - 2034 年
- 主要趨勢
- UHT(超高溫)牛奶
- 全脂超高溫滅菌牛奶
- 半脫脂UHT牛奶
- 脫脂超高溫滅菌牛奶
- 調味UHT牛奶
- 淡奶
- 全脂淡奶
- 脫脂淡奶
- 其他
- 甜煉乳
- 普通煉乳
- 調味甜煉乳
- 其他
- 甜煉乳
- 普通煉乳
- 調味甜煉乳
- 其他
- 奶粉
- 全脂奶粉
- 脫脂奶粉
- 加脂奶粉
- 嬰兒配方奶粉
- 其他
- 其他
第6章:市場估計與預測:按來源,2021 - 2034 年
- 主要趨勢
- 牛奶
- 山羊乳
- 水牛奶
- 植物性替代品
- 豆漿
- 杏仁奶
- 燕麥奶
- 椰奶
- 其他
- 其他
第7章:市場估計與預測:依脂肪含量,2021 - 2034 年
- 主要趨勢
- 全脂(脂肪含量≥3.5%)
- 半脫脂/低脂(脂肪含量 1.5-1.8%)
- 脫脂/低脂(脂肪含量≤0.5%)
- 無脂肪(0%脂肪)
- 脂肪含量可變
第8章:市場估計與預測:按包裝類型,2021 - 2034 年
- 主要趨勢
- 利樂包/無菌紙盒
- 磚紙箱
- 山牆頂紙箱
- 其他
- 罐頭
- 鋼罐
- 鋁罐
- 瓶子
- 玻璃瓶
- 塑膠瓶
- 袋裝
- 盒中袋
- 罐裝和袋裝(用於奶粉)
- 其他
第9章:市場估計與預測:按配銷通路,2021 - 2034 年
- 主要趨勢
- 超市和大賣場
- 專賣店
- 便利商店
- 網路零售
- 公司網站
- 電子商務平台
- 訂閱服務
- 餐飲服務
- 飯店和餐廳
- 咖啡館和麵包店
- 機構餐飲
- 直銷(B2B)
- 其他
第 10 章:市場估計與預測:依最終用途,2021 年至 2034 年
- 主要趨勢
- 直接消費
- 食品加工
- 烘焙和糖果
- 乳製品
- 嬰兒食品
- 預製食品
- 其他
- 飲料業
- 咖啡和茶
- 冰沙和奶昔
- 其他
- 食品服務業
- 營養補充品
- 其他
第 11 章:市場估計與預測:按地區,2021 年至 2034 年
- 主要趨勢
- 北美洲
- 美國
- 加拿大
- 歐洲
- 德國
- 英國
- 法國
- 西班牙
- 義大利
- 荷蘭
- 歐洲其他地區
- 亞太地區
- 中國
- 印度
- 日本
- 澳洲
- 韓國
- 亞太其他地區
- 拉丁美洲
- 巴西
- 墨西哥
- 阿根廷
- 拉丁美洲其他地區
- 中東和非洲
- 沙烏地阿拉伯
- 南非
- 阿拉伯聯合大公國
- 中東和非洲其他地區
第12章:公司簡介
- Nestle SA
- Danone SA
- Lactalis Group
- Fonterra Co-operative Group Limited
- FrieslandCampina
- Arla Foods amba
- Dean Foods (Dairy Farmers of America)
- Saputo Inc.
- Parmalat SpA (Lactalis)
- Amul (Gujarat Cooperative Milk Marketing Federation)
- China Mengniu Dairy Company Limited
- Inner Mongolia Yili Industrial Group Co., Ltd.
- Morinaga Milk Industry Co., Ltd.
- Meiji Holdings Co., Ltd.
- Savencia Fromage & Dairy
- DMK Deutsches Milchkontor GmbH
- Muller Group
- Dairy Farmers of America, Inc.
- Almarai Company
- Grupo LALA
- Vinamilk (Vietnam Dairy Products JSC)
- Borden Dairy Company
- Dairy Partners Americas (DPA)
- Darigold, Inc.
- California Dairies, Inc.
- Sodiaal
- Glanbia plc
- Schreiber Foods Inc.
- Land O'Lakes, Inc.
- Dairy Crest Group plc (Saputo)
The Global Non-Perishable Milk Market was valued at USD 200.5 billion in 2024 and is estimated to grow at a CAGR of 5.6% to reach USD 343.2 billion by 2034. This growth is largely fueled by the increasing demand for milk products with extended shelf life and minimal refrigeration requirements. Non-perishable milk has evolved from being a practical option in regions lacking cold storage to a mainstream choice worldwide. Consumers are gravitating toward options that offer convenience, nutritional value, and longer usability. With rising urbanization and shifting dietary preferences, the industry continues to expand its reach across diverse consumer groups.
The market has been shaped by growing interest in fortified, organic, and lactose-free milk variants. These preferences are reshaping product development strategies as manufacturers respond to changing health and lifestyle trends. Technological innovations, especially in processing methods, are also contributing to market expansion. Advancements in Ultra-High Temperature (UHT) treatment and high-temperature short-time (HTST) techniques, combined with aseptic packaging, have improved the safety, quality, and durability of non-perishable milk. These factors are enabling broader distribution and increased consumption, especially in areas with limited access to refrigerated goods. In parallel, there's a rise in awareness regarding calcium-rich diets, which plays into higher milk consumption patterns. Even plant-based alternatives are gaining space in the non-perishable segment, reflecting evolving consumer priorities toward sustainability and wellness.
| Market Scope | |
|---|---|
| Start Year | 2024 |
| Forecast Year | 2025-2034 |
| Start Value | $200.5 Billion |
| Forecast Value | $343.2 Billion |
| CAGR | 5.6% |
In terms of product segmentation, the non-perishable milk market includes UHT milk, evaporated milk, sweetened condensed milk, powdered milk, and others. Among these, UHT milk led the category in 2024 with a market share of 29.5%, representing USD 59.2 billion. Its dominance is attributed to its versatility and ability to remain fresh without refrigeration for extended periods, making it a preferred option in both urban and rural settings. Powdered and evaporated variants are also well-established, particularly where affordability and long-term storage are essential. Sweetened condensed milk maintains its relevance in culinary applications, though health concerns are slightly dampening its growth rate in some areas.
When evaluated by source, the market is segmented into cow milk, goat milk, buffalo milk, plant-based milk, and others. Cow milk accounted for 29.7% of the total market in 2024 and is expected to grow at a CAGR of 5.3% through 2034. Its continued popularity is supported by its availability in UHT and powdered forms, which align well with current consumer demands for convenient, ready-to-use dairy options. Goat milk is steadily gaining traction among consumers seeking lactose-intolerant-friendly or easily digestible alternatives. Meanwhile, buffalo milk retains niche appeal due to its higher fat content and regional preferences.
Distribution channels for non-perishable milk include supermarkets and hypermarkets, specialty stores, convenience stores, online retail, food service outlets, direct B2B sales, and others. Supermarkets and hypermarkets commanded the largest share of the market in 2024, accounting for 31.5%. Their popularity stems from their ability to offer a wide selection of products in one location, making them a go-to choice for everyday consumers. Specialty stores are increasingly favored for premium offerings, especially for health-centric or plant-based milk variants. Convenience stores play a key role in fulfilling demand for single-serve or on-the-go formats. Online retail is experiencing rapid growth, driven by the convenience of doorstep delivery and the expansion of e-commerce platforms. Food service channels continue to rely on UHT and powdered milk for consistent supply and ease of storage. Direct sales to businesses remain robust, particularly in institutional and commercial sectors. Additional distribution methods include vending and export-focused channels that are helping brands tap into untapped markets.
Regionally, North America held the largest share of the non-perishable milk market in 2024, contributing 34.3% of the total revenue. The regional market has seen increasing adoption of UHT milk and other long-lasting dairy products, thanks to evolving consumer lifestyles and greater interest in shelf-stable nutrition options. Europe follows closely with a strong preference for UHT milk due to its convenience and reduced reliance on cold chains.
Major industry players such as Lactalis International, Nestle S.A., Fonterra Co-operative Group Limited, Danone S.A., and Arla Foods are instrumental in driving market growth. Their influence is particularly evident in innovation, processing technology, and global distribution capabilities. These companies are consistently investing in product development and expanding their presence to meet the growing global demand for non-perishable milk products.
Table of Contents
Chapter 1 Methodology & Scope
- 1.1 Methodology and scope
- 1.2 Research methodology
- 1.3 Research scope & assumptions
- 1.4 List of data sources
- 1.5 Market estimation technique
- 1.6 Research limitations
Chapter 2 Executive Summary
- 2.1 Industry synopsis, 2021 - 2034
Chapter 3 Industry Insights
- 3.1 Industry ecosystem analysis
- 3.1.1 Factor affecting the value chain
- 3.1.2 Profit margin analysis
- 3.1.3 Manufacturers
- 3.1.4 Distributors
- 3.1.5 Impact on trade
- 3.1.6 Trade volume disruptions
- 3.2 Retaliatory measures
- 3.3 Impact on the industry
- 3.3.1 Supply-side impact (Raw Materials)
- 3.3.1.1 Price volatility in key materials
- 3.3.1.2 Supply chain restructuring
- 3.3.1.3 Production cost implications
- 3.3.1 Supply-side impact (Raw Materials)
- 3.4 Demand-side impact (Selling Price)
- 3.4.1 Price transmission to end markets
- 3.4.2 Market share dynamics
- 3.4.3 Consumer response patterns
- 3.5 Key companies impacted
- 3.6 Strategic industry responses
- 3.6.1 Supply chain reconfiguration
- 3.6.2 Pricing and product strategies
- 3.6.3 Policy engagement
- 3.7 Outlook and future considerations
- 3.8 Supplier landscape
- 3.9 Profit margin analysis
- 3.10 Key news & initiatives
- 3.11 Regulatory framework and standards
- 3.11.1 Food safety regulations
- 3.11.2 Labeling requirements
- 3.11.3 Quality standards
- 3.11.4 Import/export regulations
- 3.11.5 Organic & clean label certifications
- 3.12 Impact forces
- 3.12.1 Growth drivers
- 3.12.1.1 Urbanization and evolving lifestyles
- 3.12.1.2 Technological advancements in processing and packaging
- 3.12.1.3 Retail expansion and government support
- 3.12.2 Industry pitfalls & challenges
- 3.12.2.1 Supply chain disruptions
- 3.12.2.2 Economic uncertainty
- 3.12.3 Market opportunities
- 3.12.1 Growth drivers
- 3.13 Product overview
- 3.13.1 Nonperishable milk processing technologies
- 3.13.2 Shelf-life extension methods
- 3.13.3 Nutritional profile comparison
- 3.13.4 Sensory characteristics
- 3.14 Manufacturing process analysis
- 3.14.1 UHT processing
- 3.14.2 Evaporation & Condensation
- 3.14.3 Spray drying
- 3.14.4 Aseptic packaging
- 3.14.5 Quality control processes
- 3.15 Raw material analysis & procurement strategies
- 3.16 Pricing analysis
- 3.17 Sustainability & environmental impact assessment
- 3.18 Growth potential analysis
- 3.19 Porter's analysis
- 3.20 PESTEL analysis
Chapter 4 Competitive Landscape, 2024
- 4.1 Introduction
- 4.2 Market share analysis
- 4.3 Strategic framework
- 4.3.1 Mergers & acquisitions
- 4.3.2 Joint ventures & collaborations
- 4.3.3 New product developments
- 4.3.4 Expansion strategies
- 4.4 Competitive benchmarking
- 4.5 Vendor landscape
- 4.6 Competitive positioning matrix
- 4.7 Strategic dashboard
- 4.8 Brand positioning & consumer perception analysis
- 4.9 Market entry strategies for new players
- 4.10 Private label analysis & strategies
Chapter 5 Market Estimates and Forecast, By Product Type, 2021 - 2034 (USD Billion) (Kilo Tons)
- 5.1 Key trends
- 5.2 UHT (Ultra-High Temperature) milk
- 5.2.1 Whole UHT milk
- 5.2.2 Semi-skimmed UHT milk
- 5.2.3 Skimmed UHT milk
- 5.2.4 Flavored UHT milk
- 5.3 Evaporated milk
- 5.3.1 Whole evaporated milk
- 5.3.2 Skimmed evaporated milk
- 5.3.3 Others
- 5.4 Sweetened condensed milk
- 5.4.1 Regular sweetened condensed milk
- 5.4.2 Flavored sweetened condensed milk
- 5.4.3 Others
- 5.5 Sweetened condensed milk
- 5.5.1 Regular sweetened condensed milk
- 5.5.2 Flavored sweetened condensed milk
- 5.5.3 Others
- 5.6 Powdered milk
- 5.6.1 Whole milk powder
- 5.6.2 Skimmed milk powder
- 5.6.3 Fat-filled milk powder
- 5.6.4 Infant formula
- 5.6.5 Others
- 5.7 Others
Chapter 6 Market Estimates and Forecast, By Source, 2021 - 2034 (USD Billion) (Kilo Tons)
- 6.1 Key trends
- 6.2 Cow milk
- 6.3 Goat milk
- 6.4 Buffalo milk
- 6.5 Plant-based alternatives
- 6.5.1 Soy milk
- 6.5.2 Almond milk
- 6.5.3 Oat milk
- 6.5.4 Coconut milk
- 6.5.5 Others
- 6.6 Others
Chapter 7 Market Estimates and Forecast, By Fat Content, 2021 - 2034 (USD Billion) (Kilo Tons)
- 7.1 Key trends
- 7.2 Whole/full fat (≥3.5% Fat)
- 7.3 Semi-skimmed/reduced fat (1.5-1.8% Fat)
- 7.4 Skimmed/low fat (≤0.5% Fat)
- 7.5 Fat-free (0% Fat)
- 7.6 Variable fat content
Chapter 8 Market Estimates and Forecast, By Packaging Type, 2021 - 2034 (USD Billion) (Kilo Tons)
- 8.1 Key trends
- 8.2 Tetra packs/aseptic cartons
- 8.2.1 Brick cartons
- 8.2.2 Gable top cartons
- 8.2.3 Others
- 8.3 Cans
- 8.3.1 Steel cans
- 8.3.2 Aluminum cans
- 8.4 Bottles
- 8.4.1 Glass bottles
- 8.4.2 Plastic bottles
- 8.5 Pouches
- 8.6 Bag-in-box
- 8.7 Tins & sachets (for Powdered Milk)
- 8.8 Others
Chapter 9 Market Estimates and Forecast, By Distribution Channel, 2021 - 2034 (USD Billion) (Kilo Tons)
- 9.1 Key trends
- 9.2 Supermarkets & hypermarkets
- 9.3 Specialty stores
- 9.4 Convenience stores
- 9.5 Online retail
- 9.5.1 Company websites
- 9.5.2 E-commerce platforms
- 9.5.3 Subscription services
- 9.6 Foodservice
- 9.6.1 Hotels & restaurants
- 9.6.2 Cafes & bakeries
- 9.6.3 Institutional catering
- 9.7 Direct sales (B2B)
- 9.8 Others
Chapter 10 Market Estimates and Forecast, By End Use, 2021 - 2034 (USD Billion) (Kilo Tons)
- 10.1 Key trends
- 10.2 Direct consumption
- 10.3 Food processing
- 10.3.1 Bakery & confectionery
- 10.3.2 Dairy products
- 10.3.3 Infant food
- 10.3.4 Prepared foods
- 10.3.5 Others
- 10.4 Beverage industry
- 10.4.1 Coffee & tea
- 10.4.2 Smoothies & shakes
- 10.4.3 Others
- 10.5 Food service industry
- 10.6 Nutritional supplements
- 10.7 Others
Chapter 11 Market Estimates and Forecast, By Region, 2021 - 2034 (USD Billion) (Kilo Tons)
- 11.1 Key trends
- 11.2 North America
- 11.2.1 U.S.
- 11.2.2 Canada
- 11.3 Europe
- 11.3.1 Germany
- 11.3.2 UK
- 11.3.3 France
- 11.3.4 Spain
- 11.3.5 Italy
- 11.3.6 Netherlands
- 11.3.7 Rest of Europe
- 11.4 Asia Pacific
- 11.4.1 China
- 11.4.2 India
- 11.4.3 Japan
- 11.4.4 Australia
- 11.4.5 South Korea
- 11.4.6 Rest of Asia Pacific
- 11.5 Latin America
- 11.5.1 Brazil
- 11.5.2 Mexico
- 11.5.3 Argentina
- 11.5.4 Rest of Latin America
- 11.6 Middle East and Africa
- 11.6.1 Saudi Arabia
- 11.6.2 South Africa
- 11.6.3 UAE
- 11.6.4 Rest of Middle East and Africa
Chapter 12 Company Profiles
- 12.1 Nestle S.A.
- 12.2 Danone S.A.
- 12.3 Lactalis Group
- 12.4 Fonterra Co-operative Group Limited
- 12.5 FrieslandCampina
- 12.6 Arla Foods amba
- 12.7 Dean Foods (Dairy Farmers of America)
- 12.8 Saputo Inc.
- 12.9 Parmalat S.p.A. (Lactalis)
- 12.10 Amul (Gujarat Cooperative Milk Marketing Federation)
- 12.11 China Mengniu Dairy Company Limited
- 12.12 Inner Mongolia Yili Industrial Group Co., Ltd.
- 12.13 Morinaga Milk Industry Co., Ltd.
- 12.14 Meiji Holdings Co., Ltd.
- 12.15 Savencia Fromage & Dairy
- 12.16 DMK Deutsches Milchkontor GmbH
- 12.17 Muller Group
- 12.18 Dairy Farmers of America, Inc.
- 12.19 Almarai Company
- 12.20 Grupo LALA
- 12.21 Vinamilk (Vietnam Dairy Products JSC)
- 12.22 Borden Dairy Company
- 12.23 Dairy Partners Americas (DPA)
- 12.24 Darigold, Inc.
- 12.25 California Dairies, Inc.
- 12.26 Sodiaal
- 12.27 Glanbia plc
- 12.28 Schreiber Foods Inc.
- 12.29 Land O'Lakes, Inc.
- 12.30 Dairy Crest Group plc (Saputo)
 植物奶市場規模、佔有率和成長分析:按原料、產品類型、生產方法、性質、包裝、分銷通路、最終用戶和地區分類-2026-2033年產業預測
 復原奶市場商機、成長要素、產業趨勢分析及2026-2035年預測。
 原乳市場報告:趨勢、預測及競爭分析(至2035年)
 豌豆奶市場:按產品類型、包裝、最終用戶和地區分類
 全球植物奶市場規模、佔有率、趨勢和成長分析報告(2026-2034)
 豌豆奶市場規模、佔有率及成長分析(依口味、包裝類型、通路、最終用戶及地區分類)-2026-2033年產業預測嬰兒奶粉市場機會、成長動力、產業趨勢分析及2025-2034年預測
 2032 年配方奶市場預測:按類型、來源、包裝類型、分銷管道、應用和地區進行的全球分析植物奶市場機會、成長動力、產業趨勢分析及2025-2034年預測全球原料乳市場規模依產品類型、通路、包裝類型、地區、範圍及預測