


 |
市場調查報告書
商品編碼
1741009
站坪巴士市場機會、成長動力、產業趨勢分析及 2025 - 2034 年預測Apron Buses Market Opportunity, Growth Drivers, Industry Trend Analysis, and Forecast 2025 - 2034 |
||||||
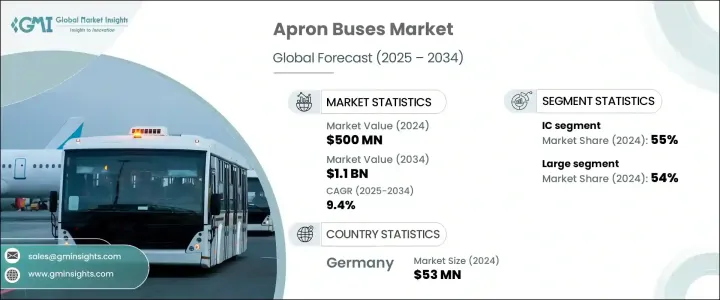
2024年,全球機場擺渡車市場規模達5億美元,預估年複合成長率達9.4%,2034年將達11億美元。成長主要源於航站樓和飛機之間對高效客運需求的不斷成長、機場基礎設施的持續現代化以及全球永續航空實踐的推動。隨著機場不斷擴建和調整以應對更高的客流量,機場擺渡車在簡化地面運作、縮短週轉時間和提高機場整體效率方面變得至關重要。已開發市場和新興市場的機場都在投資新機隊,以應對激增的空中交通流量,並日益重視智慧、永續和互聯的出行解決方案。機場面臨的減碳壓力日益增大,加上政府計劃綠色交通系統的舉措,正在重塑地面支持營運。電動和混合動力技術、即時機隊管理系統以及以乘客為中心的創新的融合,正在重塑機場擺渡車的格局,並使其在未來十年實現強勁成長。
隨著營運商優先考慮更清潔的出行解決方案以滿足日益嚴格的環境法規和雄心勃勃的碳中和目標,電動月台巴士日益受到青睞,標誌著機場地面交通的重大轉型。電動替代方案有助於減少排放,並幫助機場降低其整體碳足跡—這在全球航空永續發展標準中是一個日益重要的基準。電動巴士的採用得益於政策支持,包括政府對零排放地面車輛的補貼和激勵措施,以及不斷上漲的燃油成本,這使得傳統的內燃機巴士長期運作成本更高。電動月台巴士除了對環境產生影響外,還具有其他營運優勢,包括由於運動部件減少而顯著降低維護成本、不使用油基部件以及透過再生技術減少煞車磨損。
| 市場範圍 | |
|---|---|
| 起始年份 | 2024 |
| 預測年份 | 2025-2034 |
| 起始值 | 5億美元 |
| 預測值 | 11億美元 |
| 複合年成長率 | 9.4% |
2024年,內燃機 (IC) 驅動的機場擺渡車市場佔有 55% 的佔有率。這類擺渡車因其成本效益高、性能強勁以及對各種營運環境的適應性(尤其是在電力基礎設施尚不完善或尚未普及的地區),仍然是許多機場的首選。它們能夠以最少的停機時間處理機場的重載營運,使其成為已開發市場和新興市場地面支援車隊中不可或缺的一部分。內燃機驅動的機場擺渡車廣泛應用於需要快速擴充車隊以滿足不斷成長的客流量且無需進行大規模基礎設施改造的地區。
就運力而言,大型停機坪巴士市場在2024年佔據了54%的佔有率。這些高容量巴士單程可運送超過100名旅客,非常適合客流量大且停機位較遠的國際機場。其設計特點——例如低地板、寬門和充足的站立空間——可支援更快的登機和下機速度,縮短週轉時間,並改善整體航站樓物流。機場正在增加對大型巴士的投資,以簡化高峰時段的營運,最佳化車隊規模,同時最大限度地降低燃油和人工成本。
德國機場擺渡車市場佔28%的市場佔有率,2024年市場規模達5,300萬美元,這得益於其先進的汽車製造基礎、對電動車的高度重視以及政府推行的綠色機場營運政策。憑藉世界一流的原始設備製造商和尖端汽車技術,德國在高性能、低排放機場擺渡車的開發和出口方面處於領先地位。德國對歐盟綠色協議的承諾以及對氣候中立機場的願景,鞏固了其在全球機場擺渡車市場中關鍵創新中心的地位。
全球機場擺渡車產業的主要參與者包括廈門金龍、阿蕭克利蘭、比亞迪公司、沃爾沃集團、南丹GSE、尼奧普蘭、Proterra、COBUS Industries和信發。各公司正積極開發和引進電動和混合動力機場擺渡車,以滿足環保法規並降低營運成本。他們正在整合GPS追蹤、即時乘客資訊系統和自動駕駛功能,以提升營運效率和乘客體驗。各組織也正在與機場管理局和其他利益相關者建立聯盟,以促進機場擺渡車的部署並擴大市場覆蓋範圍。
目錄
第1章:方法論與範圍
第2章:執行摘要
第3章:行業洞察
- 產業生態系統分析
- 供應商格局
- 零件供應商
- 原物料供應商
- 製造商
- 服務提供者
- 經銷商
- 最終用途
- 川普政府關稅的影響
- 對貿易的影響
- 貿易量中斷
- 報復措施
- 對產業的影響
- 供給側影響(原料)
- 主要材料價格波動
- 供應鏈重組
- 生產成本影響
- 需求面影響(售價)
- 價格傳導至終端市場
- 市佔率動態
- 消費者反應模式
- 供給側影響(原料)
- 策略產業反應
- 供應鏈重組
- 定價和產品策略
- 對貿易的影響
- 利潤率分析
- 技術與創新格局
- 專利分析
- 重要新聞和舉措
- 監管格局
- 衝擊力
- 成長動力
- 全球航空旅行增加
- 日益關注環境永續性
- 機場基礎建設投資不斷增加
- 智慧與互聯技術的融合
- 產業陷阱與挑戰
- 維護成本高
- 供應鏈中斷
- 成長動力
- 成長潛力分析
- 波特的分析
- PESTEL分析
第4章:競爭格局
- 介紹
- 公司市佔率分析
- 競爭定位矩陣
- 戰略展望矩陣
第5章:市場估計與預測:按推進方式,2021 - 2034 年
- 主要趨勢
- 我知道了
- 柴油引擎
- 天然氣
- 電的
- 混合
第6章:市場估計與預測:依產能,2021 - 2034 年
- 主要趨勢
- 大的
- 中等的
- 小的
第7章:市場估計與預測:依最終用途,2021 - 2034 年
- 主要趨勢
- 機場
- 航空
- 政府與國防
第8章:市場估計與預測:按地區,2021 - 2034 年
- 主要趨勢
- 北美洲
- 美國
- 加拿大
- 歐洲
- 英國
- 德國
- 法國
- 義大利
- 西班牙
- 俄羅斯
- 北歐人
- 亞太地區
- 中國
- 印度
- 日本
- 韓國
- 澳新銀行
- 東南亞
- 拉丁美洲
- 巴西
- 墨西哥
- 阿根廷
- MEA
- 阿拉伯聯合大公國
- 沙烏地阿拉伯
- 南非
第9章:公司簡介
- AB Volvo
- AMSS GSE
- Ashok Leyland
- BYD Company
- China Leyuan Airspace Investment Manufacturing
- COBUS Industries
- KIITOKORI OY
- MCV Group
- Nandan GSE
- Neoplan
- Panus Assembly
- Proterra
- Shenzhen Wuzhoulong Motors
- Sutlej Motors
- TAM - EUROPE
- Tarmac Aerosave
- Weihai Guangtai Airport Equipment
- Xiamen King Long United Automotive Industry
- Xinfa Airport Equipment
- Zhengzhou Yutong Bus
The Global Apron Buses Market was valued at USD 500 million in 2024 and is estimated to grow at a CAGR of 9.4%, reaching USD 1.1 billion by 2034. Growth is largely driven by rising demand for efficient passenger transport between terminals and aircraft, the ongoing modernization of airport infrastructure, and the global movement toward sustainable aviation practices. As airports continue to expand and adapt to handle higher passenger volumes, apron buses are becoming essential in streamlining ground operations, enhancing turnaround times, and improving overall airport efficiency. Airports across developed and emerging markets are investing in new fleets to support the surge in air traffic, with a growing focus on smart, sustainable, and connected mobility solutions. The increasing pressure on airports to reduce carbon emissions, combined with government initiatives promoting greener transport systems, is reshaping ground support operations. The integration of electric and hybrid technologies, real-time fleet management systems, and passenger-centric innovations is reshaping the apron bus landscape and positioning it for robust growth over the next decade.
The growing preference for electric apron buses marks a significant transition in airport ground transportation as operators prioritize cleaner mobility solutions to meet tightening environmental regulations and ambitious carbon neutrality goals. Electric alternatives contribute to emissions reduction and help airports lower their overall carbon footprint-an increasingly critical benchmark in global aviation sustainability standards. Their adoption is fueled by policy support, including government subsidies and incentives for zero-emission ground vehicles and rising fuel costs that make traditional IC buses more expensive to operate long term. Electric apron buses also offer operational benefits beyond environmental impact, including significantly lower maintenance costs due to fewer moving parts, the absence of oil-based components, and reduced brake wear through regenerative technologies.
| Market Scope | |
|---|---|
| Start Year | 2024 |
| Forecast Year | 2025-2034 |
| Start Value | $500 Million |
| Forecast Value | $1.1 Billion |
| CAGR | 9.4% |
The internal combustion (IC) engine-powered segment held a 55% share in the apron buses market in 2024. These buses remain a preferred option across many airports because of their cost-effectiveness, strong performance, and adaptability to varied operational environments-especially where electric infrastructure is still underdeveloped or unavailable. Their ability to handle heavy-duty airport operations with minimal downtime has kept them an integral component of ground support fleets in both developed and emerging markets. IC-powered apron buses are widely used in regions requiring rapid fleet expansion to meet rising passenger traffic without extensive infrastructure changes.
In terms of capacity, the large-sized apron buses segment accounted for a 54% share in 2024. These high-capacity buses transport over 100 passengers in a single trip, making them ideal for international airports with heavy passenger traffic and remote aircraft stands. Their design features-such as low floors, wide doors, and ample standing space-support faster boarding and unloading, reduce turnaround times, and improve overall terminal logistics. Airports are increasingly investing in larger buses to streamline operations during peak travel hours and optimize fleet size while minimizing fuel and labor costs.
Germany's Apron Bus Market held a 28% share and generated USD 53 million in 2024, driven by its advanced automotive manufacturing base, strong focus on electric mobility, and government policies promoting green airport operations. Backed by world-class OEMs and access to cutting-edge vehicle technologies, Germany leads in the development and export of high-performance, low-emission apron buses. The country's commitment to the EU Green Deal and vision for climate-neutral airports strengthens its position as a key innovation hub within the global apron bus market.
Key players in the global apron bus industry include Xiamen King Long, Ashok Leyland, BYD Company, AB Volvo, Nandan GSE, Neoplan, Proterra, COBUS Industries, and Xinfa. Companies are actively developing and introducing electric and hybrid apron buses to meet environmental regulations and reduce operational costs. They are incorporating GPS tracking, real-time passenger information systems, and autonomous driving features to enhance operational efficiency and passenger experience. Organizations are also forming alliances with airport authorities and other stakeholders to facilitate apron bus deployment and expand market reach.
Table of Contents
Chapter 1 Methodology & Scope
- 1.1 Research design
- 1.1.1 Research approach
- 1.1.2 Data collection methods
- 1.2 Base estimates and calculations
- 1.2.1 Base year calculation
- 1.2.2 Key trends for market estimates
- 1.3 Forecast model
- 1.4 Primary research & validation
- 1.4.1 Primary sources
- 1.4.2 Data mining sources
- 1.5 Market definitions
Chapter 2 Executive Summary
- 2.1 Industry 3600 synopsis, 2021 - 2034
Chapter 3 Industry Insights
- 3.1 Industry ecosystem analysis
- 3.2 Supplier landscape
- 3.2.1 Component supplier
- 3.2.2 Raw material supplier
- 3.2.3 Manufacturer
- 3.2.4 Service provider
- 3.2.5 Distributor
- 3.2.6 End use
- 3.3 Impact of Trump administration tariffs
- 3.3.1 Impact on trade
- 3.3.1.1 Trade volume disruptions
- 3.3.1.2 Retaliatory measures
- 3.3.2 Impact on industry
- 3.3.2.1 Supply-side impact (raw materials)
- 3.3.2.1.1 Price volatility in key materials
- 3.3.2.1.2 Supply chain restructuring
- 3.3.2.1.3 Production cost implications
- 3.3.2.2 Demand-side impact (selling price)
- 3.3.2.2.1 Price transmission to end markets
- 3.3.2.2.2 Market share dynamics
- 3.3.2.2.3 Consumer response patterns
- 3.3.2.1 Supply-side impact (raw materials)
- 3.3.3 Strategic industry responses
- 3.3.3.1 Supply chain reconfiguration
- 3.3.3.2 Pricing and product strategies
- 3.3.1 Impact on trade
- 3.4 Profit margin analysis
- 3.5 Technology & innovation landscape
- 3.6 Patent analysis
- 3.7 Key news & initiatives
- 3.8 Regulatory landscape
- 3.9 Impact forces
- 3.9.1 Growth drivers
- 3.9.1.1 Increasing air travel globally
- 3.9.1.2 Growing focus on environmental sustainability
- 3.9.1.3 Rising investment in airport infrastructure
- 3.9.1.4 Integration of smart & connected technologies
- 3.9.2 Industry pitfalls & challenges
- 3.9.2.1 High maintenance cost
- 3.9.2.2 Supply chain disruption
- 3.9.1 Growth drivers
- 3.10 Growth potential analysis
- 3.11 Porter's analysis
- 3.12 PESTEL analysis
Chapter 4 Competitive Landscape, 2024
- 4.1 Introduction
- 4.2 Company market share analysis
- 4.3 Competitive positioning matrix
- 4.4 Strategic outlook matrix
Chapter 5 Market Estimates & Forecast, By Propulsion, 2021 - 2034 ($Bn, Units)
- 5.1 Key trends
- 5.2 IC
- 5.2.1 Diesel
- 5.2.2 CNG
- 5.3 Electric
- 5.4 Hybrid
Chapter 6 Market Estimates & Forecast, By Capacity, 2021 - 2034 ($Bn, Units)
- 6.1 Key trends
- 6.2 Large
- 6.3 Medium
- 6.4 Small
Chapter 7 Market Estimates & Forecast, By End Use, 2021 - 2034 ($Bn, Units)
- 7.1 Key trends
- 7.2 Airports
- 7.3 Airlines
- 7.4 Government & Defense
Chapter 8 Market Estimates & Forecast, By Region, 2021 - 2034 ($Bn, Units)
- 8.1 Key trends
- 8.2 North America
- 8.2.1 U.S.
- 8.2.2 Canada
- 8.3 Europe
- 8.3.1 UK
- 8.3.2 Germany
- 8.3.3 France
- 8.3.4 Italy
- 8.3.5 Spain
- 8.3.6 Russia
- 8.3.7 Nordics
- 8.4 Asia Pacific
- 8.4.1 China
- 8.4.2 India
- 8.4.3 Japan
- 8.4.4 South Korea
- 8.4.5 ANZ
- 8.4.6 Southeast Asia
- 8.5 Latin America
- 8.5.1 Brazil
- 8.5.2 Mexico
- 8.5.3 Argentina
- 8.6 MEA
- 8.6.1 UAE
- 8.6.2 Saudi Arabia
- 8.6.3 South Africa
Chapter 9 Company Profiles
- 9.1 AB Volvo
- 9.2 AMSS GSE
- 9.3 Ashok Leyland
- 9.4 BYD Company
- 9.5 China Leyuan Airspace Investment Manufacturing
- 9.6 COBUS Industries
- 9.7 KIITOKORI OY
- 9.8 MCV Group
- 9.9 Nandan GSE
- 9.10 Neoplan
- 9.11 Panus Assembly
- 9.12 Proterra
- 9.13 Shenzhen Wuzhoulong Motors
- 9.14 Sutlej Motors
- 9.15 TAM - EUROPE
- 9.16 Tarmac Aerosave
- 9.17 Weihai Guangtai Airport Equipment
- 9.18 Xiamen King Long United Automotive Industry
- 9.19 Xinfa Airport Equipment
- 9.20 Zhengzhou Yutong Bus


