


 |
市場調查報告書
商品編碼
2029028
滲透能市場:按技術、應用、最終用戶、地區和主要企業分類:行業趨勢和全球市場預測(至2040年)Osmotic Energy Market, Till 2040: Distribution by Technology, Application, End User, Geographical Regions, and Key Players: Industry Trends and Global Forecasts |
||||||
滲透能市場展望
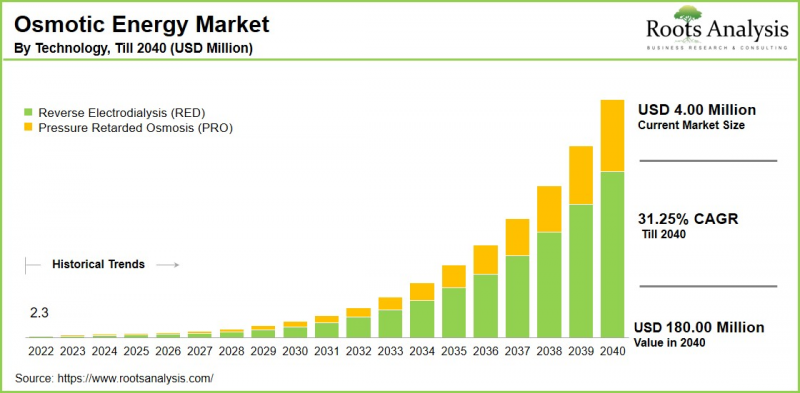
根據 Roots Analysis 的研究,預計到 2040 年,全球滲透能市場將以 31.25% 的複合年成長率成長,從目前的 400 萬美元成長到 2040 年的 1.8 億美元。
滲透能市場涵蓋利用鹽度梯度產生的化學勢發電的技術及相關服務,通常被稱為藍色能源。此方法利用延遲加壓滲透(PRO)和逆電透析(RED)將海水和淡水之間的自然差值轉換為可用電能。
具體而言,市場成長主要受以下因素驅動:對穩定、非間歇性再生能源來源的需求不斷成長,以及從工業廢水中能源回收的興趣日益濃厚。與間歇性可再生能源不同,滲透能可提供持續的電力輸出,使其成為太陽能和風能系統的有效補充。其主要應用包括在河口發電以及整合到水處理基礎設施中。整體而言,滲透能市場的長期成長取決於技術的持續進步以及提供經濟永續解決方案的能力。
推動滲透能市場成長的關鍵市場促進因素
滲透能作為現代能源系統中可靠且永續的解決方案,正迅速發展成為市場熱點。其主要優勢之一在於能夠提供持續穩定的基本負載電力,從而避免了太陽能和風能發電的間歇性問題。這項特性使其成為穩定電網、確保全天候供電的策略選擇,尤其是在平衡可再生能源組合至關重要的亞太地區。
此外,包括資料中心和氫氣設施在內的高耗能產業,正推動對不間斷、無碳電力日益成長的需求,以滿足嚴格的環境、社會和管治(ESG) 目標。同時,膜技術的進步,包括高性能材料的開發,正在提高功率密度並減少安裝空間需求。這些創新有助於抵消高昂的初始投資成本,並加速關鍵發展區域的商業性化。
滲透能市場:競爭格局
滲透能市場的競爭格局呈現出多元化的特點,除了杜邦、Eco Wave Power、Gradient、Minesto、蘇伊士集團、Statkraft 和 Sweetch Energy 等主要企業外,還湧現出許多新興創新企業。這些公司憑藉著多元化的技術組合和全球運營,保持著強大的市場地位。產業相關人員日益重視合作、夥伴關係和業務拓展,以加速創新、提升市場滲透率並增強擴充性。例如,Aquastill 正在進行一個旨在利用薄膜技術促進永續水處理和發電的聯合計畫。 SaltPower 也獲得了丹麥創新基金的資助,用於進一步開發和擴大其壓力延遲絕緣 (PRO) 技術的應用規模。這些努力有望推動滲透能解決方案的商業化,並促進其融入更廣泛的多資源永續基礎設施平台。
滲透能市場由歐洲主導。
目前,歐洲在全球市場佔最大佔有率。這一主導地位得益於集中進行的研發活動、持續的公共資金投入以及豐富的先導計畫經驗。同時,亞太市場預計將以複合年成長率成長,這主要得益於其有利條件,例如漫長的海岸線和河流Delta、不斷成長的工業能源需求以及不斷發展的可再生能源政策。
滲透能市場:主要市場區隔
按技術分類的市場佔有率
- 壓力延遲性失眠(PRO)
- 逆電透析(RED)
按應用分類的市場佔有率
- 發電
- 水處理和海水淡化
按最終用戶分類的市場佔有率
- 商業
- 產業
- 住宅
按地區分類的市場佔有率
- 北美洲
- 美國
- 加拿大
- 墨西哥
- 北美及其他地區
- 歐洲
- 奧地利
- 比利時
- 丹麥
- 法國
- 德國
- 愛爾蘭
- 義大利
- 荷蘭
- 挪威
- 俄羅斯
- 西班牙
- 瑞典
- 瑞士
- 英國
- 其他歐洲國家
- 亞太地區
- 澳洲
- 中國
- 印度
- 日本
- 紐西蘭
- 新加坡
- 韓國
- 亞太其他地區
- 拉丁美洲
- 巴西
- 智利
- 哥倫比亞
- 委內瑞拉
- 其他拉丁美洲
- 中東和非洲
- 埃及
- 伊朗
- 伊拉克
- 以色列
- 科威特
- 沙烏地阿拉伯
- 阿拉伯聯合大公國
- 其他中東和非洲地區
本報告考察了全球滲透能市場,提供了概述、背景、市場影響因素分析、市場規模趨勢和預測、按各個細分市場進行的詳細分析、競爭格局以及主要企業的概況。
目錄
第1章:專案概述
第2章:調查方法
第3章 市場動態
第4章 宏觀經濟指標
第5章執行摘要
第6章:引言
第7章 監管情景
第8章:主要企業綜合資料庫
第9章 競爭情勢
第10章:閒置頻段分析
第11章:企業競爭力分析
第12章:Start-Ups生態系統
第13章:公司簡介
- 章節概要
- Aqua Battery
- Aquastill
- DuPont
- Eco Wave Power
- Gradiant
- Minesto
- Ocean Grazer
- Pani
- REDstack
- REGENERATE
- Renergen
- Salinity Solutions
- SaltPower
- Sea6 Energy
- Statkraft
- SUEZ
- Sweetch Energy
第14章 大趨勢分析
第15章:未滿足需求的分析
第16章 專利分析
第17章 近期趨勢
第18章:全球滲透能市場
第19章 科技帶來的市場機遇
第20章 按應用分類的市場機會
第21章 最終用戶的市場機會
第22章 北美滲透能市場機遇
第23章 歐洲滲透能市場機遇
第24章 亞太地區滲透能市場機會
第25章 拉丁美洲滲透能的市場機遇
第26章 中東和非洲滲透能的市場機會
第27章 市場集中度分析:主要企業的分佈
第28章:鄰近市場分析
第29章:制勝的關鍵策略
第30章:波特五力分析
第31章 SWOT分析
第32章 價值鏈分析
第33章:ROOTS的策略建議
第34章 來自初步調查的見解
第35章:報告結論
第36章:表格形式數據
第37章 公司與組織列表
Osmotic Energy Market Outlook
As per Roots Analysis, the global osmotic energy market size is estimated to grow from USD 4.00 million in current year to USD 180 million by 2040, at a CAGR of 31.25%, during the forecast period, till 2040.
The osmotic energy market encompasses technologies and associated services that generate electricity by harnessing the chemical potential created by salinity gradients, commonly referred to as "blue energy." This approach utilizes pressure-retarded osmosis (PRO) and reverse electrodialysis (RED) to convert the natural difference between saltwater and freshwater into usable power.
Notably, the market growth is being driven by the increasing demand for stable, non-intermittent renewable energy sources, along with rising interest in recovering energy from industrial water streams. Unlike intermittent renewables, osmotic energy provides a continuous power output, positioning it as a valuable complement to solar and wind energy systems. Key applications include power generation in coastal estuaries and integration into water treatment infrastructure. Overall, the long-term growth of the osmotic energy market will depend on continued technological progress and the ability to deliver economically sustainable solutions.
Strategic Insights for Senior Leaders
Key Drivers Propelling Growth of Osmotic Energy Market
The osmotic energy market is gaining momentum as a reliable and sustainable solution for modern energy systems. One of its key advantages lies in its ability to provide continuous, predictable baseload power, thereby avoiding the intermittency associated with solar and wind energy. This makes it a strategic option for grid stabilization and round-the-clock power supply, particularly in regions such as Asia-Pacific where balancing renewable energy portfolios is critical.
Additionally, there is a growing demand from energy-intensive industries, including data centers and hydrogen production facilities, for uninterrupted, carbon-free electricity to meet stringent environmental, social, and governance (ESG) objectives. Furthermore, advancements in membrane technologies, including the development of high-performance materials, are improving power density and reducing space requirements. These innovations are helping to offset high initial capital costs and are accelerating the pathway towards commercial viability in key development regions.
Osmotic Energy Market: Competitive Landscape of Companies in this Industry
The competitive landscape of the osmotic energy market is defined by the presence of key players such as DuPont, Eco Wave Power, Gradiant, Minesto, SUEZ, Statkraft, and Sweetch Energy, alongside several emerging innovators. These companies maintain strong market positions through diverse technology portfolios and global presence. Industry participants are increasingly focusing on collaborations, partnerships, and expansion initiatives to accelerate innovation, enhance market penetration, and improve scalability. For instance, Aquastill has engaged in collaborative projects aimed at advancing sustainable water treatment and energy generation using membrane-based technologies. Similarly, SaltPower has secured funding support from Innovation Fund Denmark to further develop and scale its pressure-retarded osmosis (PRO) technology. Such initiatives are expected to drive commercialization efforts and facilitate the integration of osmotic energy solutions into broader multi-resource and sustainable infrastructure platforms.
Europe Dominates the Osmotic Energy Market
According to our analysis, in the current year, Europe captures the highest share of the global osmotic energy market. This dominance is primarily driven by concentrated research and development activities, consistent public funding, and a strong presence of operational pilot projects. In contrast, the Asia-Pacific market is anticipated to grow at a CAGR, driven by favorable geographic conditions including extensive coastlines and river deltas, increasing industrial energy demand, and evolving renewable energy policies.
Key Challenges in the Osmotic Energy Market
The osmotic energy market faces several significant challenges that may limit its large-scale adoption and commercial viability. One of the primary constraints is the high levelized cost of energy (LCOE), driven by substantial capital expenditure requirements for specialized membranes and extensive infrastructure. This makes it less cost-competitive compared to mature renewable technologies such as solar and wind.
Additionally, operational issues such as membrane fouling and mineral scaling pose persistent challenges, leading to increased maintenance needs, reduced system efficiency over time, and higher operating costs. This impacts the long-term reliability of pressure-retarded osmosis (PRO) and reverse electrodialysis (RED) systems. Furthermore, the industry is hindered by an underdeveloped supply chain and a lack of standardized components, particularly for large-scale membranes and salinity management equipment. This results in higher procurement costs, extended lead times, and elevated project execution risks, further constraining the growth potential of the osmotic energy sector.
Osmotic Energy Market: Key Market Segmentation
Market Share by Technology
- Pressure Retarded Osmosis (PRO)
- Reverse Electrodialysis (RED)
Market Share by Application
- Power Generation
- Water Treatment and Desalination
Market Share by End User
- Commercial
- Industrial
- Residential
Market Share by Geographical Regions
- North America
- US
- Canada
- Mexico
- Rest of North America
- Europe
- Austria
- Belgium
- Denmark
- France
- Germany
- Ireland
- Italy
- Netherlands
- Norway
- Russia
- Spain
- Sweden
- Switzerland
- UK
- Rest of Europe
- Asia-Pacific
- Australia
- China
- India
- Japan
- New-Zealand
- Singapore
- South Korea
- Rest of Asia-Pacific
- Latin America
- Brazil
- Chile
- Colombia
- Venezuela
- Rest of Latin America
- Middle East and Africa (MEA)
- Egypt
- Iran
- Iraq
- Israel
- Kuwait
- Saudi Arabia
- UAE
- Rest of MEA
Example Players in Osmotic Energy Market
- Aqua Battery
- Aquastill
- DuPont
- Eco Wave Power
- Gradiant
- Minesto
- Ocean Grazer
- Pani
- REDstack
- REGENERATE
- Renergen
- Salinity Solutions
- SaltPower
- Sea6 Energy
- Statkraft
- SUEZ
- Sweetch Energy
Osmotic Energy Market: Report Coverage
The report on the osmotic energy market features insights on various sections, including:
- Market Sizing and Opportunity Analysis: An in-depth analysis of the osmotic energy market, focusing on key market segments, including [A] technology, [B] application, [C] end user, [D] geographical regions, and [E] key players.
- Competitive Landscape: A comprehensive analysis of the companies engaged in the osmotic energy market, based on several relevant parameters, such as [A] year of establishment, [B] company size, [C] location of headquarters and [D] ownership structure.
- Company Profiles: Elaborate profiles of prominent players engaged in the osmotic energy market, providing details on [A] location of headquarters, [B] company size, [C] company mission, [D] company footprint, [E] management team, [F] contact details, [G] financial information, [H] operating business segments, [I] product / technology portfolio, [J] recent developments, and an informed future outlook.
- Megatrends: An evaluation of ongoing megatrends in the osmotic energy industry.
- Patent Analysis: An insightful analysis of patents filed / granted in the osmotic energy domain, based on relevant parameters, including [A] type of patent, [B] patent publication year, [C] patent age and [D] leading players.
- Recent Developments: An overview of the recent developments made in the osmotic energy market, along with analysis based on relevant parameters, including [A] year of initiative, [B] type of initiative, [C] geographical distribution and [D] most active players.
- Porter's Five Forces Analysis: An analysis of five competitive forces prevailing in the osmotic energy market, including threats of new entrants, bargaining power of buyers, bargaining power of suppliers, threats of substitute products and rivalry among existing competitors.
- SWOT Analysis: An insightful SWOT framework, highlighting the strengths, weaknesses, opportunities and threats in the domain. Additionally, it provides Harvey ball analysis, highlighting the relative impact of each SWOT parameter.
Key Questions Answered in this Report
- What is the current and future market size?
- Who are the leading companies in this market?
- What are the growth drivers that are likely to influence the evolution of this market?
- What are the key partnership and funding trends shaping this industry?
- Which region is likely to grow at higher CAGR till 2040?
- How is the current and future market opportunity likely to be distributed across key market segments?
Reasons to Buy this Report
- Detailed Market Analysis: The report provides a comprehensive market analysis, offering detailed revenue projections of the overall market and its specific sub-segments. This information is valuable to both established market leaders and emerging entrants.
- In-depth Analysis of Trends: Stakeholders can leverage the report to gain a deeper understanding of the competitive dynamics within the market. Each report maps ecosystem activity across partnerships, funding, and patent landscapes to reveal growth hotspots and white spaces in the industry.
- Opinion of Industry Experts: The report features extensive interviews and surveys with key opinion leaders and industry experts to validate market trends mentioned in the report.
- Decision-ready Deliverables: The report offers stakeholders with strategic frameworks (Porter's Five Forces, value chain, SWOT), and complimentary Excel / slide packs with customization support.
Additional Benefits
- Complimentary Dynamic Excel Dashboards for Analytical Modules
- Exclusive 15% Free Content Customization
- Personalized Interactive Report Walkthrough with Our Expert Research Team
- Free Report Updates for Versions Older than 6-12 Months
TABLE OF CONTENTS
1. PROJECT OVERVIEW
- 1.1. Context
- 1.2. Project Objectives
2. RESEARCH METHODOLOGY
- 2.1. Chapter Overview
- 2.2. Research Assumptions
- 2.3. Database Building
- 2.3.1. Data Collection
- 2.3.2. Data Validation
- 2.3.3. Data Analysis
- 2.4. Project Methodology
- 2.4.1. Secondary Research
- 2.4.1.1. Annual Reports
- 2.4.1.2. Academic Research Papers
- 2.4.1.3. Company Websites
- 2.4.1.4. Investor Presentations
- 2.4.1.5. Regulatory Filings
- 2.4.1.6. White Papers
- 2.4.1.7. Industry Publications
- 2.4.1.8. Conferences and Seminars
- 2.4.1.9. Government Portals
- 2.4.1.10. Media and Press Releases
- 2.4.1.11. Newsletters
- 2.4.1.12. Industry Databases
- 2.4.1.13. Roots Proprietary Databases
- 2.4.1.14. Paid Databases and Sources
- 2.4.1.15. Social Media Portals
- 2.4.1.16. Other Secondary Sources
- 2.4.2. Primary Research
- 2.4.2.1. Introduction
- 2.4.2.2. Types
- 2.4.2.2.1. Qualitative
- 2.4.2.2.2. Quantitative
- 2.4.2.3. Advantages
- 2.4.2.4. Techniques
- 2.4.2.4.1. Interviews
- 2.4.2.4.2. Surveys
- 2.4.2.4.3. Focus Groups
- 2.4.2.4.4. Observational Research
- 2.4.2.4.5. Social Media Interactions
- 2.4.2.5. Stakeholders
- 2.4.2.5.1. Company Executives (CXOs)
- 2.4.2.5.2. Board of Directors
- 2.4.2.5.3. Company Presidents and Vice Presidents
- 2.4.2.5.4. Key Opinion Leaders
- 2.4.2.5.5. Research and Development Heads
- 2.4.2.5.6. Technical Experts
- 2.4.2.5.7. Subject Matter Experts
- 2.4.2.5.8. Scientists
- 2.4.2.5.9. Doctors and Other Healthcare Providers
- 2.4.2.6. Ethics and Integrity
- 2.4.2.6.1. Research Ethics
- 2.4.2.6.2. Data Integrity
- 2.4.3. Analytical Tools and Databases
- 2.4.1. Secondary Research
3. MARKET DYNAMICS
- 3.1. Forecast Methodology
- 3.1.1. Top-Down Approach
- 3.1.2. Bottom-Up Approach
- 3.1.3. Hybrid Approach
- 3.2. Market Assessment Framework
- 3.2.1. Total Addressable Market (TAM)
- 3.2.2. Serviceable Addressable Market (SAM)
- 3.2.3. Serviceable Obtainable Market (SOM)
- 3.2.4. Currently Acquired Market (CAM)
- 3.3. Forecasting Tools and Techniques
- 3.3.1. Qualitative Forecasting
- 3.3.2. Correlation
- 3.3.3. Regression
- 3.3.4. Time Series Analysis
- 3.3.5. Extrapolation
- 3.3.6. Convergence
- 3.3.7. Forecast Error Analysis
- 3.3.8. Data Visualization
- 3.3.9. Scenario Planning
- 3.3.10. Sensitivity Analysis
- 3.4. Key Considerations
- 3.4.1. Demographics
- 3.4.2. Market Access
- 3.4.3. Reimbursement Scenarios
- 3.4.4. Industry Consolidation
- 3.5. Robust Quality Control
- 3.6. Key Market Segmentations
- 3.7. Limitations
4. MACRO-ECONOMIC INDICATORS
- 4.1. Chapter Overview
- 4.2. Market Dynamics
- 4.2.1. Time Period
- 4.2.1.1. Historical Trends
- 4.2.1.2. Current and Forecasted Estimates
- 4.2.2. Currency Coverage
- 4.2.2.1. Overview of Major Currencies Affecting the Market
- 4.2.2.2. Impact of Currency Fluctuations on the Industry
- 4.2.3. Foreign Exchange Impact
- 4.2.3.1. Evaluation of Foreign Exchange Rates and Their Impact on Market
- 4.2.3.2. Strategies for Mitigating Foreign Exchange Risk
- 4.2.4. Recession
- 4.2.4.1. Historical Analysis of Past Recessions and Lessons Learnt
- 4.2.4.2. Assessment of Current Economic Conditions and Potential Impact on the Market
- 4.2.5. Inflation
- 4.2.5.1. Measurement and Analysis of Inflationary Pressures in the Economy
- 4.2.5.2. Potential Impact of Inflation on the Market Evolution
- 4.2.6. Interest Rates
- 4.2.6.1. Overview of Interest Rates and Their Impact on the Market
- 4.2.6.2. Strategies for Managing Interest Rate Risk
- 4.2.7. Commodity Flow Analysis
- 4.2.7.1. Type of Commodity
- 4.2.7.2. Origins and Destinations
- 4.2.7.3. Values and Weights
- 4.2.7.4. Modes of Transportation
- 4.2.8. Global Trade Dynamics
- 4.2.8.1. Import Scenario
- 4.2.8.2. Export Scenario
- 4.2.9. War Impact Analysis
- 4.2.9.1. Russian-Ukraine War
- 4.2.9.2. Israel-Hamas War
- 4.2.10. COVID Impact / Related Factors
- 4.2.10.1. Global Economic Impact
- 4.2.10.2. Industry-specific Impact
- 4.2.10.3. Government Response and Stimulus Measures
- 4.2.10.4. Future Outlook and Adaptation Strategies
- 4.2.11. Other Indicators
- 4.2.11.1. Fiscal Policy
- 4.2.11.2. Consumer Spending
- 4.2.11.3. Gross Domestic Product (GDP)
- 4.2.11.4. Employment
- 4.2.11.5. Taxes
- 4.2.11.6. R&D Innovation
- 4.2.11.7. Stock Market Performance
- 4.2.11.8. Supply Chain
- 4.2.11.9. Cross-Border Dynamics
- 4.2.1. Time Period
- 4.3. Concluding Remarks
5. EXECUTIVE SUMMARY
6. INTRODUCTION
- 6.1. Overview of Osmotic Energy Market
- 6.2. Application of Osmotic Energy
- 6.3. Advantages of Osmotic Energy
- 6.4. Challenges Associated with Polyols
- 6.5. Future Perspective
7. REGULATORY SCENARIO
8. COMPREHENSIVE DATABASE OF LEADING PLAYERS
9. COMPETITIVE LANDSCAPE
- 9.1. Chapter Overview
- 9.2. Osmotic Energy Market: Overall Market Landscape
- 9.2.1. Analysis by Year of Establishment
- 9.2.2. Analysis by Company Size
- 9.2.3. Analysis by Location of Headquarters
- 9.2.4. Analysis by Type of Company
- 9.2.5. Analysis by Technology
- 9.2.6. Analysis by End Use Industry
- 9.3. Key Findings
10. WHITE SPACE ANALYSIS
11. COMPANY COMPETITIVENESS ANALYSIS
12. STARTUP ECOSYSTEM ANALYSIS
- 12.1. Osmotic Energy Market: Startup Ecosystem Analysis
- 12.1.1. Analysis by Year of Establishment
- 12.1.2. Analysis by Company Size
- 12.1.3. Analysis by Location of Headquarters
- 12.1.4. Analysis by Ownership Type
- 12.1.5. Analysis by Technology
- 12.1.6. Analysis by End Use Industry
- 12.2. Key Findings
13. COMPANY PROFILES
- 13.1. Chapter Overview
- 13.2. Aqua Battery *
- 13.2.1. Company Overview
- 13.2.2. Company Mission
- 13.2.3. Company Footprint
- 13.2.4. Management Team
- 13.2.5. Contact Details
- 13.2.6. Financial Performance
- 13.2.7. Operating Business Segments
- 13.2.8. Service / Product Portfolio (project specific)
- 13.2.9. MOAT Analysis
- 13.2.10. Recent Developments and Future Outlook
- Similar details are presented for other companies mentioned below (based on information in the public domain)
- 13.3. Aquastill
- 13.4. DuPont
- 13.5. Eco Wave Power
- 13.6. Gradiant
- 13.7. Minesto
- 13.8. Ocean Grazer
- 13.9. Pani
- 13.10. REDstack
- 13.11. REGENERATE
- 13.12. Renergen
- 13.13. Salinity Solutions
- 13.14. SaltPower
- 13.15. Sea6 Energy
- 13.16. Statkraft
- 13.17. SUEZ
- 13.18. Sweetch Energy
14. MEGA TRENDS ANALYSIS
15. UNMET NEED ANALYSIS
16. PATENT ANALYSIS
17. RECENT DEVELOPMENTS
- 17.1. Chapter Overview
- 17.2. Recent Funding
- 17.3. Recent Partnerships
- 17.4. Other Recent Initiatives
18. GLOBAL OSMOTIC ENERGY MARKET
- 18.1. Chapter Overview
- 18.2. Key Assumptions and Methodology
- 18.3. Trends Disruption Impacting Market
- 18.4. Demand Side Trends
- 18.5. Supply Side Trends
- 18.6. Global Osmotic Energy Market Historical Trends (Since 2022) and Forecasted Estimates (Till 2040)
- 18.7. Multivariate Scenario Analysis
- 18.7.1. Conservative Scenario
- 18.7.2. Optimistic Scenario
- 18.8. Investment Feasibility Index
- 18.9. Key Market Segmentations
19. MARKET OPPORTUNITIES BASED ON TECHNOLOGY
- 19.1. Chapter Overview
- 19.2. Key Assumptions and Methodology
- 19.3. Revenue Shift Analysis
- 19.4. Market Movement Analysis
- 19.5. Penetration-Growth (P-G) Matrix
- 19.6. Osmotic Energy Market for Pressure Retarded Osmosis (PRO): Historical Trends (Since 2022) and Forecasted Estimates (Till 2040)
- 19.7. Osmotic Energy Market for Reverse Electrodialysis (RED): Historical Trends (Since 2022) and Forecasted Estimates (Till 2040)
- 19.8. Data Triangulation and Validation
- 19.8.1. Secondary Sources
- 19.8.2. Primary Sources
- 19.8.3. Statistical Modeling
20. MARKET OPPORTUNITIES BASED ON APPLICATION
- 20.1. Chapter Overview
- 20.2. Key Assumptions and Methodology
- 20.3. Revenue Shift Analysis
- 20.4. Market Movement Analysis
- 20.5. Penetration-Growth (P-G) Matrix
- 20.6. Osmotic Energy Market for Power Generation: Historical Trends (Since 2022) and Forecasted Estimates (Till 2040)
- 20.7. Osmotic Energy Market for Water Treatment and Desalination: Historical Trends (Since 2022) and Forecasted Estimates (Till 2040)
- 20.8. Data Triangulation and Validation
- 20.8.1. Secondary Sources
- 20.8.2. Primary Sources
- 20.8.3. Statistical Modeling
21. MARKET OPPORTUNITIES BASED ON END USER
- 21.1. Chapter Overview
- 21.2. Key Assumptions and Methodology
- 21.3. Revenue Shift Analysis
- 21.4. Market Movement Analysis
- 21.5. Penetration-Growth (P-G) Matrix
- 21.6. Osmotic Energy Market for Commercial: Historical Trends (Since 2022) and Forecasted Estimates (Till 2040)
- 21.7. Osmotic Energy Market for Industrial: Historical Trends (Since 2022) and Forecasted Estimates (Till 2040)
- 21.8. Osmotic Energy Market for Residential: Historical Trends (Since 2022) and Forecasted Estimates (Till 2040)
- 21.9. Data Triangulation and Validation
- 21.9.1. Secondary Sources
- 21.9.2. Primary Sources
- 21.9.3. Statistical Modeling
22. MARKET OPPORTUNITIES FOR OSMOTIC ENERGY IN NORTH AMERICA
- 22.1. Chapter Overview
- 22.2. Key Assumptions and Methodology
- 22.3. Revenue Shift Analysis
- 22.4. Market Movement Analysis
- 22.5. Penetration-Growth (P-G) Matrix
- 22.6. Osmotic Energy Market in North America: Historical Trends (Since 2022) and Forecasted Estimates (Till 2040)
- 22.6.1. Osmotic Energy Market in the US: Historical Trends (Since 2022) and Forecasted Estimates (Till 2040)
- 22.6.2. Osmotic Energy Market in Canada: Historical Trends (Since 2022) and Forecasted Estimates (Till 2040)
- 22.6.3. Osmotic Energy Market in Mexico: Historical Trends (Since 2022) and Forecasted Estimates (Till 2040)
- 22.6.4. Osmotic Energy Market in Rest of North America: Historical Trends (Since 2022) and Forecasted Estimates (Till 2040)
- 22.7. Data Triangulation and Validation
23. MARKET OPPORTUNITIES FOR OSMOTIC ENERGY IN EUROPE
- 23.1. Chapter Overview
- 23.2. Key Assumptions and Methodology
- 23.3. Revenue Shift Analysis
- 23.4. Market Movement Analysis
- 23.5. Penetration-Growth (P-G) Matrix
- 23.6. Osmotic Energy Market in Europe: Historical Trends (Since 2022) and Forecasted Estimates (Till 2040)
- 23.6.1. Osmotic Energy Market in Austria: Historical Trends (Since 2022) and Forecasted Estimates (Till 2040)
- 23.6.2. Osmotic Energy Market in Belgium: Historical Trends (Since 2022) and Forecasted Estimates (Till 2040)
- 23.6.3. Osmotic Energy Market in Denmark: Historical Trends (Since 2022) and Forecasted Estimates (Till 2040)
- 23.6.4. Osmotic Energy Market in France: Historical Trends (Since 2022) and Forecasted Estimates (Till 2040)
- 23.6.5. Osmotic Energy Market in Germany: Historical Trends (Since 2022) and Forecasted Estimates (Till 2040)
- 23.6.6. Osmotic Energy Market in Ireland: Historical Trends (Since 2022) and Forecasted Estimates (Till 2040)
- 23.6.7. Osmotic Energy Market in Italy: Historical Trends (Since 2022) and Forecasted Estimates (Till 2040)
- 23.6.8. Osmotic Energy Market in the Netherlands: Historical Trends (Since 2022) and Forecasted Estimates (Till 2040)
- 23.6.9. Osmotic Energy Market in Norway: Historical Trends (Since 2022) and Forecasted Estimates (Till 2040)
- 23.6.10. Osmotic Energy Market in Russia: Historical Trends (Since 2022) and Forecasted Estimates (Till 2040)
- 23.6.11. Osmotic Energy Market in Spain: Historical Trends (Since 2022) and Forecasted Estimates (Till 2040)
- 23.6.12. Osmotic Energy Market in Sweden: Historical Trends (Since 2022) and Forecasted Estimates (Till 2040)
- 23.6.13. Osmotic Energy Market in Switzerland: Historical Trends (Since 2022) and Forecasted Estimates (Till 2040)
- 23.6.14. Osmotic Energy Market in the UK: Historical Trends (Since 2022) and Forecasted Estimates (Till 2040)
- 23.6.15. Osmotic Energy Market in Rest of Europe: Historical Trends (Since 2022) and Forecasted Estimates (Till 2040)
- 23.7. Data Triangulation and Validation
24. MARKET OPPORTUNITIES FOR OSMOTIC ENERGY IN ASIA-PACIFIC
- 24.1. Chapter Overview
- 24.2. Key Assumptions and Methodology
- 24.3. Revenue Shift Analysis
- 24.4. Market Movement Analysis
- 24.5. Penetration-Growth (P-G) Matrix
- 24.6. Osmotic Energy Market in Asia-Pacific: Historical Trends (Since 2022) and Forecasted Estimates (Till 2040)
- 24.6.1. Osmotic Energy Market in China: Historical Trends (Since 2022) and Forecasted Estimates (Till 2040)
- 24.6.2. Osmotic Energy Market in India: Historical Trends (Since 2022) and Forecasted Estimates (Till 2040)
- 24.6.3. Osmotic Energy Market in Japan: Historical Trends (Since 2022) and Forecasted Estimates (Till 2040)
- 24.6.4. Osmotic Energy Market in Singapore: Historical Trends (Since 2022) and Forecasted Estimates (Till 2040)
- 24.6.5. Osmotic Energy Market in South Korea: Historical Trends (Since 2022) and Forecasted Estimates (Till 2040)
- 24.6.6. Osmotic Energy Market in Rest of Asia-Pacific: Historical Trends (Since 2022) and Forecasted Estimates (Till 2040)
- 24.7. Data Triangulation and Validation
25. MARKET OPPORTUNITIES FOR OSMOTIC ENERGY IN LATIN AMERICA
- 25.1. Chapter Overview
- 25.2. Key Assumptions and Methodology
- 25.3. Revenue Shift Analysis
- 25.4. Market Movement Analysis
- 25.5. Penetration-Growth (P-G) Matrix
- 25.6. Osmotic Energy Market in Latin America: Historical Trends (Since 2022) and Forecasted Estimates (Till 2040)
- 25.6.1. Osmotic Energy Market in Argentina: Historical Trends (Since 2022) and Forecasted Estimates (Till 2040)
- 25.6.2. Osmotic Energy Market in Brazil: Historical Trends (Since 2022) and Forecasted Estimates (Till 2040)
- 25.6.3. Osmotic Energy Market in Chile: Historical Trends (Since 2022) and Forecasted Estimates (Till 2040)
- 25.6.4. Osmotic Energy Market in Colombia Historical Trends (Since 2022) and Forecasted Estimates (Till 2040)
- 25.6.5. Osmotic Energy Market in Venezuela: Historical Trends (Since 2022) and Forecasted Estimates (Till 2040)
- 25.6.6. Osmotic Energy Market in Rest of Latin America: Historical Trends (Since 2022) and Forecasted Estimates (Till 2040)
- 25.7. Data Triangulation and Validation
26. MARKET OPPORTUNITIES FOR OSMOTIC ENERGY IN MIDDLE EAST AND AFRICA (MEA)
- 26.1. Chapter Overview
- 26.2. Key Assumptions and Methodology
- 26.3. Revenue Shift Analysis
- 26.4. Market Movement Analysis
- 26.5. Penetration-Growth (P-G) Matrix
- 26.6. Osmotic Energy Market in Middle East and Africa (MEA): Historical Trends (Since 2022) and Forecasted Estimates (Till 2040)
- 26.6.1. Osmotic Energy Market in Egypt: Historical Trends (Since 2022) and Forecasted Estimates (Till 2040)
- 26.6.2. Osmotic Energy Market in Iran: Historical Trends (Since 2022) and Forecasted Estimates (Till 2040)
- 26.6.3. Osmotic Energy Market in Iraq: Historical Trends (Since 2022) and Forecasted Estimates (Till 2040)
- 26.6.4. Osmotic Energy Market in Israel: Historical Trends (Since 2022) and Forecasted Estimates (Till 2040)
- 26.6.5. Osmotic Energy Market in Kuwait: Historical Trends (Since 2022) and Forecasted Estimates (Till 2040)
- 26.6.6. Osmotic Energy Market in Saudi Arabia: Historical Trends (Since 2022) and Forecasted Estimates (Till 2040)
- 26.6.7. Osmotic Energy Market in United Arab Emirates (UAE): Historical Trends (Since 2022) and Forecasted Estimates (Till 2040)
- 26.6.8. Osmotic Energy Market in Rest of MEA: Historical Trends (Since 2022) and Forecasted Estimates (Till 2040)
- 26.7. Data Triangulation and Validation
27. MARKET CONCENTRATION ANALYSIS: DISTRIBUTION BY LEADING PLAYERS
28. ADJACENT MARKET ANALYSIS
29. KEY WINNING STRATEGIES
30. PORTER'S FIVE FORCES ANALYSIS
31. SWOT ANALYSIS
32. VALUE CHAIN ANALYSIS
33. ROOTS STRATEGIC RECOMMENDATIONS
- 33.1. Chapter Overview
- 33.2. Key Business-related Strategies
- 33.2.1. Research & Development
- 33.2.2. Product Manufacturing
- 33.2.3. Commercialization / Go-to-Market
- 33.2.4. Sales and Marketing
- 33.3. Key Operations-related Strategies
- 33.3.1. Risk Management
- 33.3.2. Workforce
- 33.3.3. Finance
- 33.3.4. Others
34. INSIGHTS FROM PRIMARY RESEARCH
35. REPORT CONCLUSION
36. TABULATED DATA
37. LIST OF COMPANIES AND ORGANIZATIONS
 能源與永續發展產業現況:2026年第一季回顧
 全球交易能源市場預測至2034年:按組件、技術、應用、最終用戶和地區分類
 能源與永續發展產業現況:第四季回顧
 能源與永續性產業現況 - 第三季回顧
 分散式發電市場-全球產業規模、佔有率、趨勢、機會及預測(細分、按技術、按組件、按最終用戶、按燃料類型、按地區、按競爭,2020-2030 年預測)
 能源前景比較:以美國和歐洲主要公司的未來前景為基準
 能源產業的CX成長機會(2024-2025)
 營運商 RAN 架構選項:對能耗的影響
 能源/電力:競爭和市場情報訂閱
 EnerMonthly:每月能源數據庫