


 |
市場調查報告書
商品編碼
2072873
軟體能耗分析:市場佔有率分析、產業趨勢與統計、成長預測(2026-2031)Software Energy Consumption Analytics - Market Share Analysis, Industry Trends & Statistics, Growth Forecasts (2026 - 2031) |
||||||

※ 本網頁內容可能與最新版本有所差異。詳細情況請與我們聯繫。
據 Mordor Intelligence 稱,2025 年軟體能源消耗分析市值為 9.8 億美元,預計到 2031 年將達到 23 億美元,2026 年至 2031 年的複合年成長率為 15.48%。
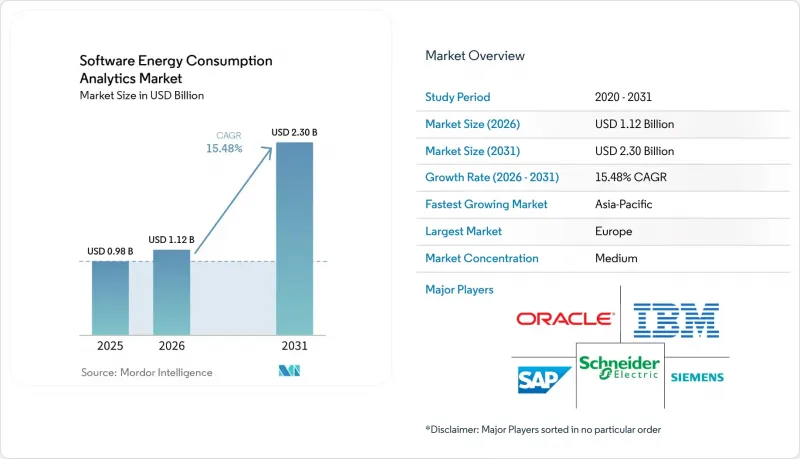
本報告按部署類型(雲端部署、本地部署、混合部署)、組件(軟體、服務)、應用(能源視覺化和監控、應用能源最佳化等)、最終用戶產業(IT和電信、銀行、金融服務和保險、工業製造、能源和公共產業等)以及地區進行細分。市場預測以美元計價。
全球軟體能耗分析市場趨勢與洞察
不斷上漲的公用事業成本和強制性節能措施
關於能源效率的法規正從政策目標轉向營運要求,這加劇了軟體能源消耗分析市場買家的緊迫性。修訂後的歐盟能源效率指令要求成員國在2025年10月前將其條款納入本國法律,從而縮短了大規模能源用戶的合規期限。第11條規定,年能源消耗量超過85太焦耳(TJ)的公司必須實施ISO 50001認證的能源管理體系,年能源消耗量超過10太焦耳(TJ)的公司必須定期進行能源審計。這些義務使得在眾多地點維持符合審計要求的高品質手動追蹤變得困難,因此,自動化監控、報告和記錄工具的價值日益凸顯。此類平台的實施將把能源報告從一次性任務轉變為常規工作流程,從而促進軟體能源消耗分析市場建立更長期的訂閱週期。
智慧電錶和物聯網遙測技術的快速普及
隨著智慧電錶和物聯網的普及,企業能夠收集和分析的跨建築、工廠和分散式場所的能源消耗資料量日益成長。這對軟體能耗分析市場具有重大意義,因為更高頻的電錶資料能夠實現負載分析、異常檢測、基準測試和設備級模式識別。這種超越簡單月度帳單記錄的轉變正在改變買家的期望,用戶需要近乎即時的可見性,而不是靜態的、事後報告。這種變化也提高了軟體設計的標準,供應商需要提供更好的過濾、優先排序和工作流程工具,以便負責人能夠根據資料採取行動,而不會被大量的警報資訊淹沒。這種需求的影響在亞太地區的大規模部署市場最為顯著,隨著計量設備的普及,該地區軟體能耗分析市場的未來買家群體也不斷擴大。
傳統IT與OT整合的複雜性
傳統操作技術(OT) 仍是軟體能耗分析市場推廣應用的最大障礙之一。許多工業設施仍在運作過時的控制系統和專有協議,這些系統和協議並非為與現代企業分析層持續連接而設計。因此,買家通常需要中間件、分階段遷移計劃和臨時並行運行,才能依賴即時資料饋送,從而導致專案成本增加。在監管嚴格的環境中,這個問題更為嚴重,因為安全審查和營運核准可能會使部署計畫延遲數月。雖然已經連接到通用歷史資料庫和 OT 資料儲存的供應商在接觸這些客戶時具有優勢,但整合帶來的摩擦仍然阻礙整個軟體能耗分析市場的推廣應用。
細分市場分析
到2025年,基於雲端的部署將佔據66.74%的市場佔有率,在軟體能耗分析市場佔據主導地位。此結果反映了企業營運整體向SaaS(軟體即服務)的廣泛轉變。雲端平台能夠更有效率地處理大規模計量資料集,並支援持續更新,無需現場基礎設施升級。它們還簡化了與物聯網設備、收費系統、資料倉儲和永續性報告工具的連接。這些優勢使得雲端成為尋求快速部署和降低擁有成本的買家的首選。
混合模式預計將在2026年至2031年間以16.25%的複合年成長率成長,成為軟體能耗分析市場中成長最快的模式。對於那些既想在本地保留敏感的營運技術(OT)數據,又想利用雲端人工智慧和基準測試服務的企業而言,混合模式尤其具有吸引力。 Bidgely的UtilityAI Pro正是順應了這個趨勢,它讓公共產業能夠在AWS、Snowflake和Databricks等自有雲環境中運行客製化的人工智慧模型,同時也能利用共用平台的功能。隨著SAP和Oracle等供應商不斷強調雲端原生藍圖,並推出功能更強大的分析和人工智慧層,本地部署工具的相對重要性正在下降。
到2025年,軟體將佔總組件的70.12%,在能源消耗分析市場佔據最大佔有率。這一結果與供應商透過持續的授權費和平台訂閱費從該類別中獲得收入的現實相符。與一次性專案工作相比,透過軟體更容易管理持續的資料擷取、模型更新和法規變更。這一趨勢也表明,買家在擴展服務使用規模之前,優先考慮可擴展的記錄系統。在軟體能源消耗分析產業,這一趨勢確保了平台管理仍然是供應商策略的核心。
在軟體能耗分析市場,服務領域預計將在2026年至2031年間以15.92%的複合年成長率成長,因為越來越多的客戶尋求供應商支持,以完成部署、分析和報告工作流程。隨著合規計畫迫使企業在多個設施中整合技術部署和營運變更,這一趨勢尤其顯著。施耐德電機於2026年1月發布了Resource Advisor+和Sera AI代理,將軟體交付與能源專業知識相結合,進一步加速了這一融合趨勢。由於軟體能耗分析產業中同時具備能源系統和資料模型知識的熟練團隊仍然有限,服務領域的成長機會預計將持續存在。
區域分析
到2025年,歐洲將佔據軟體能耗分析市場34.56%的佔有率,成為最大的區域市場。該地區的領先地位源於具有法律約束力的能源效率目標、強制性的永續發展報告以及成熟的數位基礎設施,這些都為分析技術的快速應用提供了支持。修訂後的《歐洲能源效率指令》(EED)要求成員國在2025年10月前將其條款納入本國法律,透過強制性審計和管理體系,加大了大規模能源使用者的合規壓力。德國、英國、法國和義大利構成了核心需求叢集,其中德國尤其重要,因為EED相關要求正逐步融入各國的合規實踐。該地區的買家越來越傾向於選擇具備可審計報告能力、嚴格的溫室氣體(GHG)運算能力以及符合ISO 50001工作流程標準的供應商。
北美地區持續佔據軟體能耗分析市場第二大佔有率。美國是重要的創新中心,GridPoint、Bidgely、Uplight、Sense Labs 和 EnergyCAP 等供應商都引領著整個軟體能耗分析市場中眾多商業和公共產業應用案例的發展。 2026 年 5 月,Oracle 展示了該地區企業級應用的深度滲透,並以 Exelon 和 El Paso Electric 等公共產業為例,說明了人工智慧、雲端運算和客戶主導創新的成果。加拿大市場需求穩定,而墨西哥和南美洲部分地區的市場正在興起,這得益於大規模區域集團管理的工業效率提升專案和跨境部署。
預計亞太地區2026年至2031年複合年成長率將達16.34%,成為軟體能源消耗分析市場成長最快的地區。中國和印度正透過脫碳政策、智慧電錶部署和大型企業的數位轉型,推動這一市場的大部分成長。日本、韓國和澳洲也透過電網現代化、虛擬電廠(VPP)活動以及更精細化的電力市場運作來支援市場需求。 Wipro和Kongsberg Digital於2026年4月宣佈建立合作夥伴關係,為能源和公共產業行業提供人工智慧驅動的數位雙胞胎解決方案,凸顯了該地區先進分析能力的快速普及。中東和非洲市場仍處於起步階段,但由於海灣國家主導的能源計畫以及南非和奈及利亞的監管合規要求,能源消耗分析軟體市場的未來買家群體正在逐步擴大。
其他好處:
- Excel格式的市場預測(ME)表
- 3個月的分析師支持
目錄
第1章:引言
- 研究假設和市場定義
- 調查範圍
第2章:調查方法
第3章執行摘要
第4章 市場狀況
- 市場概覽
- 市場促進因素
- 不斷飆升的公用事業成本和強制實施節能措施帶來的壓力。
- 智慧電錶和物聯網遙測技術的快速普及
- 遷移到雲端原生能源智慧平台
- 引入人工智慧驅動的負載、異常和基準分析。
- 資料中心對電力最佳化和永續性報告的需求
- 利用數位雙胞胎技術對大型企業軟體進行能耗分析
- 市場限制因素
- 傳統IT與OT整合的複雜性。
- 能源標準數據品質不佳且缺乏標準化
- 網路安全、隱私和資料主權的限制
- 專業實施人員短缺
- 產業價值鏈分析
- 監理情勢
- 宏觀經濟因素對市場的影響
- 技術展望
- 波特五力分析
第5章 市場規模與成長預測
- 按實現類型
- 基於雲端的
- 本地部署
- 混合型
- 按組件
- 軟體
- 服務
- 透過使用
- 能源可視化和監測
- 應用能源最佳化
- 雲端和資料中心最佳化
- 預測和預測分析
- 永續性和碳智慧
- 按最終用途行業分類
- IT/通訊
- BFSI
- 工業製造
- 能源與公共產業
- 石油和天然氣
- 零售與電子商務
- 食品飲料製造業
- 建築和基礎設施
- 政府/公共部門
- 其他
- 按地區
- 北美洲
- 美國
- 加拿大
- 墨西哥
- 南美洲
- 巴西
- 其他南美國家
- 歐洲
- 德國
- 英國
- 法國
- 義大利
- 西班牙
- 俄羅斯
- 其他歐洲國家
- 亞太地區
- 中國
- 印度
- 日本
- 韓國
- 澳洲
- 其他亞太國家
- 中東
- 土耳其
- 沙烏地阿拉伯
- 阿拉伯聯合大公國
- 其他中東國家
- 非洲
- 南非
- 奈及利亞
- 其他非洲國家
- 北美洲
第6章 競爭情勢
- 市場集中度
- 策略趨勢
- 市佔率分析
- 公司簡介
- Oracle Corporation
- International Business Machines Corporation
- SAP SE
- SAS Institute Inc.
- Teradata Corporation
- C3.ai, Inc.
- Palantir Technologies Inc.
- Verdigris Technologies
- Aspen Technology, Inc.
- Schneider Electric SE
- AVEVA Group Limited
- Eaton Corporation
- Bidgely, Inc.
- EnergyCAP, LLC
- GridPoint, Inc.
- Uplight, Inc.
- Energyworx BV
- Spacewell International NV
- Sense Labs, Inc.
- Smarter Grid Solutions Limited
第7章 市場機會與未來展望
According to Mordor Intelligence, the software energy consumption analytics market was valued at USD 0.98 billion in 2025 and is forecast to reach USD 2.30 billion by 2031, advancing at a CAGR of 15.48% from 2026 to 2031.
This report is Segmented by Deployment Mode (Cloud-Based, On-Premises, and Hybrid), Component (Software, and Services), Application (Energy Visibility and Monitoring, Application Energy Optimization, and More), End-Use Industry (IT and Telecom, BFSI, Industrial Manufacturing, Energy and Utilities, and More), and Geography. The Market Forecasts are Provided in Terms of Value (USD).
Global Software Energy Consumption Analytics Market Trends and Insights
Rising Utility Cost Pressure and Energy Efficiency Mandates
Energy efficiency rules have shifted from policy targets to operational requirements, driving greater buyer urgency in the software energy consumption analytics market. The recast EU Energy Efficiency Directive required member states to transpose its provisions into national law by October 2025, which tightened compliance timelines for large energy users. Article 11 requires enterprises that consume more than 85 TJ annually to implement ISO 50001-certified energy management systems, while those that consume more than 10 TJ must complete periodic energy audits. Those obligations make manual tracking across many sites difficult to maintain at audit-ready quality, which raises the value of automated monitoring, reporting, and record retention tools. Once these platforms are installed, energy reporting becomes a recurring workflow rather than a one-time exercise, which supports longer subscription cycles in the software energy consumption analytics market.
Rapid Smart Meter And IoT Telemetry Expansion
Smart meter and IoT rollouts are increasing the amount of consumption data that enterprises can capture and review across buildings, plants, and distributed sites. This matters for the software energy consumption analytics market because higher-frequency meter feeds support load profiling, anomaly detection, benchmarking, and device-level pattern recognition. The move beyond simple monthly billing records is changing buyer expectations, as users now want near-real-time visibility rather than static retrospective reports. That shift also raises the bar for software design, since vendors need better filtering, prioritization, and workflow tools so operators can act on the data without getting buried in alerts. The demand effect is strongest in large rollout markets across Asia-Pacific, where metering expansion is widening the future buyer base for the software energy consumption analytics market.
Legacy IT and OT Integration Complexity
Legacy operational technology remains one of the clearest deployment barriers in the software energy consumption analytics market. Many industrial sites still run older control systems and proprietary protocols that were not designed for continuous connection with modern enterprise analytics layers. That raises project cost because buyers often need middleware, staged migration plans, and temporary parallel operations before they can trust live data feeds. The problem is even harder in regulated environments, where security reviews and operating approvals can add months to deployment timelines. Vendors that already connect to common historians and OT data stores enter these accounts with an advantage, but integration friction still slows adoption across the software energy consumption analytics market.
Other drivers and restraints analyzed in the detailed report include:
- Shift Toward Cloud Native Energy Intelligence Platforms
- AI Enabled Load, Anomaly, and Benchmark Analytics Adoption
- Weak Data Quality And Energy Baseline Standardization
For complete list of drivers and restraints, kindly check the Table Of Contents.
Segment Analysis
Cloud-based deployment held a 66.74% share in 2025, giving it the leading position in the software energy consumption analytics market. This result reflects the wider move to software-as-a-service across enterprise operations. Cloud platforms handle large meter datasets more efficiently and support continuous updates without site-level infrastructure refreshes. They also simplify connections with IoT devices, billing systems, data warehouses, and sustainability reporting tools. That combination has made the cloud the default choice for buyers who want faster rollout and lower ownership costs.
Hybrid deployment is projected to grow at a 16.25% CAGR from 2026 to 2031, which makes it the fastest-growing mode in the software energy consumption analytics market. The appeal is strongest among organizations that want to keep sensitive OT data on-site while still using cloud AI and benchmarking services. Bidgely's UtilityAI Pro reflected this direction by enabling utilities to run custom AI models in their own cloud environments, including AWS, Snowflake, and Databricks, while still leveraging shared platform capabilities. On-premises tools are losing relative weight as vendors such as SAP and Oracle continue to favor cloud-native roadmaps with stronger analytics and AI layers.
Software accounted for 70.12% of the component mix in 2025, giving it the largest share in the software energy consumption analytics market. That outcome aligns with how vendors monetize the category through recurring licenses and platform subscriptions. Continuous data ingestion, model updates, and regulatory changes are easier to manage through software than through one-time project work. The lead also shows that buyers are prioritizing scalable systems of record before they expand service intensity. In the software energy consumption analytics industry, that bias keeps platform control at the center of vendor strategy.
Services are projected to grow at a 15.92% CAGR from 2026 to 2031 as more customers ask vendors to support deployment, analytics, and reporting workflows in the software energy consumption analytics market. This pattern is strongest where compliance programs force companies to combine technology rollout with operating changes across many facilities. Schneider Electric pushed this mix further in January 2026 when it launched Resource Advisor+ with the Sera AI agent, which blended software delivery with embedded energy expertise. The services opportunity should remain durable because skilled teams that understand both energy systems and data models are still limited across the software energy consumption analytics industry.
Complete Report Scope:
- By Deployment Mode
- Cloud Based
- On Premises
- Hybrid
- By Component
- Software
- Services
- By Application
- Energy Visibility and Monitoring
- Application Energy Optimization
- Cloud and Data Center Optimization
- Forecasting and Predictive Analytics
- Sustainability and Carbon Intelligence
- By End-Use Industry
- IT and Telecom
- BFSI
- Industrial Manufacturing
- Energy and Utilities
- Oil and Gas
- Retail and E-Commerce
- Food and Beverage Manufacturing
- Construction and Infrastructure
- Government and Public Sector
- Other End-User Industries
- By Geography
- North America
- United States
- Canada
- Mexico
- South America
- Brazil
- Rest of South America
- Europe
- Germany
- United Kingdom
- France
- Italy
- Spain
- Russia
- Rest of Europe
- Asia-Pacific
- China
- India
- Japan
- South Korea
- Australia
- Rest of Asia-Pacific
- Middle East
- Turkey
- Saudi Arabia
- United Arab Emirates
- Rest of Middle East
- Africa
- South Africa
- Nigeria
- Rest of Africa
- North America
Geography Analysis
Europe held 34.56% of the software energy consumption analytics market share in 2025, making it the largest regional market. The region's lead came from binding energy efficiency targets, mandatory sustainability reporting, and a mature digital base that supports faster analytics adoption. The recast EED required member states to transpose its provisions by October 2025, which increased compliance pressure on large energy users through audit and management system obligations. Germany, the United Kingdom, France, and Italy formed the core demand cluster, with Germany standing out as EED-related requirements moved into national compliance practice. Buyers in this region are increasingly screening vendors for audit-ready reporting, disciplined GHG accounting, and support for ISO 50001 workflows.
North America remained the second-largest geography in the software energy consumption analytics market. The United States is the main innovation center, with vendors such as GridPoint, Bidgely, Uplight, Sense Labs, and EnergyCAP shaping many of the commercial and utility use cases seen across the software energy consumption analytics market. Oracle highlighted utilities such as Exelon and El Paso Electric in May 2026 for results driven by AI, cloud, and customer innovation, reflecting the depth of enterprise adoption in the region. Canada adds steady demand, while Mexico and parts of South America are emerging through industrial efficiency programs and cross-border deployments managed by larger regional groups.
Asia-Pacific is projected to grow at a 16.34% CAGR from 2026 to 2031, which makes it the fastest-growing geography in the software energy consumption analytics market. China and India are driving much of that expansion through decarbonization policies, smart meter rollouts, and large-enterprise digitization. Japan, South Korea, and Australia are also supporting demand through grid modernization, virtual power plant activity, and more granular electricity market operation. Wipro and Kongsberg Digital announced an April 2026 partnership to deliver AI-powered digital twin solutions for the energy and utilities sector, underscoring how quickly advanced analytics capabilities are spreading across the region. The Middle East and Africa remain earlier-stage markets, but sovereign energy programs in the Gulf and compliance-led demand in South Africa and Nigeria are gradually widening the future buyer base for the software energy consumption analytics market.
- Oracle Corporation
- International Business Machines Corporation
- SAP SE
- SAS Institute Inc.
- Teradata Corporation
- C3.ai, Inc.
- Palantir Technologies Inc.
- Verdigris Technologies
- Aspen Technology, Inc.
- Schneider Electric SE
- AVEVA Group Limited
- Eaton Corporation
- Bidgely, Inc.
- EnergyCAP, LLC
- GridPoint, Inc.
- Uplight, Inc.
- Energyworx B.V.
- Spacewell International NV
- Sense Labs, Inc.
- Smarter Grid Solutions Limited
Additional Benefits:
- The market estimate (ME) sheet in Excel format
- 3 months of analyst support
TABLE OF CONTENTS
1 INTRODUCTION
- 1.1 Study Assumptions and Market Definition
- 1.2 Scope of the Study
2 RESEARCH METHODOLOGY
3 EXECUTIVE SUMMARY
4 MARKET LANDSCAPE
- 4.1 Market Overview
- 4.2 Market Drivers
- 4.2.1 Rising Utility Cost Pressure and Energy Efficiency Mandates
- 4.2.2 Rapid Smart Meter and IoT Telemetry Expansion
- 4.2.3 Shift Toward Cloud Native Energy Intelligence Platforms
- 4.2.4 AI Enabled Load, Anomaly, and Benchmark Analytics Adoption
- 4.2.5 Data Center Power Optimization and Sustainability Reporting Demand
- 4.2.6 Digital Twin Based Software Energy Profiling in Large Enterprises
- 4.3 Market Restraints
- 4.3.1 Legacy IT and OT Integration Complexity
- 4.3.2 Weak Data Quality and Energy Baseline Standardization
- 4.3.3 Cybersecurity, Privacy, and Data Sovereignty Constraints
- 4.3.4 Specialized Implementation Talent Shortage
- 4.4 Industry Value Chain Analysis
- 4.5 Regulatory Landscape
- 4.6 Impact of Macroeconomic Factors on the Market
- 4.7 Technological Outlook
- 4.8 Porter's Five Forces Analysis
- 4.8.1 Bargaining Power of Suppliers
- 4.8.2 Bargaining Power of Buyers
- 4.8.3 Threat of New Entrants
- 4.8.4 Threat of Substitutes
- 4.8.5 Intensity of Competitive Rivalry
5 MARKET SIZE AND GROWTH FORECASTS (VALUE)
- 5.1 By Deployment Mode
- 5.1.1 Cloud Based
- 5.1.2 On Premises
- 5.1.3 Hybrid
- 5.2 By Component
- 5.2.1 Software
- 5.2.2 Services
- 5.3 By Application
- 5.3.1 Energy Visibility and Monitoring
- 5.3.2 Application Energy Optimization
- 5.3.3 Cloud and Data Center Optimization
- 5.3.4 Forecasting and Predictive Analytics
- 5.3.5 Sustainability and Carbon Intelligence
- 5.4 By End-Use Industry
- 5.4.1 IT and Telecom
- 5.4.2 BFSI
- 5.4.3 Industrial Manufacturing
- 5.4.4 Energy and Utilities
- 5.4.5 Oil and Gas
- 5.4.6 Retail and E-Commerce
- 5.4.7 Food and Beverage Manufacturing
- 5.4.8 Construction and Infrastructure
- 5.4.9 Government and Public Sector
- 5.4.10 Other End-User Industries
- 5.5 By Geography
- 5.5.1 North America
- 5.5.1.1 United States
- 5.5.1.2 Canada
- 5.5.1.3 Mexico
- 5.5.2 South America
- 5.5.2.1 Brazil
- 5.5.2.2 Rest of South America
- 5.5.3 Europe
- 5.5.3.1 Germany
- 5.5.3.2 United Kingdom
- 5.5.3.3 France
- 5.5.3.4 Italy
- 5.5.3.5 Spain
- 5.5.3.6 Russia
- 5.5.3.7 Rest of Europe
- 5.5.4 Asia-Pacific
- 5.5.4.1 China
- 5.5.4.2 India
- 5.5.4.3 Japan
- 5.5.4.4 South Korea
- 5.5.4.5 Australia
- 5.5.4.6 Rest of Asia-Pacific
- 5.5.5 Middle East
- 5.5.5.1 Turkey
- 5.5.5.2 Saudi Arabia
- 5.5.5.3 United Arab Emirates
- 5.5.5.4 Rest of Middle East
- 5.5.6 Africa
- 5.5.6.1 South Africa
- 5.5.6.2 Nigeria
- 5.5.6.3 Rest of Africa
- 5.5.1 North America
6 COMPETITIVE LANDSCAPE
- 6.1 Market Concentration
- 6.2 Strategic Moves
- 6.3 Market Share Analysis
- 6.4 Company Profiles (includes Global Level Overview, Market Level Overview, Core Segments, Financials as available, Strategic Information, Market Rank/Share, Products and Services, Recent Developments)
- 6.4.1 Oracle Corporation
- 6.4.2 International Business Machines Corporation
- 6.4.3 SAP SE
- 6.4.4 SAS Institute Inc.
- 6.4.5 Teradata Corporation
- 6.4.6 C3.ai, Inc.
- 6.4.7 Palantir Technologies Inc.
- 6.4.8 Verdigris Technologies
- 6.4.9 Aspen Technology, Inc.
- 6.4.10 Schneider Electric SE
- 6.4.11 AVEVA Group Limited
- 6.4.12 Eaton Corporation
- 6.4.13 Bidgely, Inc.
- 6.4.14 EnergyCAP, LLC
- 6.4.15 GridPoint, Inc.
- 6.4.16 Uplight, Inc.
- 6.4.17 Energyworx B.V.
- 6.4.18 Spacewell International NV
- 6.4.19 Sense Labs, Inc.
- 6.4.20 Smarter Grid Solutions Limited
7 MARKET OPPORTUNITIES AND FUTURE OUTLOOK
- 7.1 White Space and Unmet Need Assessment

 能源產業趨勢與機會概況
 能源與永續發展產業現況:2026年第二季回顧教育科技的永續性
 滲透能市場:按技術、應用、最終用戶、地區和主要企業分類:行業趨勢和全球市場預測(至2040年)
 能源與永續發展產業現況:2026年第一季回顧
 全球交易能源市場預測至2034年:按組件、技術、應用、最終用戶和地區分類
 能源與永續發展產業現況:第四季回顧
 能源與永續性產業現況 - 第三季回顧
 分散式發電市場-全球產業規模、佔有率、趨勢、機會及預測(細分、按技術、按組件、按最終用戶、按燃料類型、按地區、按競爭,2020-2030 年預測)能源產業的CX成長機會(2024-2025)