


 |
市場調查報告書
商品編碼
1920860
ADC細胞毒性有效載荷和彈頭市場(第二版):市場趨勢及至2035年預測 - 按產品類型、有效載荷類型、有效載荷/彈頭子類別和地區劃分ADC Cytotoxic Payloads and Warheads Market (2nd Edition): Trends and Forecast Til 2035 - Distribution Type of Product, Type of Payload, Sub-Category of Payload / Warhead and Geographical Regions |
||||||
ADC細胞毒性有效載荷和彈頭市場 - 概述
Roots Analysis 預測,ADC細胞毒性有效載荷和彈頭市場在預測期內(至2035年)將以4.9%的複合年增長率增長,從目前的4.693億美元增長到2035年的7.202億美元。
ADC細胞毒性有效載荷和彈頭市場 - 成長與趨勢
抗體藥物偶聯物 (ADC) 細胞毒性藥物和彈頭是現代標靶癌症治療的重要組成部分,其研發旨在精準遞送高效化合物,同時降低整體毒性。透過化學優化和引入先進的連接子系統,這些有效載荷提高了抗體藥物偶聯物 (ADC) 的治療效果,使製藥公司能夠開發更高效、更具靶向性的癌症療法。
ADC 有效載荷領域正透過利用有效載荷化學、偶聯技術和連接子技術的進步來提高安全性和有效性,從而實現快速成長。在癌症治療創新和不斷擴充的 ADC 相關療法研發管線的推動下,ADC 細胞毒性有效載荷和彈頭市場正經歷顯著增長。細胞毒性有效載荷和彈頭對 ADC 的療效至關重要,它們能夠將強效抗癌藥物精準遞送至腫瘤細胞,同時保護健康組織。隨著 ADC 在臨床試驗中展現出令人鼓舞的結果,並持續獲準用於腫瘤治療,預計該市場將持續成長。
成長驅動因素:市場擴張的策略驅動因素
連接子穩定性、有效載荷功效和靶向遞送系統的持續改進正在提高 ADC 的治療指數。這些進步使研究人員能夠在增強腫瘤清除的同時,減少對健康組織的傷害。這種精準的方法正在推動腫瘤學領域創新策略的出現,用於治療血液腫瘤和實體腫瘤。
此外,對包括DNA損傷劑和微管抑制劑在內的新一代有效載荷的需求不斷增長,正在推動生物製藥領域取得顯著進展。由於對標靶癌症治療的投資增加以及偶聯技術的持續進步,抗體藥物偶聯物(ADC)的有效載荷和彈頭市場正在經歷快速擴張。此外,新一代多彈頭抗體藥物偶聯物(ADC)的開發有望透過解決現有ADC療法的挑戰,顯著加速市場擴張。
市場挑戰:阻礙進展的重大障礙
ADC細胞毒性有效載荷和彈頭的開發需要管理高活性和高危險物質。這需要專門的隔離設施、嚴格的安全措施和化學專業知識來降低暴露風險。此外,複雜的偶聯方法帶來了可擴展性方面的挑戰,導致異質性、聚集、穩定性問題,以及難以在大規模生產中實現理想的藥物抗體比 (DAR)。此外,不斷上漲的研發成本和脆弱的原料供應鏈也限制了市場擴張。
ADC 細胞毒性有效載荷和彈頭市場 - 主要洞察
本報告深入分析了 ADC 細胞毒性有效載荷和彈頭市場的現狀,並指出了該行業的潛在成長機會。主要發現包括:
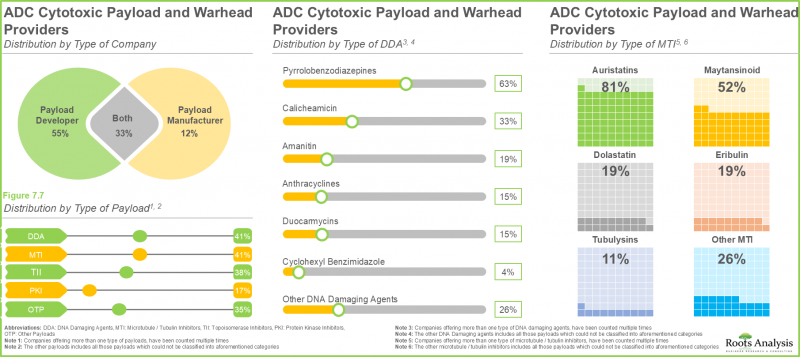
- 在當前市場格局中,約有 70 家供應商聲稱提供各種有效載荷,這些有效載荷正在不同的治療領域中使用或進行測試。
- 約 25% 的公司同時提供吡咯並苯二氮平類和奧瑞他汀類有效載荷。 這是由於兩種有效載荷均展現出強大的效力,並且能夠有效誘導分裂細胞和非分裂細胞死亡。
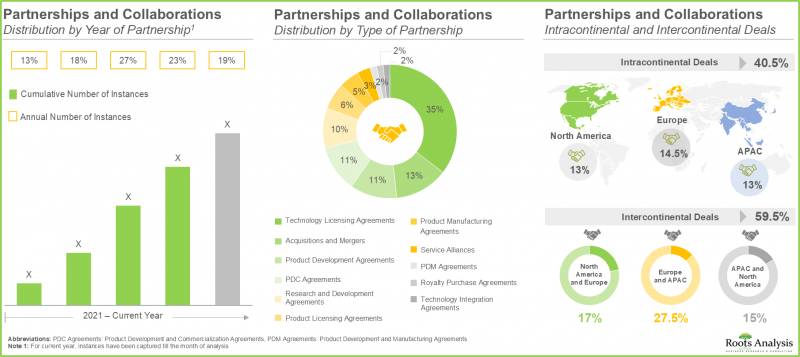
- 近年來,各利害關係人之間建立了多元化的合作關係,這反映了市場對該市場日益增長的興趣。事實上,約 70% 的交易是在過去三年內完成的。
- 為了滿足不斷增長的需求,55% 的公司正在實施產能擴張計劃,以加強其服務組合。
- 全球 ADC 酬載生產設施的裝置容量分佈廣泛,遍佈世界各地。其中大部分(40%)產能位於歐洲。
- 隨著多個臨床候選藥物預計將在全球範圍內商業化,對 ADC 有效載荷生產的需求可能會顯著增長。
- 在癌症發生率上升和有效載荷化學技術進步的推動下,市場正在快速發展,同時也面臨嚴格的監管和穩定性挑戰。
- 目前,北美在 ADC 細胞毒性有效載荷和彈頭市場中佔最大佔有率,其次是歐洲和亞太地區。
- 受美國領導企業 ADC 有效載荷和彈頭快速成功的推動,ADC 細胞毒性有效載荷和彈頭市場預計將以 6.7% 的複合年增長率增長。
- 北美 ADC 細胞毒性有效載荷和彈頭市場預計今年將達到 1.38 億美元。此外,拓樸異構酶 I 抑制劑在該市場中佔主導地位,佔了大部分市場佔有率。
抗體藥物偶聯物 (ADC) 細胞毒性有效載荷和彈頭市場
市場規模與機會分析依下列參數細分:
產品類型
- 已商業化的 ADC
- 臨床階段 ADC
有效載荷類型
- 拓樸異構酶抑制劑
- 微管蛋白抑制劑
- DNA 損傷劑
- 其他
酬載/彈頭子類別
- 拓樸異構酶 I 抑制劑
- 美登素類藥物
- 奧瑞他汀類藥物
- 其他
地理區域
- 北美
- 美國各州
- 加拿大
- 歐洲
- 德國
- 法國
- 義大利
- 英國
- 西班牙
- 亞太地區
- 中國
- 日本
- 澳大利亞
抗體偶聯藥物(ADC)細胞毒性有效載荷和彈頭市場 - 主要細分市場
臨床ADC的成長推動癌症治療
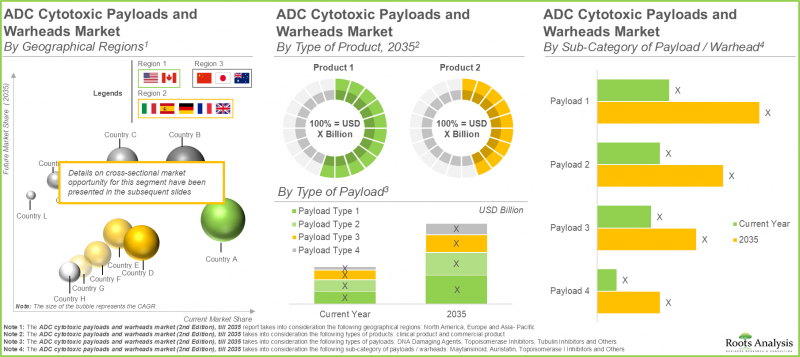
依產品類型劃分,ADC細胞毒性酬載和彈頭市場分為商業化ADC和臨床ADC。商業化ADC細分市場佔主導地位(90%),這主要得益於其療效和安全性所帶來的市場需求成長。此外,臨床階段ADC的複合年增長率(CAGR)預計將更高,顯示在整個預測期內存在巨大的成長機會。這一增長主要得益於獲批抗體偶聯藥物 (ADC) 數量的增加以及針對各種靶向適應症的持續研發。
拓樸異構酶抑制劑推動了 ADC 細胞毒性有效載荷細分市場的成長。
依有效載荷類型劃分,ADC 細胞毒性有效載荷和彈頭市場可分為拓樸異構酶抑制劑、微管蛋白抑制劑、DNA 損傷劑和其他類型。全球市場按不同類型的有效載荷進行細分,例如微管蛋白抑制劑、拓樸異構酶抑制劑和 DNA 損傷劑。預計今年拓樸異構酶抑制劑細分市場將佔最大的市場佔有率(約 70%)。這主要歸功於其抑制癌細胞DNA複製的關鍵功能,以及癌症發生率的上升、精準腫瘤學的進步和該領域研發投入的不斷增長。
拓樸異構酶I抑制劑可望引領抗體藥物偶聯物(ADC)有效載荷市場。
依有效載荷/彈頭細分,ADC細胞毒性有效載荷和彈頭市場可分為拓樸異構酶I抑制劑、美登素類藥物、奧瑞他汀類藥物和其他藥物。根據ADC細胞毒性有效載荷和彈頭市場預測,由於單株抗體、基因療法和個人化醫療等創新療法的日益普及,拓撲異構酶I抑制劑預計今年將佔市場主導地位(超過70%)。拓樸異構酶I抑制劑細分市場的主要驅動因素是抗體偶聯藥物(ADC)的核准,例如Enhertz(曲妥珠單抗delxecan)和Trodelvy(sacituzumab govitecan),它們分別利用了TOP1抑制劑delxecan(DXd)和SN-38。這些有效載荷透過抑制DNA複製和修復發揮強效抗癌藥物的作用。
按地區劃分的市場洞察
歐洲引領ADC細胞毒性有效載荷與彈頭市場
依地區劃分,ADC細胞毒性酬載和彈頭市場分為北美、歐洲和亞太地區。預計到2035年,歐洲的ADC細胞毒性有效載荷/彈頭市場將保持領先地位,約佔45%的市場佔有率。該地區佔主導地位的關鍵因素包括學術機構和企業之間的緊密合作、高效化合物的先進生產能力以及廣泛的智慧財產權活動。
主要研究概論
本市場報告中提出的觀點和見解也受到與業內主要利害關係人討論的影響。此市場報告包含以下利害關係人的詳細訪談記錄:
- 荷蘭某小型機構創辦人兼首席科學官
- 法國某大型機構市場總監
此外,該市場報告還包含以下第三方的討論記錄:
- 義大利某大型機構研發與GMP生產負責人
- 英國某大型機構科學業務發展經理及ADC負責人
- 美國某超大型機構政策分析師
ADC細胞毒性有效載荷和彈頭市場的主要參與者
- Abzena
- Axplora
- CARBOGEN AMCIS
- Cerbios-Pharma
- Eisai
- GeneQuantum
- Levena Biopharma
- MabPlex
- MilliporeSigma(默克)
- NJ Bio
- Synaffix
- 藥明康德
抗體偶聯藥物(ADC)細胞毒性有效載荷和彈頭市場 - 研究範圍
- 市場規模和機會分析:本報告對ADC細胞毒性有效載荷和彈頭市場進行了詳細分析,重點關注以下關鍵市場細分:[A] 產品類型,[B] 有效載荷,[C] 有效載荷/彈頭子類別,以及[D] 地理區域。
- 市場概況:基於多個相關參數,詳細概述了提供ADC細胞毒性有效載荷和彈頭的公司當前市場概況,這些參數包括成立年份、公司規模、總部所在地、公司類型、有效載荷類型、DNA損傷劑類型、微管/微管蛋白抑製劑類型、拓撲異構酶抑製劑類型、業務規模和治療領域類型。
- 競爭分析:對主要地區的抗體偶聯藥物(ADC)細胞毒性有效載荷和彈頭供應商進行深入的競爭分析。評估標準包括供應能力(經驗年資和公司規模)、產品組合實力(DNA損傷劑、微管/微管蛋白抑制劑、拓樸異構酶抑制劑、蛋白激酶抑制劑和其他有效載荷的數量,以及治療領域類型)和業務規模。
- 公司簡介:提供北美、歐洲和亞太地區ADC細胞毒性有效載荷和彈頭市場主要參與者的詳細簡介,內容涵蓋[A]成立年份、[B]總部所在地、[C]ADC細胞毒性有效載荷和彈頭產品組合、[D]近期發展以及[E]未來展望。
- 合作關係:分析該產業利害關係人之間的合作關係,分析標準包括[A]合作年份、[B]合作類型、[C]產品類型、[D]合作夥伴類型以及[E]最活躍的參與者。
- 近期擴張:分析近期旨在增強公司在抗體偶聯藥物(ADC)細胞毒性有效載荷和彈頭方面能力的擴張活動。分析基於以下參數:[A] 擴張年份,[B] 擴張類型(新建設施、現有設施擴建、產能擴張),以及 [C] 擴張的地理位置。
- 需求分析:基於目標患者群體、給藥頻率和劑量強度等各種參數,對全球基因療法的年度需求進行合理估算,考慮市售的ADC細胞毒性有效載荷和彈頭,以及評估ADC細胞毒性有效載荷和彈頭的臨床試驗。
- 產能分析:基於公開資訊以及來自一手和二手研究的見解,估算產業參與者ADC細胞毒性有效載荷和彈頭的組裝機產能。
- 市場影響分析:詳細分析可能影響ADC細胞毒性有效載荷和彈頭市場成長的因素。它還包括對[A]關鍵驅動因素、[B]潛在限制因素、[C]新興機會和[D]現有挑戰的識別和分析。
目錄
第一章:引言
第二章:研究方法
第三章:市場動態
- 章節概述
- 預測研究法
- 市場估值框架
- 預測工具與技術
- 關鍵考慮因素
- 局限性
第四章:宏觀經濟指標
- 章節概述
- 市場動態
- 結論
第五章:摘要整理
第六章:引言
- 章節概述
- 抗體藥物抗體偶聯物 (ADC) 概述
- ADC 的關鍵組成部分
- 細胞毒性有效載荷
- ADC 生產的關鍵步驟
- ADC 生產相關的技術挑戰
- ADC 酬載/彈頭合約生產的必要性
- 選擇合適的 ADC 生產合作夥伴的指南
- 細胞毒性藥物生產的監管考量
- 未來展望
第七章:市場概況:ADC 細胞毒性有效載荷與彈頭供應商
- 章節概述
- ADC 細胞毒性有效載荷和彈頭供應商:市場概況
第八章:競爭分析:ADC 細胞毒性酬載與彈頭供應商
- 章節概述
- 假設與關鍵資訊參數
- 研究方法
- 競爭分析:ADC細胞毒性有效載荷和彈頭供應商
第九章:公司簡介:ADC細胞毒性有效載荷和彈頭市場的主要參與者
- 章節概述
- CARBOGEN AMCIS
- Cerbios-Pharma
- Levena Biopharma
- MabPlex
- MilliporeSigma
- 藥明康德
第十章:公司簡介:ADC細胞毒性有效載荷和彈頭市場的其他主要參與者
- 章節概述
- Abzena
- Axplora
- Eisai
- GeneQuantum
- NJ Bio
- Synaffix
第11章:合作與夥伴關係
- 章節概述
- 合作模式
- ADC細胞毒性有效載荷和彈頭:合作與夥伴關係
第12章:近期擴張
- 章節概述
- ADC細胞毒性有效載荷和彈頭:近期擴張
第13章:產能分析:ADC細胞毒性酬載與彈頭製造
- 章節概述
- 關鍵資訊假設與研究方法
第十四章 需求分析:ADC 細胞毒性酬載與彈頭供應商
- 章節概述
- 需求驅動因素
- 關鍵假設與研究方法
- 全球 ADC 酬載年度需求量
第十五章 市場影響分析
- 市場驅動因素
- 市場限制因素
- 市場機遇
- 市場挑戰
第十六章 全球 ADC 細胞毒性酬載與彈頭市場
第十七章 ADC 細胞毒性有效載荷和彈頭市場(按產品類型劃分)
第十八章 ADC 細胞毒性有效載荷和彈頭
第19章 ADC細胞毒性有效載荷和彈頭市場(按有效載荷/彈頭子類別劃分)
第20章 ADC細胞毒性酬載與彈頭市場(依地區劃分)
第21章 市場機會分析:北美
第22章 市場機會分析:歐洲
第23章 市場機會分析:亞太地區
第24章 結論
第25章 高階主管見解
第26章 附錄1:表格資料
第27章 附錄2:公司列表和組織
ADC Cytotoxic Payloads and Warheads Market: Overview
As per Roots Analysis, the ADC cytotoxic payloads and warheads market is estimated to grow from USD 469.3 million in the current year to USD 720.2 million by 2035, at a CAGR of 4.9% during the forecast period, till 2035.
ADC Cytotoxic Payloads and Warheads Market: Growth and Trends
Antibody-drug conjugate (ADC) cytotoxic agents and warheads are essential elements in contemporary targeted cancer treatments, developed to provide highly effective compounds accurately while reducing overall toxicity. Through the incorporation of chemical optimization and advanced linker systems, these payloads improve the therapeutic efficacy of ADCs, allowing pharmaceutical firms to develop more efficient and targeted cancer therapies.
The ADC payloads field is growing swiftly by utilizing advancements in payload chemistry, conjugation techniques, and linker technologies to enhance safety and efficacy profiles. The market for ADC cytotoxic payloads and warheads is seeing substantial growth, fueled by innovations in cancer therapies and an expanding pipeline of ADC-related treatments. Cytotoxic payloads and warheads are crucial for the effectiveness of ADCs, as they guarantee the precise delivery of powerful anti-cancer drugs to tumor cells, protecting healthy tissues. The market is set to grow as ADCs demonstrate encouraging outcomes in clinical studies and receive ongoing approval for application in oncology.
Growth Drivers: Strategic Enablers of Market Expansion
Continuous improvements in linker stability, payload effectiveness, and targeted delivery systems are boosting the therapeutic index of ADCs. These advancements enable researchers to enhance tumor-eradicating effectiveness while reducing harm to healthy tissues. This precision method is driving innovative strategies in oncology for managing both blood cancers and solid tumors.
Moreover, the increasing requirement for next-generation payload categories, including DNA-damaging compounds and microtubule inhibitors, is prompting significant progress within the biopharmaceutical sector. The ADC payloads and warheads market is witnessing rapid market expansion due to increased investment in targeted cancer therapies and the ongoing advancement of conjugation technologies. Additionally, the advancement of next-generation multi-warhead antibody-drug conjugates (ADCs) is likely to greatly enhance market expansion by addressing shortcomings of existing ADC treatments.
Market Challenges: Critical Barriers Impeding Progress
The development of ADC cytotoxic payloads and warheads requires managing extremely potent, dangerous substances that necessitate specialized containment facilities, stringent safety measures, and chemical knowledge to mitigate exposure risks. Further, scalability challenges stem from intricate conjugation methods, resulting in heterogeneity, aggregation, stability concerns, and obstacles in attaining ideal drug-to-antibody ratios (DAR) at high volumes. In addition, elevated development expenses, raw material supply chain weaknesses also limit market expansion.
ADC Cytotoxic Payloads and Warheads Market: Key Insights
The report delves into the current state of the ADC cytotoxic payloads and warheads market and identifies potential growth opportunities within industry. Some key findings from the report include:
- The current market landscape features a presence of close to 70 providers that claim to offer broad range of payloads, which are being used or tested across various therapeutic areas.
- Around 25% companies offer both pyrrolobenzodiazepine and auristatin payloads, owing to their exceptional potency and demonstrated ability to induce effective cell death in both dividing and non-dividing cells.
- The rising interest in this market is reflected from the diverse partnerships established among various stakeholders in the recent past; in fact, close to 70% of deals were inked in the last three years.
- 55% of the companies have undertaken capacity expansion initiatives to strengthen their service portfolio in order to keep pace with the growing demand.
- The global installed ADC payload manufacturing capacity is well distributed across different facilities worldwide; majority (40%) of this capacity is installed in facilities located in Europe.
- The demand for ADC payload manufacturing is likely to increase significantly as several clinical candidates are expected to be commercialized across various regions of the globe.
- Fueled by rising cancer prevalence and advancements in payload chemistry, the market is rapidly evolving while also contending with stringent regulations and stability challenges.
- Currently, North America captures the largest share within the ADC cytotoxic payloads and warheads market, followed by Europe and Asia-Pacific.
- Driven by the rapid success of ADC payloads and warheads by prominent players in the US, the ADC cytotoxic payloads and warheads market is expected to grow at CAGR of 6.7%.
- The ADC cytotoxic payloads and warheads market in North America is expected to be worth USD 138 million in the current year; further, within this market, topoisomerase I inhibitors dominates by capturing the majority share.
ADC Cytotoxic Payloads and Warheads Market
The market sizing and opportunity analysis has been segmented across the following parameters:
Type of Product
- Commercialized ADCs
- Clinical ADCs
Type of Payload
- Topoisomerase Inhibitors
- Tubulin Inhibitors
- DNA Damaging Agents
- Others
Sub-Category of Payload / Warhead
- Topoisomerase I inhibitors
- Maytansinoid
- Auristatin
- Others
Geographical Regions
- North America
- US
- Canada
- Europe
- Germany
- France
- Italy
- UK
- Spain
- Asia-Pacific
- China
- Japan
- Australia
ADC Cytotoxic Payloads and Warheads Market: Key Segments
Growth of Clinical ADCs is Propelling Cancer Treatment
In terms of type of product, the ADC cytotoxic payloads and warheads market is segmented across commercialized and clinical ADCs. The commercial ADCs sub-segment leads the market (90%), fueled by rising demand for marketed ADCs due to their effectiveness and safety characteristics. Additionally, clinical ADCs are expected to experience a greater CAGR, indicating significant growth opportunities throughout the forecast timeframe. This expansion results from the rising approval of ADCs and their continuous investigation across various target indications.
Topoisomerase Inhibitors Propel Expansion in ADC Cytotoxic Payload Sector
In terms of type of payload, the ADC cytotoxic payloads and warheads market is segmented across topoisomerase inhibitors, tubulin inhibitors, DNA damaging agents and others. The global market is segmented across different types of payloads, such as tubulin inhibitors, topoisomerase inhibitors, DNA damaging agents, and others. The topoisomerase inhibitors sub-segment holds the largest share (~70%) this year. This their crucial function in interfering with DNA replication in cancer cells, combined with the increasing incidence of cancer, progress in precision oncology, and heightened investments in research and development in this field.
Topoisomerase I Inhibitors Set to Lead ADC Payload Industry
In terms of sub-category of payload / warhead, the ADC cytotoxic payloads and warheads market is segmented across topoisomerase I inhibitors, maytansinoid, auristatin and others. As per the ADC cytotoxic payloads and warheads market forecast, the growing use of innovative treatments, such as monoclonal antibodies, gene therapies, and personalized medicine, is expected to enable topoisomerase I inhibitors to lead (>70%) the market in the current year. A key factor in the topoisomerase I inhibitor sub-segment is the approval of ADCs like Enhertu (trastuzumab deruxtecan) and Trodelvy (sacituzumab govitecan), which utilize TOP1 inhibitors deruxtecan (DXd) and SN-38, respectively. These payloads serve as powerful anti-cancer agents by disrupting DNA replication and repair.
Market Regional Insights
Europe Dominates the ADC Cytotoxic Payloads and Warheads Market
In terms of geography, the ADC cytotoxic payloads and warheads market is segmented across North America, Europe and Asia-Pacific. By 2035, the market for ADC cytotoxic payloads / warheads in Europe is expected to lead, holding approximately 45% of the market share. Crucial factors that contribute to the dominance of the region include strong collaborations between academic institutions and businesses, advanced manufacturing abilities for effective compounds, and extensive activity in intellectual property.
Primary Research Overview
The opinions and insights presented in the market report were also influenced by discussions held with senior stakeholders in the industry. The market report includes detailed transcripts of interviews conducted with the following individuals:
- Founder and Chief Scientific Officer, Small Organization, Netherlands
- Market Director, Large Organization, France
In addition, the market report includes transcripts of the following other third-party discussions:
- Head of Development and GMP Manufacturing, Large Organization, Italy
- Scientific business development manager and ADC lead, Large Organization, United Kingdom
- Policy Analyst, Very Large Organization, United States
Example Players in ADC Cytotoxic Payloads and Warheads Market
- Abzena
- Axplora
- CARBOGEN AMCIS
- Cerbios-Pharma
- Eisai
- GeneQuantum
- Levena Biopharma
- MabPlex
- MilliporeSigma (Merck)
- NJ Bio
- Synaffix
- WuXi STA
ADC Cytotoxic Payloads and Warheads Market: Research Coverage
- Market Sizing and Opportunity Analysis: The report features an in-depth analysis of the ADC cytotoxic payloads and warheads market, focusing on key market segments, including [A] type of product, [B] payload, [C] sub-category of payload / warhead, and [D] geographical regions.
- Market Landscape: A detailed overview of the current market landscape of companies offering ADC cytotoxic payloads and warheads, based on several relevant parameters, including year of establishment, company size, location of the headquarters, type of company, type of payload, type of DNA damaging agents, type of microtubule / tubulin inhibitors, type of topoisomerase inhibitors, scale of operation and type of therapeutic area.
- Company Competitiveness Analysis: An insightful company competitiveness analysis of ADC cytotoxic payloads and warheads providers (across key geographical regions), based on supplier strength (in terms of years of experience and company size), and portfolio strength (in terms of number of DNA damaging agents, microtubule / tubulin inhibitors, topoisomerase inhibitors, protein kinase inhibitors, other payloads, and type of therapeutic area) and scale of operation.
- Company Profiles: In-depth profiles of prominent players North America, Europe and Asia-Pacific that are engaged in the ADC cytotoxic payloads and warheads market based on [A] year of establishment, [B] location of headquarters, [C] ADC cytotoxic payloads and warheads portfolio, [D] recent developments and [E] an informed future outlook.
- Partnerships and Collaborations: An analysis of the partnerships inked between stakeholders engaged in this industry, based on several parameters, such as [A] year of partnership, [B] type of partnership, [C] type of product, [D] type of partner and [E] most active players.
- Recent Expansions: An analysis of the recent expansions undertaken by various companies in order to augment their respective capabilities related to ADC cytotoxic payloads and warheads, based on several parameters, such as [A] year of expansion, [B] type of expansion (new facility establishment, facility expansion, and capacity expansion), and [C] geographical location of the expansion.
- Demand Analysis: An informed estimate of the global annual demand for gene therapies, taking into account the marketed ADC cytotoxic payloads and warheads and clinical trials evaluating ADC cytotoxic payloads and warheads, based on various parameters, such as target patient population, dosing frequency and dose strength.
- Capacity Analysis: An estimate of the overall installed ADC cytotoxic payloads and warheads manufacturing capacity of industry players based on the information available in the public domain, and insights generated from both secondary and primary research.
- Market Impact Analysis: An in-depth analysis of the factors that can impact the growth of ADC cytotoxic payloads and warheads market. It also features identification and analysis of [A] key drivers, [B] potential restraints, [C] emerging opportunities, and [D] existing challenges.
Key Questions Answered in this Report
- Which are the leading companies in the ADC cytotoxic payloads and warheads market?
- Which region dominates the ADC cytotoxic payloads and warheads market?
- What are the key trends observed in the ADC cytotoxic payloads and warheads market?
- What factors are likely to influence the evolution of this market?
- What are the primary challenges faced by ADC cytotoxic payloads and warheads developers?
- What is the current and future market size?
- What is the CAGR of this market?
- How is the current and future market opportunity likely to be distributed across key market segments?
Reasons to Buy this Report
- The report provides a comprehensive market analysis, offering detailed revenue projections of the overall market and its specific sub-segments. This information is valuable to both established market leaders and emerging entrants.
- The report offers stakeholders a comprehensive overview of the market, including key drivers, barriers, opportunities, and challenges. This information empowers stakeholders to stay abreast of market trends and make data-driven decisions to capitalize on growth prospects.
- The report can aid businesses in identifying future opportunities in any sector. It also helps in understanding if those opportunities are worth pursuing.
- The report helps in identifying customer demand by understanding the needs, preferences, and behavior of the target audience in order to tailor products or services effectively.
- The report equips new entrants with requisite information regarding a particular market to help them build successful business strategies.
- The report allows for more effective communication with the audience and in building strong business relations.
Additional Benefits
- Complimentary Excel Data Packs for all Analytical Modules in the Report
- 15% Free Content Customization
- Detailed Report Walkthrough Session with Research Team
- Free Updated report if the report is 6-12 months old or older
TABLE OF CONTENTS
1. PREFACE
- 1.1. Introduction
- 1.2. Market Share Insights
- 1.3. Key Market Insights
- 1.4. Report Coverage
- 1.5. Key Questions Answered
- 1.6. Chapter Outlines
2. RESEARCH METHODOLOGY
- 2.1. Chapter Overview
- 2.2. Research Assumptions
- 2.2.1. Market Landscape and Market Trends
- 2.2.2. Market Forecast and Opportunity Analysis
- 2.2.3. Comparative Analysis
- 2.3. Database Building
- 2.3.1. Data Collection
- 2.3.2. Data Validation
- 2.3.3. Data Analysis
- 2.4. Project Methodology
- 2.4.1. Secondary Research
- 2.4.1.1. Annual Reports
- 2.4.1.2. Academic Research Papers
- 2.4.1.3. Company Websites
- 2.4.1.4. Investor Presentations
- 2.4.1.5. Regulatory Filings
- 2.4.1.6. White Papers
- 2.4.1.7. Industry Publications
- 2.4.1.8. Conferences and Seminars
- 2.4.1.9. Government Portals
- 2.4.1.10. Media and Press Releases
- 2.4.1.11. Newsletters
- 2.4.1.12. Industry Databases
- 2.4.1.13. Roots Proprietary Databases
- 2.4.1.14. Paid Databases and Sources
- 2.4.1.15. Social Media Portals
- 2.4.1.16. Other Secondary Sources
- 2.4.2. Primary Research
- 2.4.2.1. Types of Primary Research
- 2.4.2.1.1. Qualitative Research
- 2.4.2.1.2. Quantitative Research
- 2.4.2.1.3. Hybrid Approach
- 2.4.2.2. Advantages of Primary Research
- 2.4.2.3. Techniques for Primary Research
- 2.4.2.3.1. Interviews
- 2.4.2.3.2. Surveys
- 2.4.2.3.3. Focus Groups
- 2.4.2.3.4. Observational Research
- 2.4.2.3.5. Social Media Interactions
- 2.4.2.4. Key Opinion Leaders Considered in Primary Research
- 2.4.2.4.1. Company Executives (CXOs)
- 2.4.2.4.2. Board of Directors
- 2.4.2.4.3. Company Presidents and Vice Presidents
- 2.4.2.4.4. Research and Development Heads
- 2.4.2.4.5. Technical Experts
- 2.4.2.4.6. Subject Matter Experts
- 2.4.2.4.7. Scientists
- 2.4.2.4.8. Doctors and Other Healthcare Providers
- 2.4.2.5. Ethics and Integrity
- 2.4.2.5.1. Research Ethics
- 2.4.2.5.2. Data Integrity
- 2.4.2.1. Types of Primary Research
- 2.4.3. Analytical Tools and Databases
- 2.4.1. Secondary Research
- 2.5. Robust Quality Control
3. MARKET DYNAMICS
- 3.1. Chapter Overview
- 3.2. Forecast Methodology
- 3.2.1. Top-down Approach
- 3.2.2. Bottom-up Approach
- 3.2.3. Hybrid Approach
- 3.3. Market Assessment Framework
- 3.3.1. Total Addressable Market (TAM)
- 3.3.2. Serviceable Addressable Market (SAM)
- 3.3.3. Serviceable Obtainable Market (SOM)
- 3.3.4. Currently Acquired Market (CAM)
- 3.4. Forecasting Tools and Techniques
- 3.4.1. Qualitative Forecasting
- 3.4.2. Correlation
- 3.4.3. Regression
- 3.4.4. Extrapolation
- 3.4.5. Convergence
- 3.4.6. Sensitivity Analysis
- 3.4.7. Scenario Planning
- 3.4.8. Data Visualization
- 3.4.9. Time Series Analysis
- 3.4.10. Forecast Error Analysis
- 3.5. Key Considerations
- 3.5.1. Demographics
- 3.5.2. Government Regulations
- 3.5.3. Reimbursement Scenarios
- 3.5.4. Market Access
- 3.5.5. Supply Chain
- 3.5.6. Industry Consolidation
- 3.5.7. Pandemic / Unforeseen Disruptions Impact
- 3.6. Limitations
4. MACRO-ECONOMIC INDICATORS
- 4.1. Chapter Overview
- 4.2. Market Dynamics
- 4.2.1. Time Period
- 4.2.1.1. Historical Trends
- 4.2.1.2. Current and Forecasted Estimates
- 4.2.2. Currency Coverage
- 4.2.2.1. Major Currencies Affecting the Market
- 4.2.2.2. Factors Affecting Currency Fluctuations on the Industry
- 4.2.2.3. Impact of Currency Fluctuations on the Industry
- 4.2.3. Foreign Currency Exchange Rate
- 4.2.3.1. Impact of Foreign Exchange Rate Volatility on the Market
- 4.2.3.2. Strategies for Mitigating Foreign Exchange Risk
- 4.2.4. Recession
- 4.2.4.1. Assessment of Current Economic Conditions and Potential Impact on the Market
- 4.2.4.2. Historical Analysis of Past Recessions and Lessons Learnt
- 4.2.5. Inflation
- 4.2.5.1. Measurement and Analysis of Inflationary Pressures in the Economy
- 4.2.5.2. Potential Impact of Inflation on the Market Evolution
- 4.2.6. Interest Rates
- 4.2.6.1. Interest Rates and Their Impact on the Market
- 4.2.6.2. Strategies for Managing Interest Rate Risk
- 4.2.7. Commodity Flow Analysis
- 4.2.7.1. Type of Commodity
- 4.2.7.2. Origins and Destinations
- 4.2.7.3. Values and Weights
- 4.2.7.4. Modes of Transportation
- 4.2.8. Global Trade Dynamics
- 4.2.8.1. Import Scenario
- 4.2.8.2. Export Scenario
- 4.2.8.3. Trade Policies
- 4.2.8.4. Strategies for Mitigating the Risks Associated with Trade Barriers
- 4.2.8.5. Impact of Trade Barriers on the Market
- 4.2.9. War Impact Analysis
- 4.2.9.1. Russian-Ukraine War
- 4.2.9.2. Israel-Hamas War
- 4.2.10. COVID Impact / Related Factors
- 4.2.10.1. Global Economic Impact
- 4.2.10.2. Industry-specific Impact
- 4.2.10.3. Government Response and Stimulus Measures
- 4.2.10.4. Future Outlook and Adaptation Strategies
- 4.2.11. Other Indicators
- 4.2.11.1. Fiscal Policy
- 4.2.11.2. Consumer Spending
- 4.2.11.3. Gross Domestic Product (GDP)
- 4.2.11.4. Employment
- 4.2.11.5. Taxes
- 4.2.11.6. Stock Market Performance
- 4.2.11.7. Cross-Border Dynamics
- 4.2.1. Time Period
- 4.3. Conclusion
5. EXECUTIVE SUMMARY
- 5.1. Executive Summary: Market Landscape
- 5.2. Executive Summary: Market Trends
- 5.3. Executive Summary: Market Forecast and Opportunity Analysis
6. INTRODUCTION
- 6.1. Chapter Overview
- 6.2. Overview of Antibody Drug Conjugate (ADC)
- 6.3. Key Components of ADCs
- 6.4. Cytotoxin Payloads
- 6.5. Key Steps in ADC Manufacturing
- 6.6. Technical Challenges Associated with ADC Manufacturing
- 6.7. Need for Contract Manufacturing of ADC Payloads / Warheads
- 6.8. Guidelines for Selecting a Suitable Partner for Manufacturing CD
- 6.9. Regulatory Considerations for Cytotoxic Drugs Manufacturing
- 6.10. Future Outlook
7. MARKET LANDSCAPE: ADC CYTOTOXIC PAYLOAD AND WARHEAD PROVIDERS
- 7.1. Chapter Overview
- 7.2. ADC Cytotoxic Payload and Warhead Providers: Market Landscape
- 7.2.1. Analysis by Year of Establishment
- 7.2.2. Analysis by Company Size
- 7.2.3. Analysis by Location of Headquarters (Region)
- 7.2.4. Analysis by Location of Headquarters (Country)
- 7.2.5. Analysis by Location of Facilities
- 7.2.6. Analysis by Type of Company
- 7.2.7. Analysis by Type of DNA Damaging Agent
- 7.2.8. Analysis by Type of Microtubule / Tubulin Inhibitors
- 7.2.9. Analysis by Type of Topoisomerase Inhibitors
- 7.2.10. Analysis by Scale of Operation
- 7.2.11. Analysis by Type of Therapeutic Area
8. COMPANY COMPETITIVENESS ANALYSIS: ADC CYTOTOXIC PAYLOADS AND WARHEADS PROVIDERS
- 8.1. Chapter Overview
- 8.2. Assumptions and Key Parameters
- 8.3. Methodology
- 8.4. Company Competitiveness Analysis: ADC Cytotoxic Payloads and Warheads Providers
- 8.4.1. ADC Cytotoxic Payloads and Warheads Providers based in North America
- 8.4.2. ADC Cytotoxic Payloads and Warheads Providers based in Europe
- 8.4.3. ADC Cytotoxic Payloads and Warheads Providers based in Asia-Pacific
9. COMPANY PROFILES: LEADING PLAYERS IN THE ADC CYTOTOXIC PAYLOADS AND WARHEADS MARKET
- 9.1. Chapter Overview
- 9.2. CARBOGEN AMCIS
- 9.2.1. Company Overview
- 9.2.2. Financial Information
- 9.2.3. Recent Developments and Future Outlook
- 9.3. Cerbios-Pharma
- 9.3.1. Company Overview
- 9.3.2. Recent Developments and Future Outlook
- 9.4. Levena Biopharma
- 9.4.1. Company Overview
- 9.4.2. Recent Developments and Future Outlook
- 9.5. MabPlex
- 9.5.1. Company Overview
- 9.5.2. Recent Developments and Future Outlook
- 9.6. MilliporeSigma
- 9.6.1. Company Overview
- 9.6.2. Financial Information
- 9.6.3. Recent Developments and Future Outlook
- 9.7. WuXi STA
- 9.7.1. Company Overview
- 9.7.2. Financial Information
- 9.7.3. Recent Developments and Future Outlook
10. COMPANY PROFILES: OTHER LEADING PLAYERS IN THE ADC CYTOTOXIC PAYLOADS AND WARHEADS MARKET
- 10.1. Chapter Overview
- 10.2. Abzena
- 10.2.1. Company Overview
- 10.3. Axplora
- 10.3.1. Company Overview
- 10.4. Eisai
- 10.4.1. Company Overview
- 10.5. GeneQuantum
- 10.5.1. Company Overview
- 10.6. NJ Bio
- 10.6.1. Company Overview
- 10.7. Synaffix
- 10.7.1. Company Overview
11. PARTNERSHIPS AND COLLABORATIONS
- 11.1. Chapter Overview
- 11.2. Partnership Models
- 11.3. ADC Cytotoxic Payloads and Warheads: Partnerships and Collaborations
- 11.3.1. Analysis by Year of Partnership
- 11.3.2. Analysis by Type of Partnership
- 11.3.3. Analysis by Year and Type of Partnership
- 11.3.4. Analysis by Type of Partner
- 11.3.5. Most Active Players: Analysis by Number of Partnerships
- 11.3.6. Analysis by Geography
- 11.3.6.1. Analysis by Country
- 11.3.6.2. Analysis by Continent
12. RECENT EXPANSIONS
- 12.1. Chapter Overview
- 12.2. ADC Cytotoxic Payloads and Warheads: Recent Expansions
- 12.2.1. Analysis by Year of Expansion
- 12.2.2. Analysis by Type of Expansion
- 12.2.3. Analysis by Year and Type of Expansion
- 12.2.4. Most Active Players: Analysis by Number of Recent Expansions
- 12.2.5. Analysis by Location of Expansion
- 12.2.5.1. Analysis by Country
- 12.2.5.2. Analysis by Continent
13. CAPACITY ANALYSIS: ADC CYTOTOXIC PAYLOADS AND WARHEADS MANUFACTURING
- 13.1. Chapter Overview
- 13.2. Key Assumptions and Methodology
- 13.2.1. Analysis by Range of Installed Capacity
- 13.2.2. Analysis by Scale of Operation
- 13.2.3. Analysis by Location of ADC Cytotoxic Payloads and Warheads Facility
14. DEMAND ANALYSIS: ADC CYTOTOXIC PAYLOADS AND WARHEADS PROVIDERS
- 14.1. Chapter Overview
- 14.2. Demand Drivers
- 14.3. Key Assumptions and Methodology
- 14.4. Global Annual Demand for ADC Payloads
- 14.4.1. Global Clinical Demand for ADC Payloads
- 14.4.1.1. Analysis by Type of Payload
- 14.4.1.2. Analysis by Phase of Development
- 14.4.2. Global Commercial Demand for ADC Payloads
- 14.4.1.1. Analysis by Payload
- 14.4.1.2. Analysis by Type of Payload
- 14.4.1.2. Analysis by Therapeutic Area
- 14.4.1.3. Analysis by Geographical Regions
- 14.4.1. Global Clinical Demand for ADC Payloads
15. MARKET IMPACT ANALYSIS
- 15.1. Market Drivers
- 15.2. Market Restraints
- 15.3. Market Opportunities
- 15.4. Market Challenges
16. GLOBAL ADC CYTOTOXIC PAYLOADS AND WARHEADS MARKET
- 16.1. Chapter Overview
- 16.2. Assumptions and Methodology
- 16.3. Global ADC Cytotoxic Payloads and Warheads Market, Historical Trends (Since 2023) and Forecasted Estimates (Till 2035)
- 16.3.1. Scenario Analysis
- 16.3.1.1. Conservative Scenario
- 16.3.1.2. Optimistic Scenario
- 16.3.1. Scenario Analysis
- 16.4. Key Market Segmentations
17. ADC CYTOTOXIC PAYLOADS AND WARHEADS MARKET, BY TYPE OF PRODUCT
- 17.1. Chapter Overview
- 17.2. Key Assumptions and Methodology
- 17.3. ADC Cytotoxic Payloads and Warheads Market: Distribution by Type of Product
- 17.3.1. Commercialized ADC Cytotoxic Payloads and Warheads Market, Historical Trends (Since 2023) and Forecasted Estimates (Till 2035)
- 17.3.2. Clinical ADC Cytotoxic Payloads and Warheads Market ADCs, Historical Trends (Since 2023) and Forecasted Estimates (Till 2035)
18. ADC CYTOTOXIC PAYLOADS AND WARHEADS MARKET, BY TYPE OF PAYLOAD
- 18.1. Chapter Overview
- 18.2. Key Assumptions and Methodology
- 18.3. ADC Cytotoxic Payloads and Warheads Market: Distribution by Type of Payload
- 18.3.1. ADC Cytotoxic Payloads and Warheads Market for Tubulin inhibitors, Historical Trends (Since 2023) and Forecasted Estimates (Till 2035)
- 18.3.2. ADC Cytotoxic Payloads and Warheads Market for Topoisomerase Inhibitors, Historical Trends (Since 2023) and Forecasted Estimates (Till 2035)
- 18.3.3. ADC Cytotoxic Payloads and Warheads Market for DNA Damaging Agents, Historical Trends (Since 2023) and Forecasted Estimates (Till 2035)
- 18.3.4. ADC Cytotoxic Payloads and Warheads Market for Others, Historical Trends (Since 2023) and Forecasted Estimates (Till 2035)
19. ADC CYTOTOXIC PAYLOADS AND WARHEADS MARKET, BY SUB-CATEGORY OF PAYLOAD / WARHEAD
- 19.1. Chapter Overview
- 19.2. Key Assumptions and Methodology
- 19.3. ADC Cytotoxic Payloads and Warheads Market: Distribution by Sub-Categories of Payload / Warhead
- 19.3.1. ADC Cytotoxic Payloads and Warheads Market for Topoisomerase I inhibitors, Historical Trends (Since 2023) and Forecasted Estimates (Till 2035)
- 19.3.2. ADC Cytotoxic Payloads and Warheads Market for Maytansinoid, Historical Trends (Since 2023) and Forecasted Estimates (Till 2035)
- 19.3.3. ADC Cytotoxic Payloads and Warheads Market for Auristatin, Historical Trends (Since 2023) and Forecasted Estimates (Till 2035)
- 19.3.4. ADC Cytotoxic Payloads and Warheads Market for Others, Historical Trends (Since 2023) and Forecasted Estimates (Till 2035)
20. ADC CYTOTOXIC PAYLOADS AND WARHEADS MARKET, BY GEOGRAPHICAL REGIONS
- 20.1. Chapter Overview
- 20.2. Key Assumptions and Methodology
- 20.3. ADC Cytotoxic Payloads and Warheads Market: Distribution by Geographical Regions
- 20.3.1. ADC Cytotoxic Payloads and Warheads Market in North America, Historical Trends (Since 2023) and Forecasted Estimates (Till 2035)
- 20.3.1.1. ADC Cytotoxic Payloads and Warheads Market in the US, Historical Trends (Since 2023) and Forecasted Estimates (Till 2035)
- 20.3.1.2. ADC Cytotoxic Payloads and Warheads Market in Canada, Historical Trends (Since 2023) and Forecasted Estimates (Till 2035)
- 20.3.2. ADC Cytotoxic Payloads and Warheads Market in Europe, Historical Trends (Since 2023) and Forecasted Estimates (Till 2035)
- 20.3.2.1. ADC Cytotoxic Payloads and Warheads Market in Germany, Historical Trends (Since 2023) and Forecasted Estimates (Till 2035)
- 20.3.2.2. ADC Cytotoxic Payloads and Warheads Market in the UK, Historical Trends (Since 2023) and Forecasted Estimates (Till 2035)
- 20.3.2.3. ADC Cytotoxic Payloads and Warheads Market in France, Historical Trends (Since 2023) and Forecasted Estimates (Till 2035)
- 20.3.2.4. ADC Cytotoxic Payloads and Warheads Market in Italy, Historical Trends (Since 2023) and Forecasted Estimates (Till 2035)
- 20.3.2.5. ADC Cytotoxic Payloads and Warheads Market in Spain, Historical Trends (Since 2023) and Forecasted Estimates (Till 2035)
- 20.3.3. ADC Cytotoxic Payloads and Warheads Market in Asia-Pacific, Historical Trends (Since 2023) and Forecasted Estimates (Till 2035)
- 20.3.3.1. ADC Cytotoxic Payloads and Warheads Market in China, Historical Trends (Since 2023) and Forecasted Estimates (Till 2035)
- 20.3.3.2. ADC Cytotoxic Payloads and Warheads Market in Japan, Historical Trends (Since 2023) and Forecasted Estimates (Till 2035)
- 20.3.3.4. ADC Cytotoxic Payloads and Warheads Market in Australia, Historical Trends (Since 2023) and Forecasted Estimates (Till 2035)
- 20.3.1. ADC Cytotoxic Payloads and Warheads Market in North America, Historical Trends (Since 2023) and Forecasted Estimates (Till 2035)
21. MARKET OPPORTUNITY ANALYSIS: NORTH AMERICA
- 21.1. ADC Cytotoxic Payloads and Warheads Market in North America: Distribution by Type of Product
- 21.1.1. ADC Cytotoxic Payloads and Warheads Market in North America for Clinical Product, Historical Trends (since 2023) and Forecasted Estimates (till 2035)
- 21.1.2. ADC Cytotoxic Payloads and Warheads Market in North America for Commercial Product, Historical Trends (since 2023) and Forecasted Estimates (till 2035)
- 21.2. ADC Cytotoxic Payloads and Warheads Market in North America: Distribution by Type of Payload
- 21.2.1. ADC Cytotoxic Payloads and Warheads Market in North America for Tubulin inhibitors, Historical Trends (since 2023) and Forecasted Estimates (till 2035)
- 21.2.2. ADC Cytotoxic Payloads and Warheads Market in North America for Topoisomerase Inhibitors, Historical Trends (since 2023) and Forecasted Estimates (till 2035)
- 21.2.3. ADC Cytotoxic Payloads and Warheads Market in North America for DNA Damaging Agents, Historical Trends (since 2023) and Forecasted Estimates (till 2035)
- 21.2.4. ADC Cytotoxic Payloads and Warheads Market in North America for Others, Historical Trends (since 2023) and Forecasted Estimates (till 2035)
- 21.3. ADC Cytotoxic Payloads and Warheads Market in North America: Distribution by Type of Payload / Warhead
- 21.3.1. ADC Cytotoxic Payloads and Warheads Market in North America for Topoisomerase I inhibitors, Historical Trends (since 2023) and Forecasted Estimates (till 2035)
- 21.3.2. ADC Cytotoxic Payloads and Warheads Market in North America for Maytansinoid, Historical Trends (since 2023) and Forecasted Estimates (till 2035)
- 21.3.3. ADC Cytotoxic Payloads and Warheads Market in North America for Auristatin, Historical Trends (since 2023) and Forecasted Estimates (till 2035)
- 21.3.4. ADC Cytotoxic Payloads and Warheads Market in North America for Others, Historical Trends (since 2023) and Forecasted Estimates (till 2035)
22. MARKET OPPORTUNITY ANALYSIS: EUROPE
- 22.1. ADC Cytotoxic Payloads and Warheads Market in Europe: Distribution by Type of Product
- 22.1.1. ADC Cytotoxic Payloads and Warheads Market in Europe for Clinical Product, Historical Trends (since 2023) and Forecasted Estimates (till 2035)
- 22.1.2. ADC Cytotoxic Payloads and Warheads Market in Europe for Commercial Product, Historical Trends (since 2023) and Forecasted Estimates (till 2035)
- 22.2. ADC Cytotoxic Payloads and Warheads Market in Europe: Distribution by Type of Payload
- 22.2.1. ADC Cytotoxic Payloads and Warheads Market in Europe for Tubulin inhibitors, Historical Trends (since 2023) and Forecasted Estimates (till 2035)
- 22.2.2. ADC Cytotoxic Payloads and Warheads Market in Europe for Topoisomerase Inhibitors, Historical Trends (since 2023) and Forecasted Estimates (till 2035)
- 22.2.3. ADC Cytotoxic Payloads and Warheads Market in Europe for DNA Damaging Agents, Historical Trends (since 2023) and Forecasted Estimates (till 2035)
- 22.2.4. ADC Cytotoxic Payloads and Warheads Market in Europe for Others, Historical Trends (since 2023) and Forecasted Estimates (till 2035)
- 22.3. ADC Cytotoxic Payloads and Warheads Market in Europe: Distribution by Type of Payload / Warhead
- 22.3.1. ADC Cytotoxic Payloads and Warheads Market in Europe for Topoisomerase I inhibitors, Historical Trends (since 2023) and Forecasted Estimates (till 2035)
- 22.3.2. ADC Cytotoxic Payloads and Warheads Market in Europe for Maytansinoid, Historical Trends (since 2023) and Forecasted Estimates (till 2035)
- 22.3.3. ADC Cytotoxic Payloads and Warheads Market in Europe for Auristatin, Historical Trends (since 2023) and Forecasted Estimates (till 2035)
- 22.3.4. ADC Cytotoxic Payloads and Warheads Market in Europe for Others, Historical Trends (since 2023) and Forecasted Estimates (till 2035)
23. MARKET OPPORTUNITY ANALYSIS: ASIA-PACIFIC
- 23.1. ADC Cytotoxic Payloads and Warheads Market in Asia-Pacific: Distribution by Type of Product
- 23.1.1. ADC Cytotoxic Payloads and Warheads Market in Asia-Pacific for Clinical Product, Historical Trends (since 2023) and Forecasted Estimates (till 2035)
- 23.1.2. ADC Cytotoxic Payloads and Warheads Market in Asia-Pacific for Commercial Product, Historical Trends (since 2023) and Forecasted Estimates (till 2035)
- 23.2. ADC Cytotoxic Payloads and Warheads Market in Asia-Pacific: Distribution by Type of Payload
- 23.2.1. ADC Cytotoxic Payloads and Warheads Market in Asia-Pacific for Tubulin inhibitors, Historical Trends (since 2023) and Forecasted Estimates (till 2035)
- 23.2.2. ADC Cytotoxic Payloads and Warheads Market in Asia-Pacific for Topoisomerase Inhibitors, Historical Trends (since 2023) and Forecasted Estimates (till 2035)
- 23.2.3. ADC Cytotoxic Payloads and Warheads Market in Asia-Pacific for DNA Damaging Agents, Historical Trends (since 2023) and Forecasted Estimates (till 2035)
- 23.2.4. ADC Cytotoxic Payloads and Warheads Market in Asia-Pacific for Others, Historical Trends (since 2023) and Forecasted Estimates (till 2035)
- 23.3. ADC Cytotoxic Payloads and Warheads Market in Asia-Pacific: Distribution by Type of Payload / Warhead
- 23.3.1. ADC Cytotoxic Payloads and Warheads Market in Asia-Pacific for Topoisomerase I inhibitors, Historical Trends (since 2023) and Forecasted Estimates (till 2035)
- 23.3.2. ADC Cytotoxic Payloads and Warheads Market in Asia-Pacific for Maytansinoid, Historical Trends (since 2023) and Forecasted Estimates (till 2035)
- 23.3.3. ADC Cytotoxic Payloads and Warheads Market in Asia-Pacific for Auristatin, Historical Trends (since 2023) and Forecasted Estimates (till 2035)
- 23.3.4. ADC Cytotoxic Payloads and Warheads Market in Asia-Pacific for Others, Historical Trends (since 2023) and Forecasted Estimates (till 2035)
- *Detailed information on Chapter 21 to 23 is available in the Excel Data Packs shared along with the report**
24. CONCLUDING REMARKS
25. EXECUTIVE INSIGHTS
- 25.1 Chapter Overview
- 25.2. Company A (Mid-sized company, Netherlands)
- 25.2.1. Company Snapshot
- 25.2.2. Interview Transcript: Founder and Chief Scientific Officer
- 25.3. Company B (Small Company, US)
- 25.3.1. Company Snapshot
- 25.3.2. Interview Transcript: Founder and Chief Executive Officer
- 25.4. Company C (Small Company, France)
- 25.4.1. Company Snapshot
- 25.4.2. Interview Transcript: Co-founder and Chief Executive Officer
- 25.5. Company D (Large Company, Italy)
- 25.5.1. Company Snapshot
- 25.5.2. Interview Transcript: Chief Executive Officer and Technical Business Development Manager
- 25.6. Company E (Large Company, South Korea)
- 25.6.1. Company Snapshot
- 25.6.2. Interview Transcript: Chief Business Officer
26. APPENDIX 1: TABULATED DATA
27. APPENDIX 2: LIST OF COMPANIES AND ORGANIZATIONS
List of Tables
- Table 7.1 List of ADC Cytotoxic Payloads and Warheads Providers
- Table 7.2 ADC Cytotoxic Payload and Warhead Providers: Information on Product Portfolio
- Table 11.1 List of Partnerships and Collaborations, Since 2021
- Table 12.1 List of Recent Expansions, Since 2020
- Table 13.1 Sample Dataset: Information on Service Providers Installed Capacity
- Table 23.1 ADC Cytotoxic Payload and Warhead Providers: Distribution by Year of Establishment
- Table 23.2 ADC Cytotoxic Payload and Warhead Providers: Distribution by Company Size
- Table 23.3 ADC Cytotoxic Payload and Warhead Providers: Distribution by Location of Headquarters (Region)
- Table 23.4 ADC Cytotoxic Payload and Warhead Providers: Distribution by Location of Headquarters (Country)
- Table 23.5 ADC Cytotoxic Payload and Warhead Providers: Distribution by Location of Manufacturing Facilities
- Table 23.6 ADC Cytotoxic Payload and Warhead Providers: Distribution by Type of Company
- Table 23.7 ADC Cytotoxic Payload and Warhead Providers: Distribution by Type of DNA Damaging Agent
- Table 23.8 ADC Cytotoxic Payload and Warhead Providers: Distribution by Type of Microtubule / Tubulin Inhibitors
- Table 23.9 ADC Cytotoxic Payload and Warhead Providers: Distribution by Type of Topoisomerase Inhibitors
- Table 23.10 ADC Cytotoxic Payload and Warhead Providers: Distribution by Scale of Operation
- Table 23.11 ADC Cytotoxic Payload and Warhead Providers: Distribution by Type of Therapeutic Area
- Table 23.12 Company Competitiveness Analysis: ADC Cytotoxic Payloads and Warheads Providers based in North America
- Table 23.13 Company Competitiveness Analysis: ADC Cytotoxic Payloads and Warheads Providers based in Europe
- Table 23.14 Company Competitiveness Analysis: ADC Cytotoxic Payloads and Warheads Providers based in Asia-Pacific
- Table 23.15 CARBOGEN AMCIS: Annual Revenues, Consolidated Financial Details, Since FY 2022 (INR Billion)
- Table 23.16 Merck: Annual Revenues, Consolidated Financial Details, Since FY 2022 (EUR Million)
- Table 23.17 WuXi AppTec: Annual Revenues, Consolidated Financial Details, Since FY 2022 (RMB Billion)
- Table 23.18 Partnerships and Collaborations: Cumulative Year-wise Trend, Since Pre-2021
- Table 23.19 Partnerships and Collaborations: Distribution by Type of Partnership
- Table 23.20 Partnerships and Collaborations: Distribution by Year and Type of Partnership, Since 2021
- Table 23.21 Partnerships and Collaborations: Distribution by Type of Partner
- Table 23.22 Most Active Players: Distribution by Number of Partnerships
- Table 23.23 Partnerships and Collaborations: Local and International Agreements
- Table 23.24 Partnerships and Collaborations: Intracontinental and Intercontinental Agreements
- Table 23.25 Recent Expansions: Cumulative Year-wise Trend, Since 2020
- Table 23.26 Recent Expansions: Distribution by Type of Expansion
- Table 23.27 Recent Expansions: Distribution by Year and Type of Expansion, Since 2020
- Table 23.28 Recent Expansions: Distribution by Location of Expansion (Country)
- Table 23.29 Recent Expansions: Distribution by Location of Expansion (Continent)
- Table 23.30 Most Active Players: Distribution by Number of Expansions
- Table 23.31 Global Installed ADC Cytotoxic Payloads and Warheads Manufacturing Capacity: Distribution by Range of Installed Capacity (in Liters)
- Table 23.32 Global Installed ADC Cytotoxic Payloads and Warheads Manufacturing Capacity: Distribution by Scale of Operation
- Table 23.33 Global Installed ADC Cytotoxic Payloads and Warheads Manufacturing Capacity: Distribution by Location of ADC Cytotoxic Payloads and Warheads Manufacturing Facility
- Table 23.34 Global Annual Demand for ADC Payloads (in Kg), Till 2035
- Table 23.35 Global Clinical Demand for ADC Payloads, Till 2035 (in KGs)
- Table 23.36 Global Commercial Demand for ADC Payloads, Till 2035 (in KGs)
- Table 23.37 Clinical Demand Analysis: Distribution by Type of Payload, Current Year and 2035
- Table 23.38 Clinical Demand Analysis: Distribution by Type of Payload, Till 2035
- Table 23.39 Clinical Demand Analysis: Distribution by Type of Phase of Development, Current Year and 2035
- Table 23.40 Clinical Demand Analysis: Distribution by Type of Phase of Development, Till 2035
- Table 23.41 Commercial Demand Analysis: Distribution by Payload, Till 2035
- Table 23.42 Commercia Demand Analysis: Distribution by Type of Payload, Till 2035
- Table 23.43 Commercia Demand Analysis: Distribution by Therapeutic Area, Till 2035
- Table 23.44 Commercia Demand Analysis: Distribution by Geographical Regions, Current Year and 2035
- Table 23.45 Commercia Demand Analysis: Distribution by Geographical Regions, Till 2035
- Table 23.46 ADC Cytotoxic Payloads and Warheads Market, Historical Trends (Since 2023) and Forecasted Estimates (Till 2035) (USD Million)
- Table 23.47 ADC Cytotoxic Payloads and Warheads Market, Forecasted Estimates (Till 2035): Conservative Scenario (USD Million)
- Table 23.48 ADC Cytotoxic Payloads and Warheads Market, Forecasted Estimates (Till 2035): Optimistic Scenario (USD Million)
- Table 23.49 ADC Cytotoxic Payloads and Warheads Market: Distribution by Type of Product, Current Year, 2030 and 2035
- Table 23.50 ADC Cytotoxic Payloads and Warheads Market for Clinical Product, Historical Trends (Since 2023) and Forecasted Estimates (Till 2035) (USD Million)
- Table 23.51 ADC Cytotoxic Payloads and Warheads Market for Commercial Product, Historical Trends (Since 2023) and Forecasted Estimates (Till 2035) (USD Million)
- Table 23.52 ADC Cytotoxic Payloads and Warheads Market: Distribution by Type of Payload, Current Year, 2030 and 2035
- Table 23.53 ADC Cytotoxic Payloads and Warheads Market for Tubulin inhibitors, Historical Trends (Since 2023) and Forecasted Estimates (Till 2035) (USD Million)
- Table 23.54 ADC Cytotoxic Payloads and Warheads Market for Topoisomerase Inhibitors, Historical Trends (Since 2023) and Forecasted Estimates (Till 2035) (USD Million)
- Table 23.55 ADC Cytotoxic Payloads and Warheads Market for DNA Damaging Agents, Historical Trends (Since 2023) and Forecasted Estimates (Till 2035) (USD Million)
- Table 23.56 ADC Cytotoxic Payloads and Warheads Market for Others, Historical Trends (Since 2023) and Forecasted Estimates (Till 2035) (USD Million)
- Table 23.57 ADC Cytotoxic Payloads and Warheads Market: Distribution by Type of Payload / Warhead, Current Year, 2030 and 2035
- Table 23.58 ADC Cytotoxic Payloads and Warheads Market for Topoisomerase I inhibitors, Historical Trends (Since 2023) and Forecasted Estimates (Till 2035) (USD Million)
- Table 23.59 ADC Cytotoxic Payloads and Warheads Market for Maytansinoid, Historical Trends (Since 2023) and Forecasted Estimates (Till 2035) (USD Million)
- Table 23.60 ADC Cytotoxic Payloads and Warheads Market for Auristatin, Historical Trends (Since 2023) and Forecasted Estimates (Till 2035) (USD Million)
- Table 23.61 ADC Cytotoxic Payloads and Warheads Market for Others, Historical Trends (Since 2023) and Forecasted Estimates (Till 2035) (USD Million)
- Table 23.62 ADC Cytotoxic Payloads and Warheads Market: Distribution by Geographical Regions, Current Year, 2030 and 2035
- Table 23.63 ADC Cytotoxic Payloads and Warheads Market in North America: Historical Trends (Since 2023) and Forecasted Estimates (Till 2035) (USD Million)
- Table 23.64 ADC Cytotoxic Payloads and Warheads Market in the US: Historical Trends (Since 2023) and Forecasted Estimates (Till 2035) (USD Million)
- Table 23.65 ADC Cytotoxic Payloads and Warheads Market in Canada: Historical Trends (Since 2023) and Forecasted Estimates (Till 2035) (USD Million)
- Table 23.66 ADC Cytotoxic Payloads and Warheads Market in Europe: Historical Trends (Since 2023) and Forecasted Estimates (Till 2035) (USD Million)
- Table 23.67 ADC Cytotoxic Payloads and Warheads Market in Germany: Historical Trends (Since 2023) and Forecasted Estimates (Till 2035) (USD Million)
- Table 23.68 ADC Cytotoxic Payloads and Warheads Market in the UK: Historical Trends (Since 2023) and Forecasted Estimates (Till 2035) (USD Million)
- Table 23.69 ADC Cytotoxic Payloads and Warheads Market in France: Historical Trends (Since 2023) and Forecasted Estimates (Till 2035) (USD Million)
- Table 23.70 ADC Cytotoxic Payloads and Warheads Market in Italy: Historical Trends (Since 2023) and Forecasted Estimates (Till 2035) (USD Million)
- Table 23.71 ADC Cytotoxic Payloads and Warheads Market in Spain: Historical Trends (Since 2023) and Forecasted Estimates (Till 2035) (USD Million)
- Table 23.72 ADC Cytotoxic Payloads and Warheads Market in Asia-Pacific: Historical Trends (Since 2023) and Forecasted Estimates (Till 2035) (USD Million)
- Table 23.73 ADC Cytotoxic Payloads and Warheads Market in China: Historical Trends (Since 2023) and Forecasted Estimates (Till 2035) (USD Million)
- Table 23.74 ADC Cytotoxic Payloads and Warheads Market in Japan: Historical Trends (Since 2023) and Forecasted Estimates (Till 2035) (USD Million)
- Table 23.75 ADC Cytotoxic Payloads and Warheads Market in Australia: Historical Trends (Since 2023) and Forecasted Estimates (Till 2035) (USD Million)
List of Figures
- Figure 2.1 Research Methodology: Project Methodology
- Figure 2.2 Research Methodology: Data Sources for Secondary Research
- Figure 2.3 Research Methodology: Robust Quality Control
- Figure 3.1 Market Dynamics: Forecast Methodology
- Figure 3.2 Market Dynamics: Market Assessment Framework
- Figure 4.1 Lessons Learnt from Past Recessions
- Figure 5.1 Executive Summary: Market Landscape
- Figure 5.2 Executive Summary: Market Trends
- Figure 5.3 Executive Summary: Market Sizing and Opportunity Analysis
- Figure 6.1 Key Components of ADCs
- Figure 7.1 ADC Cytotoxic Payload and Warhead Providers: Distribution by Year of Establishment
- Figure 7.2 ADC Cytotoxic Payload and Warhead Providers: Distribution by Company Size
- Figure 7.3 ADC Cytotoxic Payload and Warhead Providers: Distribution by Location of Headquarters (Region)
- Figure 7.4 ADC Cytotoxic Payload and Warhead Providers: Distribution by Location of Headquarters (Country)
- Figure 7.5 ADC Cytotoxic Payload and Warhead Providers: Distribution by Location of Manufacturing Facilities
- Figure 7.6 ADC Cytotoxic Payload and Warhead Providers: Distribution by Type of Company
- Figure 7.7 ADC Cytotoxic Payload and Warhead Providers: Distribution by Type of DNA Damaging Agent
- Figure 7.8 ADC Cytotoxic Payload and Warhead Providers: Distribution by Type of Microtubule / Tubulin Inhibitors
- Figure 7.9 ADC Cytotoxic Payload and Warhead Providers: Distribution by Type of Topoisomerase Inhibitors
- Figure 7.10 ADC Cytotoxic Payload and Warhead Providers: Distribution by Scale of Operation
- Figure 7.11 ADC Cytotoxic Payload and Warhead Providers: Distribution by Type of Therapeutic Area
- Figure 8.1 Company Competitiveness Analysis: ADC Cytotoxic Payloads and Warheads Providers based in North America
- Figure 8.2 Company Competitiveness Analysis: ADC Cytotoxic Payloads and Warheads Providers based in Europe
- Figure 8.3 Company Competitiveness Analysis: ADC Cytotoxic Payloads and Warheads Providers based in Asia-Pacific
- Figure 9.1 CARBOGEN AMCIS: Annual Revenues, Consolidated Financial Details, Since FY 2022 (INR Billion)
- Figure 9.2 Merck: Annual Revenues, Consolidated Financial Details, Since FY 2022 (EUR Million)
- Figure 9.3 WuXi AppTec: Annual Revenues, Consolidated Financial Details, Since FY 2022 (RMB Billion)
- Figure 11.1 Partnerships and Collaborations: Cumulative Year-wise Trend, Since Pre-2021
- Figure 11.2 Partnerships and Collaborations: Distribution by Type of Partnership
- Figure 11.3 Partnerships and Collaborations: Distribution by Year and Type of Partnership, Since Pre-202
- Figure 11.4 Partnerships and Collaborations: Distribution by Type of Partner
- Figure 11.5 Most Active Players: Distribution by Number of Partnerships
- Figure 11.6 Partnerships and Collaborations: Local and International Agreements
- Figure 11.7 Partnerships and Collaborations: Intracontinental and Intercontinental Agreements
- Figure 12.1 Recent Expansions: Cumulative Year-wise Trend, Since 2020
- Figure 12.2 Recent Expansions: Distribution by Type of Expansion
- Figure 12.3 Recent Expansions: Distribution by Year and Type of Expansion, Since 2020
- Figure 12.4 Recent Expansions: Distribution by Location of Expansion (Country)
- Figure 12.5 Recent Expansions: Distribution by Location of Expansion (Continent)
- Figure 12.6 Most Active Players: Distribution by Number of Expansions
- Figure 13.1 Global Installed ADC Cytotoxic Payloads and Warheads Manufacturing Capacity: Distribution by Range of Installed Capacity (in Liters)
- Figure 13.2 Global Installed ADC Cytotoxic Payloads and Warheads Manufacturing Capacity: Distribution by Scale of Operation
- Figure 13.3 Global Installed ADC Cytotoxic Payloads and Warheads Manufacturing Capacity: Distribution by Location of ADC Cytotoxic Payloads and Warheads Manufacturing Facility
- Figure 14.1 Global Annual Demand for ADC Payloads (in Kg), Till 2035
- Figure 14.2 Global Clinical Demand for ADC Payloads, Till 2035 (in KGs)
- Figure 14.3 Global Commercial Demand for ADC Payloads, Till 2035 (in KGs)
- Figure 14.4 Clinical Demand Analysis: Distribution by Type of Payload, Current Year and 2035
- Figure 14.5 Clinical Demand Analysis: Distribution by Type of Payload, Till 2035
- Figure 14.6 Clinical Demand Analysis: Distribution by Type of Phase of Development, Current Year and 2035
- Figure 14.7 Clinical Demand Analysis: Distribution by Type of Phase of Development, Till 2035
- Figure 14.8 Commercial Demand Analysis: Distribution by Payload, Till 2035
- Figure 14.9 Commercial Demand Analysis: Distribution by Type of Payload, Till 2035
- Figure 14.10 Commercial Demand Analysis: Distribution by Therapeutic Area, Till 2035
- Figure 14.11 Commercial Demand Analysis: Distribution by Geographical Regions, Current Year and 2035
- Figure 14.12 Commercial Demand Analysis: Distribution by Geographical Regions, Till 2035
- Figure 16.1 ADC Cytotoxic Payloads and Warheads Market, Historical Trends (Since 2023) and Forecasted Estimates (Till 2035) (USD Million)
- Figure 16.2 ADC Cytotoxic Payloads and Warheads Market, Forecasted Estimates (Till 2035): Conservative Scenario (USD Million)
- Figure 16.3 ADC Cytotoxic Payloads and Warheads Market, Forecasted Estimates (Till 2035): Optimistic Scenario (USD Million)
- Figure 17.1 ADC Cytotoxic Payloads and Warheads Market: Distribution by Type of Product, Current Year, 2030 and 2035
- Figure 17.2 ADC Cytotoxic Payloads and Warheads Market for Clinical Product, Historical Trends (Since 2023) and Forecasted Estimates (Till 2035) (USD Million)
- Figure 17.3 ADC Cytotoxic Payloads and Warheads Market for Commercial Product, Historical Trends (Since 2023) and Forecasted Estimates (Till 2035) (USD Million)
- Figure 18.1 ADC Cytotoxic Payloads and Warheads Market: Distribution by Type of Payload, Current Year, 2030 and 2035
- Figure 18.2 ADC Cytotoxic Payloads and Warheads Market for Tubulin inhibitors, Historical Trends (Since 2023) and Forecasted Estimates (Till 2035) (USD Million)
- Figure 18.3 ADC Cytotoxic Payloads and Warheads Market for Topoisomerase Inhibitors, Historical Trends (Since 2023) and Forecasted Estimates (Till 2035) (USD Million)
- Figure 18.4 ADC Cytotoxic Payloads and Warheads Market for DNA Damaging Agents, Historical Trends (Since 2023) and Forecasted Estimates (Till 2035) (USD Million)
- Figure 18.5 ADC Cytotoxic Payloads and Warheads Market for Others, Historical Trends (Since 2023) and Forecasted Estimates (Till 2035) (USD Million)
- Figure 19.1 ADC Cytotoxic Payloads and Warheads Market: Distribution by Type of Payload / Warhead, Current Year, 2030 and 2035
- Figure 19.2 ADC Cytotoxic Payloads and Warheads Market for Topoisomerase I inhibitors, Historical Trends (Since 2023) and Forecasted Estimates (Till 2035) (USD Million)
- Figure 19.3 ADC Cytotoxic Payloads and Warheads Market for Maytansinoid, Historical Trends (Since 2023) and Forecasted Estimates (Till 2035) (USD Million)
- Figure 19.4 ADC Cytotoxic Payloads and Warheads Market for Auristatin, Historical Trends (Since 2023) and Forecasted Estimates (Till 2035) (USD Million)
- Figure 19.5 ADC Cytotoxic Payloads and Warheads Market for Others, Historical Trends (Since 2023) and Forecasted Estimates (Till 2035) (USD Million)
- Figure 20.1 ADC Cytotoxic Payloads and Warheads Market: Distribution by Geographical Regions, Current Year, 2030 and 2035
- Figure 20.2 ADC Cytotoxic Payloads and Warheads Market in North America: Historical Trends (Since 2023) and Forecasted Estimates (Till 2035) (USD Million)
- Figure 20.3 ADC Cytotoxic Payloads and Warheads Market in the US: Historical Trends (Since 2023) and Forecasted Estimates (Till 2035) (USD Million)
- Figure 20.4 ADC Cytotoxic Payloads and Warheads Market in Canada: Historical Trends (Since 2023) and Forecasted Estimates (Till 2035) (USD Million)
- Figure 20.5 ADC Cytotoxic Payloads and Warheads Market in Europe: Historical Trends (Since 2023) and Forecasted Estimates (Till 2035) (USD Million)
- Figure 20.6 ADC Cytotoxic Payloads and Warheads Market in Germany: Historical Trends (Since 2023) and Forecasted Estimates (Till 2035) (USD Million)
- Figure 20.7 ADC Cytotoxic Payloads and Warheads Market in the UK: Historical Trends (Since 2023) and Forecasted Estimates (Till 2035) (USD Million)
- Figure 20.8 ADC Cytotoxic Payloads and Warheads Market in France: Historical Trends (Since 2023) and Forecasted Estimates (Till 2035) (USD Million)
- Figure 20.9 ADC Cytotoxic Payloads and Warheads Market in Italy: Historical Trends (Since 2023) and Forecasted Estimates (Till 2035) (USD Million)
- Figure 20.10 ADC Cytotoxic Payloads and Warheads Market in Spain: Historical Trends (Since 2023) and Forecasted Estimates (Till 2035) (USD Million)
- Figure 20.11 ADC Cytotoxic Payloads and Warheads Market in Asia-Pacific: Historical Trends (Since 2023) and Forecasted Estimates (Till 2035) (USD Million)
- Figure 20.12 ADC Cytotoxic Payloads and Warheads Market in China: Historical Trends (Since 2023) and Forecasted Estimates (Till 2035) (USD Million)
- Figure 20.13 ADC Cytotoxic Payloads and Warheads Market in Japan: Historical Trends (Since 2023) and Forecasted Estimates (Till 2035) (USD Million)
- Figure 20.14 ADC Cytotoxic Payloads and Warheads Market in Australia: Historical Trends (Since 2023) and Forecasted Estimates (Till 2035) (USD Million)
 ADC技術市場分析及預測至2035年:依類型、產品類型、服務、技術、組件、應用、製程、最終用戶、裝置、階段分類抗體藥物複合體(ADC) 市場分析及預測至 2035 年:按類型、產品類型、服務、技術、應用、最終用戶、製程、階段、解決方案、模式抗體藥物複合體(ADC) 市場分析及預測(至 2035 年):按類型、產品、技術、應用、最終用戶、組件、製程、安裝類型、模式和階段分類
 ADC 連接器市場按產品類型、技術、應用、最終用途和分銷管道分類,全球預測,2026-2032 年ADC藥物CDMO服務市場按服務類型、服務規模、偶聯化學、治療用途和最終用戶分類-2026-2032年全球預測PMO偶聯物市場按產品類型、應用、最終用戶、遞送方式和分子類型分類,全球預測,2026-2032年抗體寡核苷酸偶聯物CDMO市場按服務模式、營運規模、治療用途、寡核苷酸類型、抗體形式和最終用戶分類,全球預測,2026-2032年抗體寡核苷酸偶聯藥物市場按有效載荷類型、抗體類型、連接子類型、治療領域、應用、最終用戶和分銷管道分類 - 全球預測(2026-2032 年)抗體表位發現服務市場(按服務類型、應用、技術和最終用戶分類)-2026-2032年全球預測
 抗體藥物偶聯物 (ADC) 市場 - 按癌症類型、有效載荷、標靶、產品、用戶和國家劃分的市場預測(含高階主管和顧問指南):2026-2030