


 |
市場調查報告書
商品編碼
1891241
下一代抗體療法市場(第二版)-產業趨勢及全球預測(至2035年)-依藥物、新型抗體、標靶疾病、療法、給藥途徑、主要地區和主要公司劃分Next Generation Antibody Therapeutics Market (2nd Edition): Industry Trends and Global Forecasts, Till 2035 - Distribution by Drug, Novel Antibody, Target Indication, Therapy, Route of Administration, Key Geographical Regions and Leading Players |
||||||
下一代抗體療法市場
預計到2035年,下一代抗體療法的市場規模將從目前的8.43億美元增長至21.61億美元,預測期內(至2035年)的複合年增長率(CAGR)為9.87%。
市場規模與機會分析依下列參數分類:
藥學
- Adcetris
- Kadsira
- Elzonris
- Besponsa
- Lynphia
- Fibromun
- Nidregy
- Iomab-B
- TLX 591
新型抗體
- 放射免疫偶聯物
- 免疫細胞因子
- 免疫毒素
標靶適應症
- 未經治療的系統性間變性大細胞淋巴瘤 (SALCL) 或其他表達 CD30 的周邊 T 細胞淋巴瘤 (PTCL)
- 經典型何杰金氏淋巴瘤
- 原發性皮膚間變性大細胞淋巴瘤 (pcALCL) 或
- 表達 CD30 的蕈樣肉芽腫 (MF)
- 瀰漫性大 B 細胞淋巴瘤
- 復發或難治性 B 細胞前驅急性淋巴性白血病
- HER2 陽性乳癌
- 漿細胞樣樹突狀細胞腫瘤
- 局部晚期黑色素瘤/III期B/C期黑色素瘤
- 復發或難治性皮膚T細胞淋巴瘤
- 復發或難治性急性骨髓性白血病
- 白血病
- 轉移性去勢抵抗性攝護腺癌
- 軟組織肉瘤
治療類型
- 合併治療
- 單藥治療
給藥途徑
- 腫瘤內給藥
- 靜脈注射
地理區域
- 北美
- 歐洲
- 亞太地區
- 中東和非洲
下一代抗體療法市場:成長與趨勢
抗體(免疫球蛋白)是免疫系統產生的蛋白質能夠識別並結合細胞和組織上的特定抗原標記,作為抵抗各種疾病的第一道防線。利用抗體-抗原交互作用的精準性,創新抗體療法展現出改善患者預後的巨大潛力。近年來,許多創新抗體療法已獲得美國食品藥物管理局 (FDA) 的批准,標誌著在治療包括代謝紊亂、心血管疾病、癌症和罕見疾病在內的多種疾病方面取得了顯著進展。這些批准證明了生物技術方法在應對重大醫學挑戰方面的有效性,並凸顯了抗體療法在現代醫學中的作用。擴大資金投入和投資,以及加強合作研究,對於研發針對各種疾病的新型抗體至關重要。此外,許多先進技術正在改變新型療法的發現和開發,並從根本上改變治療方法。
下一代抗體療法市場:主要發現
本報告深入分析了全球下一代抗體療法市場的現狀,並指出了該行業的潛在成長機會。報告的主要發現包括:
- 目前已有超過70種放射免疫偶聯物核准或處於不同研發階段,用於治療各種疾病。其中,超過80%處於早期研發階段。
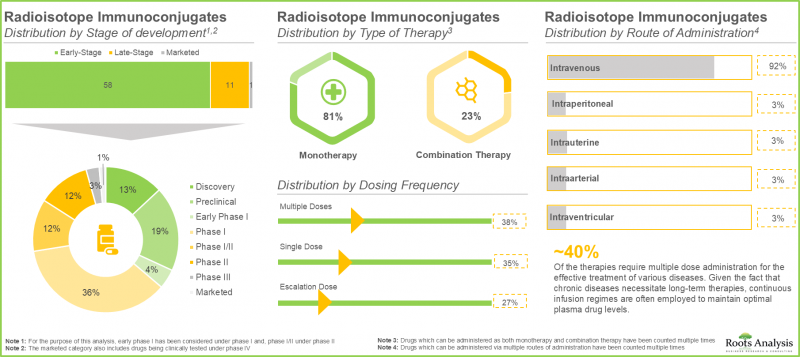
- 約70%的單藥療法可透過靜脈注射給藥,其中絕大多數(96%)療法正處於臨床研發階段。
- 目前,已有超過35種免疫細胞激素核准或正在研發中,用於治療各種疾病。其中,約60%處於早期研發階段。
- 目前,超過45%處於早期研發階段的免疫細胞激素與IL-2和IL-15型細胞激素合併使用。其中,絕大多數(80%)可以作為聯合療法給藥。
- 目前,近60種免疫毒素已獲準或處於不同研發階段,用於治療各種疾病。其中,超過45%的療法處於早期研發階段。
- 目前,約80%處於後期試驗(II期和II/III期)的免疫毒素採用注射給藥。此外,56%的免疫毒素與微生物毒素偶聯。
- 大多數臨床試驗於2024年啟動。尤其值得注意的是,目前有相當一部分試驗(佔所有試驗的72%)正在招募患者,以研究下一代抗體療法。
- 不斷增長的科學文獻凸顯了利害關係人在下一代抗體療法研發中的積極參與,約35%的論文發表於去年。
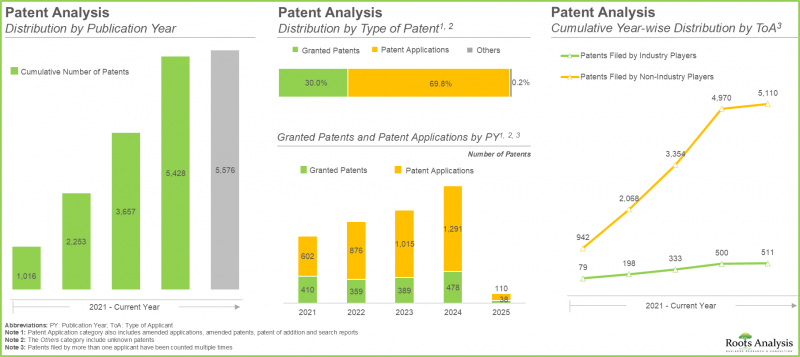
- 大多數專利持有者並非產業參與者。然而,在過去幾年中,產業參與者對專利申請活動的貢獻日益增加。
- 該領域約20%的合約為供應協議,其中44%的供應協議於2022年簽署,旨在滿足日益增長的新型抗體需求。
- 我們利用自主研發的預測模型,結合歷史趨勢、數據和廣泛研究的信息,估算了全球下一代抗體療法市場的當前規模。
- 目前,全球下一代抗體療法市場由針對HER2陽性乳癌的藥物主導,其次是經典型何杰金氏淋巴瘤。
下一代抗體療法市場:主要細分市場
Adcetris 佔下一代抗體療法市場最大佔有率
由於核准速度加快以及在血液腫瘤治療中已證實的療效,Adcetris 目前佔約 45% 的高市場佔有率。預計 LYMPHIR 在預測期內將以 18% 的複合年增長率快速成長。
免疫毒素細分市場將佔下一代抗體療法市場的大部分佔有率。
根據下一代抗體療法市場預測,由於其卓越的靶向細胞毒性和對抗藥性癌細胞的療效,免疫毒素細分市場今年將佔較大的市場佔有率。此外,預計免疫細胞因子領域在整個預測期內將展現出超過 40% 的最大成長潛力。
HER2 陽性乳癌將佔下一代抗體治療市場的最大佔有率。
今年,HER2 陽性乳癌將在下一代抗體治療市場中佔約 45% 的顯著市場。這主要歸功於 HER2 陽性乳癌發病率的上升以及標靶治療的廣泛應用,這些因素顯著改善了患者的預後和存活率。復發或難治性皮膚 T 細胞淋巴瘤領域在整個預測期內預計將展現出約 20% 的最大成長潛力。
單藥療法將主導下一代抗體治療產業。
由於單藥療法能夠實現高度特異性的標靶治療且副作用極小,因此今年它將佔大部分市場佔有率。預計在預測期內,聯合療法細分市場將展現出最高的成長潛力,約 45%。
靜脈給藥途徑主導下一代抗體療法市場佔有率
目前,靜脈給藥途徑憑藉其快速起效和更高的生物利用度(這對於有效遞送大分子抗體至關重要)而主導市場。腫瘤內給藥途徑預計將以更高的複合年增長率成長,這主要得益於其能夠實現更高的局部藥物濃度、降低全身毒性並增強治療效果。
預計北美將在未來幾年引領下一代抗體療法市場
根據我們的下一代抗體療法市場報告,預計北美今年將佔大部分市場佔有率 (64%),並有望保持這一地位。這得益於該地區強大的醫療保健體系、用於開發新型抗體療法的創新平台以及對個人化醫療的高度重視,使其在新型抗體療法領域處於領先地位。
下一代抗體療法市場代表性公司
- Actinium Pharmaceuticals
- 輝瑞
- Philogen
- 羅氏
- Telix Pharmaceuticals
- Y-mAbs Therapies
新型抗體療法市場:研究範圍
- 市場規模和機會分析:本報告對下一代抗體療法市場進行了詳細分析,重點關注以下關鍵市場細分:[A] 藥物,[B] 新型抗體類型,[C] 靶向適應症,[D] 療法類型,[E] 給藥途徑,以及 [F] 主要公司。
- 市場概況 1:對放射免疫偶聯物 (RIC) 當前市場概況的詳細評估,以及基於以下方面的分析:[A] 研發階段,[B] 治療類型,[C] 給藥途徑,[D] 給藥頻率,[E] 放射性同位素類型,[F] 給藥方法,[G] 作用,[H] 領域開發商類型,[M] 主要活躍企業。
- 市場概況 2:免疫細胞因子目前市場概況的詳細評估,以及基於以下相關參數的分析:[A] 研發階段,[B] 細胞因子類型,[C] 治療類型,[D] 給藥頻率,[E] 作用機制,[F] 給藥途徑,[G] 抗原類型/形式,[H] 給藥途徑,[I] 年份,[K] 年份,[H] 治療領域總部所在地,[M] 開發商類型,[N] 主要參與者。
- 市場概況 3:除了對免疫毒素當前市場概況進行詳細評估外,本報告還基於以下相關參數提供分析:[A] 研發階段,[B] 毒素類型,[C] 給藥頻率,[D] 治療類型,[E] 給藥方法,[F] 靶點類型,[G] 作用機制,[H] 給藥機制,[H] 途徑,[I]L] 年份,[K總部所在地,[M] 開發商類型,以及 [N] 主要參與者。
- 公司簡介:詳細介紹北美、歐洲和亞太地區開發下一代抗體療法的關鍵公司。每家公司的簡介包括:[A] 公司概況,[B] 財務信息,[C] 藥物組合詳情,[D] 近期進展,以及 [E] 未來展望。
- 臨床試驗分析:各種下一代我們基於以下相關參數,對已完成和正在進行的抗體療法臨床試驗進行詳細分析:[A] 研究註冊年份,[B] 研究狀態,[C] 研究階段,[D] 入組患者人數,[E] 研究設計和患者性別,[F] 申辦方/合作方類型,[G] 主要行業,以及 [H] 地理分佈。
- 文獻分析:基於相關參數(例如,[A] 出版年份,[B] 出版類型,[C] 主要出版商,[D] 主要期刊),對與下一代抗體療法研究相關的各類同行評審科學文章進行詳細審查。
- 專利分析:基於以下參數,對已申請和已授權的下一代抗體療法專利進行詳細分析:[A] 公開年份,[B] 專利類型,[C] 申請人類型,[D] 申請年份,[E] 專利管轄區、專利年齡,[F] CPC 分類號,[G] 主要參與者。
- 合作夥伴關係與合作:基於[A]合作年份、[B]合作類型、[C]合作夥伴類型和[D]最活躍參與者等相關參數,對基因治療、非病毒載體和病毒載體生產市場中已建立的合作夥伴關係與合作進行深入分析。
- 大型製藥公司:基於[A]研發能力、[B]產品組合實力和[C]產品組合多樣性等多個相關參數,對參與下一代抗體療法領域的大型製藥公司進行分析。
- 近期擴張趨勢:基於[A]擴張年份、[B]擴張類型、[C]載體類型、[D]應用領域和[E]擴張地理位置等多個參數,對公司近期為增強其病毒載體和非病毒載體生產能力而進行的擴張進行分析。
- 市場影響分析:深入分析可能影響基因治療、非病毒載體和病毒載體生產市場成長的因素。它還包括對以下方面的識別和分析:[A]關鍵驅動因素,[B]潛在限制因素,[C]新興機遇,以及[D]現有挑戰。
目錄
第一章:背景
第二章:研究方法
第三章:市場動態
第四章:宏觀經濟指標
- 市場動態
第五章:摘要整理
第六章:引言
- 下一代抗體療法概述
- 治療性抗體:開發方法
- 未來展望
第七章:競爭格局:新型抗體療法(放射性同位素免疫偶聯物)
- 章節概述
- 市場概況:放射性同位素免疫偶聯物
- 研發前景:放射性同位素免疫偶聯物
第八章 競爭格局:新型抗體療法(免疫細胞激素)
- 章節概述
- 市場概況:免疫細胞因子
- 研發前景:免疫細胞因子
第九章:競爭格局:新型抗體療法(免疫毒素)
- 章節概述
- 市場概況:免疫毒素
- 研發前景:免疫毒素
第十章:新型抗體研發者
- 章節概述
- 錒製藥公司
- 輝瑞
- Philogen
- 羅氏
- Telix Pharmaceuticals
- Y-mAbs Therapeutics
第11章 臨床試驗分析
- 分析方法與關鍵參數
- 依試驗登記年分析
- 依試驗狀態分析
- 依試驗登記年份及試驗狀態分析
- 依試驗註冊年份分析入組病患人數
- 依試驗狀態分析入組患者人數
- 依試驗階段分析
- 依研究設計分析
- 依目標患者族群分析
第12章:文獻分析
- 分析方法與關鍵參數
- 下一代抗體治療:文獻分析
第十三章:專利分析
- 分析方法與關鍵參數
- 下一代抗體療法:專利分析
第十四章:合作與夥伴關係
第十五章:主要藥廠
- 分析研究方法與關鍵參數
- 下一代抗體療法領域主要製藥公司列表
- 關鍵參數評分標準
第十六章:市場影響分析:驅動因素、限制因素、機會與挑戰
第十七章:全球下一代抗體療法市場
第十八章:下一代抗體療法市場(依藥物分類)
第19章:下一代抗體療法市場(以新型抗體類型分類)
第20章:下一代抗體療法市場(依標靶疾病分類)
第21章:下一代抗體療法市場(依療法分類)
第22章:下一代抗體療法市場(依給藥途徑分類)
第23章:下一代抗體療法市場(依主要地區分類)
第24章:市場機會分析:北美
第25章:市場機會分析:歐洲
第26章:市場機會分析:亞太地區
第27章:市場機會分析:中東與北非
第28章:下一代抗體療法市場(依主要公司劃分)
第29章:表格資料
第30章:公司與組織清單
Next Generation Antibody Therapeutics Market
As per Roots Analysis, the next generation antibody therapeutics market is estimated to grow from USD 843 million in the current year to USD 2,161 million by 2035, at a CAGR of 9.87% during the forecast period, till 2035.
The market sizing and opportunity analysis has been segmented across the following parameters:
Drugs
- Adcetris
- Kadcyla
- ELZONRIS
- Besponsa
- LYMPHIR
- Fibromun
- Nidlegy
- Iomab-B
- TLX 591
Type of Novel Antibody
- Radioisotope Immunoconjugates
- Immunocytokines
- Immunotoxins
Target Indication
- Previously Untreated Systemic Anaplastic Large Cell Lymphoma (SALCL) or other CD30-expressing Peripheral T-cell Lymphomas (PTCL)
- Classical Hodgkin Lymphoma
- Primary Cutaneous Anaplastic Large Cell Lymphoma (pcALCL) or
- CD30-expressing Mycosis Fungoides (MF)
- Diffuse Large B-cell Lymphoma
- Relapsed or Refractory B-cell precursor Acute
- Lymphoblastic Leukemia
- HER2-positive breast cancer
- Blastic Plasmacytoid Dendritic Cell Neoplasm
- Locally Advanced, Melanoma / Stage III B / C Melanoma
- Relapsed or Refractory Cutaneous T-cell Lymphoma
- Relapsed / Refractory Acute Myeloid
- Leukemia
- Metastatic Castration-resistant Prostate Cancer
- Soft Tissue Sarcoma
Type of Therapy
- Combination Therapy
- Monotherapy
Route of Administration
- Intratumoral
- Intravenous
Geographical Regions
- North America
- Europe
- Asia-Pacific
- Middle East and Africa
Novel Antibody Therapies Market: Growth and Trends
Antibodies, or immunoglobulins, are proteins generated by the immune system that identify and attach to particular antigen markers on cells or tissues, acting as the primary defense against various ailments. Utilizing the accuracy of antibody-antigen interactions, innovative antibody treatments have shown considerable promise in enhancing patient results. In recent years, numerous innovative antibody treatments received approval from the USFDA, signifying notable progress in the treatment of a range of illnesses, such as metabolic disorders, cardiovascular issues, cancer, and rare diseases. These authorizations demonstrate the effectiveness of biotechnological methods in tackling significant healthcare issues and underscore the role of antibody therapies in contemporary medicine. Increased funding and investments, along with partnership initiatives, are vital for the research and development of new antibodies targeting various disorders. Moreover, numerous advanced technologies are transforming the identification and development of new therapies, fundamentally changing treatment approaches.
Novel Antibody Therapies Market: Key Insights
The report delves into the current state of the global novel antibody therapies market and identifies potential growth opportunities within industry. Some key findings from the report include:
- Over 70 radioisotope immunoconjugates are approved / being investigated across different stages of development for the treatment of various diseases; of these, >80% of the therapies are in early-stages of development.
- Close to 70% of the monotherapies can be administered intravenously; of these, majority (96%) of the therapies are under clinical stages of development.
- Over 35 immunocytokines are currently approved / being investigated across various stages of development for the treatment of various diseases; of these, nearly 60% of the therapies are in early-stages of development.
- Presently, over 45% of immunocytokines in early stages of development are in conjugation with IL-2 and IL-15 types of cytokine; of these, majority (80%) of the therapies can be administered as combination therapy.
- Nearly 60 immunotoxins are currently approved / being investigated across different stages of development for the treatment of various diseases; of these, more than 45% of the therapies are in early-stages of development.
- Presently, nearly 80% of the late-stage immunotoxins (phase II and phase II / III) are administered via injections; further, 56% immunotoxins are in conjugation with microbial toxins.
- Most of the trials were registered in 2024; notably, a significant proportion (72%) of the total trials are currently recruiting patients for the investigation of novel antibody therapies.
- The growing scientific literature highlights the active involvement of stakeholders in the research and development of novel antibody therapies; close to 35% of the articles were published in the previous year.
- Majority of the patent assignees are non-industry players; however, over the past few years, the contribution of industry players in the patent filing activity has also increased.
- Close to 20% deals inked in this domain are supply agreements; of these, 44% agreements were signed in 2022 in order to address the growing demand for novel antibodies.
- Using our proprietary forecast model, we estimated the current size of the global novel antibody therapies market, taking into consideration the historical trends, data and inputs obtained from exhaustive research.
- Currently, the global novel antibody therapies market is dominated by drugs that are intended to target HER2-positive breast cancer, followed by classical Hodgkin lymphoma.
Novel Antibody Therapies Market: Key Segments
Adcetris Drug Captures the Largest Share in the Next Generation Antibody Therapeutics Market
Currently, Adcetris holds the higher market share of close to 45% due to its early approvals and proven effectiveness in hematologic cancers. LYMPHIR is expected to expand at an increased CAGR of 18% throughout the forecast period.
Immunotoxins Segment Holds the Majority of the Next Generation Antibody Therapeutics Market Share
The higher share of immunotoxins segment in the current year can be attributed to their superior targeted cytotoxicity and effectiveness against resistant cancer cells, as per next generation antibody therapeutics market forecast. Further, the immunocytokines sector is expected to exhibit the greatest growth potential, of over 40%, throughout the forecast period.
HER2-PBC Hold the Largest Share in the Next Generation Antibody Therapeutics Market
In the present year, HER2-PB captures a significant market share of nearly 45% in novel antibody therapies, driven by the growing incidence of HER2-positive breast cancer and the heightened use of targeted treatments that lead to substantial enhancements in patient outcomes and survival rates. The segment for relapsed or refractory cutaneous T-cell lymphoma is expected to exhibit the greatest growth potential of nearly 20% throughout the forecast period.
Monotherapy Dominates Next Generation Antibody Therapies Industry
Monotherapy segment holds most of the market share in the current year owing to its ability to provide highly specific targeting with fewer side effects. The combination therapy segment is likely to show the highest growth potential of close to 45%, during the forecast period.
Intravenous Route of Administration Dominates Next Generation Antibody Therapeutics Market Share
Currently, intravenous route of administration, the intravenous method dominates the market due to its capacity to provide a quick onset of action and improved bioavailability needed for effectively delivering large antibodies. The intratumoral method of delivery is expected to expand at a higher CAGR, fueled by its capacity to attain greater local drug levels, reduce systemic toxicity, and enhance treatment effectiveness
North America is Likely to Propel in the Next Generation Antibody Therapeutics Market in the Coming Years
According to our next generation antibody therapeutics market report, North America is likely to capture the majority (64%) of the market share in the current year, and this trend is unlikely to change in the future. This can be attributed to the strong healthcare system, innovative platforms for developing new antibody treatments, and a significant emphasis on personalized care, positioning this region at the forefront of novel antibody treatments.
Example Players in the Next Generation Antibody Therapeutics Market
- Actinium Pharmaceuticals
- Pfizer
- Philogen
- Roche
- Telix Pharmaceuticals
- Y-mAbs Therapies
Novel Antibody Therapies Market: Research Coverage
- Market Sizing and Opportunity Analysis: The report features an in-depth analysis of the novel antibody therapies market, focusing on key market segments, including [A] drug, [B] type of novel antibody, [C] target indication, [D] type of therapy, [E] route of administration and [F] leading players.
- Market Landscape 1: A detailed assessment of the current market landscape of radioisotope immunoconjugates, along with analyses based on several relevant parameters, including [A] stage of development, [B] type of therapy, [C] route of administration, [D] dosing frequency, [E] type of radioisotope, [F] mode of administration, [G] mechanism of action [H] therapeutic area, [I] year of establishment, [J] company size, [K] location of headquarters, [L] type of developer and [M] most active players.
- Market Landscape 2: A detailed assessment of the current market landscape of immunocytokines, along with analyses based on several relevant parameters, including [A] stage of development, [B] type of cytokine, [C] type of therapy, [D] dosing frequency, [E] mechanism of action, [F] mode of administration, [G] type of antigen / format, [H] route of administration [I] therapeutic area, [J] year of establishment, [K] company size, [L] location of headquarters, [M] type of developer and [N] most active players.
- Market Landscape 3: A detailed assessment of the current market landscape of immunotoxins, along with analyses based on several relevant parameters, including [A] stage of development, [B] type of toxin, [C] dosing frequency, [D] type of therapy, [E] mode of administration, [F] type of target, [G] mechanism of action, [H] route of administration, [I] therapeutic area, [J] year of establishment, [K] company size, [L] location of headquarters, [M] type of developer and [N] most active players.
- Company Profiles: In-depth profiles of prominent players based in regions, namely North America, Europe and Asia-Pacific that are currently involved in the engaged in the development of novel antibody therapies. Each profile features [A] a brief overview of the company, [B] its financial information, [C] details on its drug portfolio, [D] recent developments and an [E] informed future outlook.
- Clinical Trial Analysis: An in-depth analysis of completed and ongoing clinical trials investigating different novel antibody therapies, based on several relevant parameters, such as [A] trial registration year, [B] trial status, [C] trial phase, [D] patients enrolled, [E] study design, patient gender, [F] type of sponsor / collaborator, [G] most active industry and [H] geographical distribution.
- Publication Analysis: A detailed review of various peer-reviewed, scientific articles related to research on novel antibody therapies, based on relevant parameters, such as [A] year of publication, [B] type of publication, [C] popular publisher and [D] key journal.
- Patent Analysis: in-depth analysis of various patents that have been filed / granted for novel antibody therapies, taking into consideration parameters, such as [A] publication year, [B] type of patent, [C] type of applicant, [D] application year, [E] patent jurisdiction, patent age, [F] CPC symbols, [G] leading players.
- Partnerships and Collaborations An insightful analysis of the partnerships and collaborations established in gene therapy, non viral vector and viral vector manufacturing market based on various relevant parameters, including [A] year of partnership, [B] type of partnership, [C] type of partner and [D] most active players.
- Big Pharma Players: An analysis of big pharma players engaged in the field of novel antibody therapies, based on several relevant parameters, such as [A] developer strength, [B] portfolio strength, and [C] portfolio diversity.
- Recent Expansions: An analysis of the recent expansions undertaken by various companies in order to augment their respective capabilities related to viral vector and non viral vector manufacturing, based on several parameters, such as [A] year of expansion, [B] type of expansion, [C] type of vector, [D] application area and [E] geographical location of the expansion.
- Market Impact Analysis: An in-depth analysis of the factors that can impact the growth of gene therapy, non viral vector and viral vector manufacturing market. It also features identification and analysis of [A] key drivers, [B] potential restraints, [C] emerging opportunities, and [D] existing challenges.
Key Questions Answered in this Report
- How many companies are currently engaged in this market?
- Which are the leading companies in this market?
- What is the current global capacity of developers?
- What factors are likely to influence the evolution of this market?
- What is the current and future market size?
- What is the CAGR of this market?
- How is the current and future market opportunity likely to be distributed across key market segments?
Reasons to Buy this Report
- The report provides a comprehensive market analysis, offering detailed revenue projections of the overall market and its specific sub-segments. This information is valuable to both established market leaders and emerging entrants.
- Stakeholders can leverage the report to gain a deeper understanding of the competitive dynamics within the market. By analyzing the competitive landscape, businesses can make informed decisions to optimize their market positioning and develop effective go-to-market strategies.
- The report offers stakeholders a comprehensive overview of the market, including key drivers, barriers, opportunities, and challenges. This information empowers stakeholders to stay abreast of market trends and make data-driven decisions to capitalize on growth prospects.
Additional Benefits
- Complimentary PPT Insights Packs
- Complimentary Excel Data Packs for all Analytical Modules in the Report
- 15% Free Content Customization
- Detailed Report Walkthrough Session with Research Team
- Free Updated report if the report is 6-12 months old or older
TABLE OF CONTENTS
1. BACKGROUND
- 1.1. Context
- 1.2. Project Objectives
2. RESEARCH METHODOLOGY
- 2.1. Research Assumptions
- 2.1.1. Market Landscape and Market Trends
- 2.1.2. Market Forecast and Opportunity Analysis
- 2.1.3. Comparative Analysis
- 2.2. Database Building
- 2.2.1. Data Collection
- 2.2.2. Data Validation
- 2.2.3. Data Analysis
- 2.3. Project Methodology
- 2.3.1. Project Commencement
- 2.3.2. Secondary Research
- 2.3.2.1. Annual Reports
- 2.3.2.2. Academic Research Papers
- 2.3.2.3. Company Websites
- 2.3.2.4. Investor Presentations and Regulatory Filings
- 2.3.2.5. White Papers
- 2.3.2.6. Industry Publications
- 2.3.2.7. Conferences and Seminars
- 2.3.2.8. Government Portals
- 2.3.2.9. Media and Press Releases
- 2.3.2.10. Newsletters
- 2.3.2.11. Industry and Paid Databases
- 2.3.2.12. Roots Proprietary Databases
- 2.3.3. Primary Research
- 2.3.4. Data Analysis and Interpretation
- 2.3.5. Market Forecast and Validation
- 2.3.6. Report Compilation
- 2.4. Research Ethics and Integrity
- 2.5. Analytical Tools and Databases
- 2.6. Robust Quality Control Framework
3. MARKET DYNAMICS
- 3.1. Forecast Methodology
- 3.1.1. Top-Down Approach
- 3.1.2. Bottom-Up Approach
- 3.1.3. Hybrid Approach
- 3.2. Market Assessment Framework
- 3.2.1. Total Addressable Market (TAM)
- 3.2.2. Serviceable Addressable Market (SAM)
- 3.2.3. Serviceable Obtainable Market (SOM)
- 3.2.4. Currently Acquired Market (CAM)
- 3.3. Forecasting Tools and Techniques
- 3.3.1. Qualitative Forecasting
- 3.3.2. Correlation
- 3.3.3. Regression
- 3.3.4. Extrapolation
- 3.3.5. Convergence
- 3.3.6. Sensitivity Analysis
- 3.3.7. Scenario Planning
- 3.3.8. Data Visualization
- 3.3.9. Time Series Analysis
- 3.3.10. Forecast Error Analysis
- 3.4. Key Considerations
- 3.4.1. Demographics
- 3.4.2. Economic Factors
- 3.4.3. Competitive Landscape
- 3.4.4. Government Regulations and Policies
- 3.4.5. R&D Investment
- 3.4.6. Technological Factors
- 3.4.7. Industry Consolidation
- 3.4.8. Supply Chain
- 3.4.9. Market Access
- 3.4.10. Pandemics / Unforeseen Disruptions Impact
4. MACRO-ECONOMIC INDICATORS
- 4.1. Market Dynamics
- 4.1.1. Time Period
- 4.1.1.1. Historical Trends
- 4.1.1.2. Current and Forecasted Estimates
- 4.1.2. Currency Coverage
- 4.1.2.1. Overview of Major Currencies Affecting the Market
- 4.1.2.2. Impact of Currency Fluctuations on the Industry
- 4.1.3. Foreign Exchange Impact
- 4.1.3.1. Evaluation of Foreign Exchange Rates and Their Impact on Market
- 4.1.3.2. Strategies for Mitigating Foreign Exchange Risk
- 4.1.4. Recession
- 4.1.4.1. Historical Analysis of Past Recessions and Lessons Learnt
- 4.1.4.2. Assessment of Current Economic Conditions and Potential Impact on the Market
- 4.1.5. Inflation
- 4.1.5.1. Measurement and Analysis of Inflationary Pressures in the Economy
- 4.1.5.2. Potential Impact of Inflation on the Market Evolution
- 4.1.6. Other Indicators
- 4.1.6.1. War Impact Analysis
- 4.1.6.2. Cross-border Dynamics
- 4.1.6.3. Consumer Spendings and Gross Domestic Product
- 4.1.6.4. Stock Market Performance
- 4.1.1. Time Period
5. EXECUTIVE SUMMARY
6. INTRODUCTION
- 6.1. An Overview of Novel Antibody Therapies
- 6.2. Therapeutic Antibodies: Developmental Approaches
- 6.2.1. Novel Antibody Therapies: Antibody-Directed Enzyme Prodrug Therapy (ADEPT)
- 6.2.1.1. Mechanism of Action of Antibody-Directed Enzyme Prodrug Therapy (ADEPT)
- 6.2.1.2. Advantages of Antibody-Directed Enzyme Prodrug Therapy (ADEPT)
- 6.2.1.3. Disadvantages of Antibody-Directed Enzyme Prodrug Therapy (ADEPT)
- 6.2.2. Novel Antibody Therapies: TCR like Antibodies
- 6.2.2.1. Mechanism of Action of TCR like Antibodies
- 6.2.2.2. Advantages of TCR like Antibodies
- 6.2.2.3. Disadvantages of TCR like Antibodies
- 6.2.3. Novel Antibody Therapies: Radioisotope Immunoconjugates
- 6.2.3.1. Mechanism of Action of Radioisotope Immunoconjugates
- 6.2.3.2. Advantages of Radioisotope Immunoconjugates
- 6.2.3.3. Disadvantages of Radioisotope Immunoconjugates
- 6.2.4. Novel Antibody Therapies: Immunotoxins
- 6.2.4.1. Mechanism of Action of Immunotoxins
- 6.2.4.2. Advantages of Immunotoxins
- 6.2.4.3. Disadvantages of Immunotoxins
- 6.2.5. Novel Antibody Therapies: Intracellular Antibody
- 6.2.5.1. Mechanism of Action of Intracellular Antibody
- 6.2.5.2. Advantages of Intracellular Antibody
- 6.2.5.3. Disadvantages of Intracellular Antibody
- 6.2.6. Novel Antibody Therapies: Immunocytokines
- 6.2.6.1. Mechanism of Action of Immunocytokines
- 6.2.6.2. Advantages of Immunocytokines
- 6.2.6.3. Disadvantages of Immunocytokines
- 6.2.1. Novel Antibody Therapies: Antibody-Directed Enzyme Prodrug Therapy (ADEPT)
- 6.3. Future Perspectives
7. COMPETITIVE LANDSCAPE: NOVEL ANTIBODY THERAPEUTICS (RADIOISOTOPE IMMUNOCONJUGATES)
- 7.1. Chapter Overview
- 7.2. Market Landscape: Radioisotope Immunoconjugates
- 7.2.1. Analysis by Stage of Development
- 7.2.2. Analysis by Type of Therapy
- 7.2.3. Analysis by Route of Administration
- 7.2.4. Analysis by Dosing Frequency
- 7.2.5. Analysis by Type of Radioisotope
- 7.2.6. Analysis by Mode of Administration
- 7.2.7. Analysis by Mechanism of Action
- 7.2.8. Analysis by Therapeutic Area
- 7.3. Developer Landscape: Radioisotope Immunoconjugates
- 7.3.1. Analysis by Year of Establishment
- 7.3.2. Analysis by Company Size
- 7.3.3. Analysis by Location of Headquarters
- 7.3.4. Analysis by Type of Developer
- 7.3.5. Most Active Players: Analysis by Number of Therapies
8. COMPETITIVE LANDSCAPE: NOVEL ANTIBODY THERAPEUTICS (IMMUNOCYTOKINES)
- 8.1. Chapter Overview
- 8.2. Market Landscape: Immunocytokines
- 8.2.1. Analysis by Stage of Development
- 8.2.2. Analysis by Type of Cytokine
- 8.2.3. Analysis by Type of Therapy
- 8.2.4. Analysis by Dosing Frequency
- 8.2.5. Analysis by Mechanism of Action
- 8.2.6. Analysis by Mode of Administration
- 8.2.7. Analysis by Type of Antigen / Format
- 8.2.8. Analysis by Route of Administration
- 8.2.9. Analysis by Therapeutic Area
- 8.3. Developer Landscape: Immunocytokines
- 8.3.1. Analysis by Year of Establishment
- 8.3.2. Analysis by Company Size
- 8.3.3. Analysis by Location of Headquarters
- 8.3.4. Most Active Players: Analysis by Number of Therapies
9. COMPETITIVE LANDSCAPE: NOVEL ANTIBODY THERAPEUTICS (IMMUNOTOXINS)
- 9.1. Chapter Overview
- 9.2. Market Landscape: Immunotoxins
- 9.2.1. Analysis by Stage of Development
- 9.2.2. Analysis by Type of Toxin
- 9.2.3. Analysis by Dosing Frequency
- 9.2.4. Analysis by Type of Therapy
- 9.2.5. Analysis by Mode of Administration
- 9.2.6. Analysis by Type of Target
- 9.2.7. Analysis by Mechanism of Action
- 9.2.8. Analysis by Route of Administration
- 9.2.9. Analysis by Therapeutic Area
- 9.3. Developer Landscape: Immunotoxins
- 9.3.1. Analysis by Year of Establishment
- 9.3.2. Analysis by Company Size
- 9.3.3. Analysis by Location of Headquarters
- 9.3.4. Analysis by Type of Developer
- 9.3.5. Most Active Players: Analysis by Number of Therapies
10. NOVEL ANTIBODY DEVELOPERS
- 10.1. Chapter Overview
- 10.1.1. Actinium Pharmaceuticals
- 10.1.1.1. Company Overview
- 10.1.1.2. Management Team
- 10.1.1.3. Contact Details
- 10.1.1.4. Drug Portfolio
- 10.1.1.5. Recent Developments and Future Outlook
- 10.1.2. Pfizer
- 10.1.2.1. Company Overview
- 10.1.2.2. Management Team
- 10.1.2.3. Contact Details
- 10.1.2.4. Operating Business Segments
- 10.1.2.5. Financial Information
- 10.1.2.6. Drug Portfolio
- 10.1.2.7. Recent Developments and Future Outlook
- 10.1.3. Philogen
- 10.1.3.1. Company Overview
- 10.1.3.2. Management Team
- 10.1.3.3. Contact Details
- 10.1.3.4. Financial Information
- 10.1.3.5. Drug Portfolio
- 10.1.3.6. Recent Developments and Future Outlook
- 10.1.4. Roche
- 10.1.4.1. Company Overview
- 10.1.4.2. Management Team
- 10.1.4.3. Contact Details
- 10.1.4.4. Operating Business Segments
- 10.1.4.5. Financial Information
- 10.1.4.6. Drug Portfolio
- 10.1.4.7. Recent Developments and Future Outlook
- 10.1.5. Telix Pharmaceuticals
- 10.1.5.1. Company Overview
- 10.1.5.2. Management Team
- 10.1.5.3. Contact Details
- 10.1.5.4. Financial Information
- 10.1.5.5. Drug Portfolio
- 10.1.5.6. Recent Developments and Future Outlook
- 10.1.6. Y-mAbs Therapeutics
- 10.1.6.1. Company Overview
- 10.1.6.2. Management Team
- 10.1.6.3. Contact Details
- 10.1.6.4. Financial Information
- 10.1.6.5. Drug Portfolio
- 10.1.6.6. Recent Developments and Future Outlook
- 10.1.1. Actinium Pharmaceuticals
11. CLINICAL TRIAL ANALYSIS
- 11.1. Analysis Methodology and Key Parameters
- 11.2. Analysis by Trial Registration Year
- 11.3. Analysis by Trial Status
- 11.4. Analysis by Trial Registration Year and Trial Status
- 11.5. Analysis of Patients Enrolled by Trial Registration Year
- 11.6. Analysis of Patients Enrolled by Trial Status
- 11.7. Analysis by Trial Phase
- 11.8. Analysis by Study Design
- 11.9. Analysis by Target Patient Population
- 11.9.1. Analysis by Patient Gender
- 11.9.2. Analysis by Type of Sponsor / Collaborator
- 11.9.3. Most Active Industry Players: Analysis by Number of Trials
- 11.9.4. Analysis of Trials and Number of Patients Enrolled
12. PUBLICATION ANALYSIS
- 12.1. Analysis Methodology and Key Parameters
- 12.2. Novel Antibody Therapies: Publication Analysis
- 12.2.1. Analysis by Year of Publication
- 12.2.2. Analysis by Type of Publication
- 12.2.3. Analysis by Most Popular Publisher
- 12.2.4. Key Journals: Analysis by Number of Publications
- 12.2.5. Key Journals: Analysis by Impact Factor
13. PATENT ANALYSIS
- 13.1. Analysis Methodology and Key Parameters
- 13.2. Novel Antibody Therapies: Patent Analysis
- 13.2.1. Analysis by Publication Year
- 13.2.2. Analysis by Type of Patent
- 13.2.3. Analysis of Granted Patents and Patent Applications by Year
- 13.2.4. Analysis by Type of Applicant
- 13.2.5. Analysis by Application Year
- 13.2.6. Analysis by Patent Jurisdiction
- 13.2.7. Analysis by Patent Age
- 13.2.8. Leading Industry Players: Analysis by Number of Patents
- 13.2.9. Leading Non-Industry Players: Analysis by Number of Patents
- 13.2.10. Leading Individual Assignees: Analysis by Number of Patents
- 13.2.11. Patent Benchmarking: Analysis of Patent Characteristics (CPC Codes) by Leading Industry Players
- 13.2.12. Patent Benchmarking: Analysis of Leading Industry Players by Patent Characteristics (CPC Codes)
- 13.2.13. Patent Valuation: Analysis Methodology and Parameters
- 13.2.14. Patent Valuation: Analysis by Relative Valuation
14. PARTNERSHIPS AND COLLABORATIONS
- 14.1. Chapter Overview
- 14.2. Partnership Models
- 14.3. Novel Antibody Therapeutics: Partnerships and Collaborations
- 14.3.1. Analysis by Year of Partnership
- 14.3.2. Analysis by Type of Partnership
- 14.3.3. Analysis by Year and Type of Partnership
- 14.3.4. Most Popular Drug: Analysis by Number of Partnerships
- 14.3.5. Analysis by Types of Novel Antibody
- 14.3.6. Analysis by Type of Partner
- 14.3.7. Most Active Players: Analysis by Number of Partnerships
- 14.3.8. Analysis by Therapeutic Area
- 14.3.9. Analysis by Therapeutic Area and Type of Partnership
- 14.3.10. Analysis by Geography
- 14.3.10.1. Local and International Agreements
- 14.3.10.2. Intracontinental and Intercontinental Agreements
15. BIG PHARMA PLAYERS
- 15.1. Analysis Methodology and Key Parameters
- 15.2. List of Big Pharma Players in Novel Antibody Therapies Domain
- 15.3. Scoring Criteria for Key Parameters
- 15.3.1. Analysis by Developer Strength
- 15.3.2. Analysis by Portfolio Strength
- 15.3.3. Analysis by Portfolio Diversity
- 15.3.4. Benchmarking: Spider Web Analysis
- 15.3.5. Benchmarking: Harvey Ball Analysis
- 15.3.6. Benchmarking: Wind Rose Chart
16. MARKET IMPACT ANALYSIS: DRIVERS, RESTRAINTS, OPPORTUNITIES AND CHALLENGES
- 16.1. Chapter Overview
- 16.2. Market Drivers
- 16.3. Market Restraints
- 16.4. Market Opportunities
- 16.5. Market Challenges
17. GLOBAL NOVEL ANTIBODY THERAPIES MARKET
- 17.1. Chapter Overview
- 17.2. Key Assumptions and Methodology
- 17.3. Global Novel Antibody Therapies Market, Historical Trends (Since 2023) and Forecasted Estimates (Till 2035)
- 17.4. Multivariate Scenario Analysis
- 17.4.1. Conservative Scenario
- 17.4.2. Optimistic Scenario
- 17.5. Key Market Segmentations
18. NOVEL ANTIBODY THERAPIES MARKET, BY DRUGS
- 18.1. Chapter Overview
- 18.2. Key Assumptions and Methodology
- 18.3. Novel Antibody Therapies Market: Distribution by Drugs
- 18.3.1. Novel Antibody Therapies Market for Adcetris, Historical Trends (Since 2023) and Forecasted Estimates (Till 2035)
- 18.3.2. Novel Antibody Therapies Market for Kadcyla, Historical Trends (Since 2023) and Forecasted Estimates (Till 2035)
- 18.3.3. Novel Antibody Therapies Market for ELZONRIS, Historical Trends (Since 2023) and Forecasted Estimates (Till 2035)
- 18.3.4. Novel Antibody Therapies Market for Besponsa, Historical Trends (Since 2023) and Forecasted Estimates (Till 2035)
- 18.3.5. Novel Antibody Therapies Market for LYMPHIR, Historical Trends (Since 2023) and Forecasted Estimates (Till 2035)
- 18.3.6. Novel Antibody Therapies Market for Fibromun, Historical Trends (Since 2023) and Forecasted Estimates (Till 2035)
- 18.3.7. Novel Antibody Therapies Market for Nidlegy, Historical Trends (Since 2023) and Forecasted Estimates (Till 2035)
- 18.3.8. Novel Antibody Therapies Market for Iomab-B, Historical Trends (Since 2023) and Forecasted Estimates (Till 2035)
- 18.3.9. Novel Antibody Therapies Market for TLX 591, Historical Trends (Since 2023) and Forecasted Estimates (Till 2035)
- 18.4. Data Triangulation and Validation
19. NOVEL ANTIBODY THERAPIES MARKET, BY TYPE OF NOVEL ANTIBODY
- 19.1. Chapter Overview
- 19.2. Key Assumptions and Methodology
- 19.3. Novel Antibody Therapies Market: Distribution by Type of Novel Antibody
- 19.3.1. Novel Antibody Therapies Market for Immunotoxins, Historical Trends (Since 2023) and Forecasted Estimates (Till 2035)
- 19.3.2. Novel Antibody Therapies Market for Immunocytokines, Historical Trends (Since 2023) and Forecasted Estimates (Till 2035)
- 19.3.3. Novel Antibody Therapies Market for Radioisotope Immunoconjugates, Historical Trends (Since 2023) and Forecasted Estimates (Till 2035)
- 19.4. Data Triangulation and Validation
20. NOVEL ANTIBODY THERAPIES MARKET, BY TARGET INDICATION
- 20.1. Chapter Overview
- 20.2. Key Assumptions and Methodology
- 20.3. Novel Antibody Therapies Market: Distribution by Target Indication
- 20.3.1. Novel Antibody Therapies Market for HER2-PBC, Historical Trends (Since 2023) and Forecasted Estimates (Till 2035)
- 20.3.2. Novel Antibody Therapies Market for CHL, Historical Trends (Since 2023) and Forecasted Estimates (Till 2035)
- 20.3.3. Novel Antibody Therapies Market for pcALCL or CD30 MF, Historical Trends (Since 2023) and Forecasted Estimates (Till 2035)
- 20.3.4. Novel Antibody Therapies Market for PUSALCL or CD30 PTCL, Historical Trends (Since 2023) and Forecasted Estimates (Till 2035)
- 20.3.5. Novel Antibody Therapies Market for BPDCN, Historical Trends (Since 2023) and Forecasted Estimates (Till 2035)
- 20.3.6. Novel Antibody Therapies Market for RRBPALL, Historical Trends (Since 2023) and Forecasted Estimates (Till 2035)
- 20.3.7. Novel Antibody Therapies Market for RRCTL, Historical Trends (Since 2023) and Forecasted Estimates (Till 2035)
- 20.3.8. Novel Antibody Therapies Market for STS, Historical Trends (Since 2023) and Forecasted Estimates (Till 2035)
- 20.3.9. Novel Antibody Therapies Market for LAMSM, Historical Trends (Since 2023) and Forecasted Estimates (Till 2035)
- 20.3.10. Novel Antibody Therapies Market for RRAML, Historical Trends (Since 2023) and Forecasted Estimates (Till 2035)
- 20.3.11. Novel Antibody Therapies Market for DLBL, Historical Trends (Since 2023) and Forecasted Estimates (Till 2035)
- 20.3.12. Novel Antibody Therapies Market for MCRPC, Historical Trends (Since 2023) and Forecasted Estimates (Till 2035)
- 20.4. Data Triangulation and Validation
21. NOVEL ANTIBODY THERAPIES MARKET, BY TYPE OF THERAPY
- 21.1. Chapter Overview
- 21.2. Key Assumptions and Methodology
- 21.3. Novel Antibody Therapies Market: Distribution by Type of Therapy
- 21.3.1. Novel Antibody Therapies Market for Monotherapy, Historical Trends (Since 2023) and Forecasted Estimates (Till 2035)
- 21.3.2. Novel Antibody Therapies Market for Combination Therapy, Historical Trends (Since 2023) and Forecasted Estimates (Till 2035)
- 21.4. Data Triangulation and Validation
22. NOVEL ANTIBODY THERAPIES MARKET, BY ROUTE OF ADMINISTRATION
- 22.1. Chapter Overview
- 22.2. Key Assumptions and Methodology
- 22.3. Novel Antibody Therapies Market: Distribution by Route of Administration
- 22.3.1. Novel Antibody Therapies Market for Intravenous, Historical Trends (Since 2023) and Forecasted Estimates (Till 2035)
- 22.3.2. Novel Antibody Therapies Market for Intratumoral, Historical Trends (Since 2023) and Forecasted Estimates (Till 2035)
- 22.4. Data Triangulation and Validation
23. NOVEL ANTIBODY THERAPIES MARKET, BY KEY GEOGRAPHICAL REGIONS
- 23.1. Chapter Overview
- 23.2. Key Assumptions and Methodology
- 23.3. Novel Antibody Therapies Market: Distribution by Geographical Regions
- 23.3.1. Novel Antibody Therapies Market in North America, Historical Trends (Since 2023) and Forecasted Estimates (Till 2035)
- 23.3.1.1. Novel Antibody Therapies Market in the US, Historical Trends (Since 2023) and Forecasted Estimates (Till 2035)
- 23.3.1.2. Novel Antibody Therapies Market in Canada, Historical Trends (Since 2023) and Forecasted Estimates (Till 2035)
- 23.3.2. Novel Antibody Therapies Market in Europe, Historical Trends (Since 2023) and Forecasted Estimates (Till 2035)
- 23.3.2.1. Novel Antibody Therapies Market in Germany, Historical Trends (Since 2023) and Forecasted Estimates (Till 2035)
- 23.3.2.2. Novel Antibody Therapies Market in the UK, Historical Trends (Since 2023) and Forecasted Estimates (Till 2035)
- 23.3.2.3. Novel Antibody Therapies Market in France, Historical Trends (Since 2023) and Forecasted Estimates (Till 2035)
- 23.3.2.4. Novel Antibody Therapies Market in Italy, Historical Trends (Since 2023) and Forecasted Estimates (Till 2035)
- 23.3.2.5. Novel Antibody Therapies Market in Spain, Historical Trends (Since 2023) and Forecasted Estimates (Till 2035)
- 23.3.3. Novel Antibody Therapies Market in Asia-Pacific, Historical Trends (Since 2023) and Forecasted Estimates (Till 2035)
- 23.3.3.1. Novel Antibody Therapies Market in China, Historical Trends (Since 2023) and Forecasted Estimates (Till 2035)
- 23.3.3.2. Novel Antibody Therapies Market in Japan, Historical Trends (Since 2023) and Forecasted Estimates (Till 2035)
- 23.3.3.3. Novel Antibody Therapies Market in Australia, Historical Trends (Since 2023) and Forecasted Estimates (Till 2035)
- 23.3.3.4. Novel Antibody Therapies Market in New Zealand, Historical Trends (Since 2023) and Forecasted Estimates (Till 2035)
- 23.3.4. Novel Antibody Therapies Market in Middle East and North Africa, Historical Trends (Since 2023) and Forecasted Estimates (Till 2035)
- 23.3.4.1. Novel Antibody Therapies Market in Egypt, Historical Trends (Since 2023) and Forecasted Estimates (Till 2035)
- 23.3.4.2. Novel Antibody Therapies Market in South Africa, Historical Trends (Since 2023) and Forecasted Estimates (Till 2035)
- 23.3.4.3. Novel Antibody Therapies Market in Iraq, Historical Trends (Since 2023) and Forecasted Estimates (Till 2035)
- 23.3.4.4. Novel Antibody Therapies Market in Morocco, Historical Trends (Since 2023) and Forecasted Estimates (Till 2035)
- 23.3.1. Novel Antibody Therapies Market in North America, Historical Trends (Since 2023) and Forecasted Estimates (Till 2035)
- 23.4. Novel Antibody Therapies Market, By Geographical Regions: Market Dynamics Assessment
- 23.4.1. Market Movement Analysis
- 23.4.2. Penetration-Growth (P-G) Matrix
- 23.5. Data Triangulation and Validation
24. MARKET OPPORTUNITY ANALYSIS: NORTH AMERICA
- 24.1. Novel Antibody Therapies Market in North America: Distribution by Drugs
- 24.1.1. Novel Antibody Therapies Market in North America for Adcetris, Historical Trends (Since 2023) and Forecasted Estimates (Till 2035)
- 24.1.2. Novel Antibody Therapies Market in North America for Kadcyla, Historical Trends (Since 2023) and Forecasted Estimates (Till 2035)
- 24.1.3. Novel Antibody Therapies Market in North America for ELZONRIS, Historical Trends (Since 2023) and Forecasted Estimates (Till 2035)
- 24.1.4. Novel Antibody Therapies Market in North America for Besponsa, Historical Trends (Since 2023) and Forecasted Estimates (Till 2035)
- 24.1.5. Novel Antibody Therapies Market in North America for LYMPHIR, Historical Trends (Since 2023) and Forecasted Estimates (Till 2035)
- 24.1.6. Novel Antibody Therapies Market in North America for Fibromun, Historical Trends (Since 2023) and Forecasted Estimates (Till 2035)
- 24.1.7. Novel Antibody Therapies Market in North America for Nidlegy, Historical Trends (Since 2023) and Forecasted Estimates (Till 2035)
- 24.1.8. Novel Antibody Therapies Market in North America for Iomab-B, Historical Trends (Since 2023) and Forecasted Estimates (Till 2035)
- 24.1.9. Novel Antibody Therapies Market in North America for TLX 591, Historical Trends (Since 2023) and Forecasted Estimates (Till 2035)
- 24.2. Novel Antibody Therapies Market in North America: Distribution by Type of Novel Antibody
- 24.2.1. Novel Antibody Therapies Market in North America for Immunotoxins, Historical Trends (Since 2023) and Forecasted Estimates (Till 2035)
- 24.2.2. Novel Antibody Therapies Market in North America for Immunocytokines, Historical Trends (Since 2023) and Forecasted Estimates (Till 2035)
- 24.2.3. Novel Antibody Therapies Market in North America for Radioisotope Immunoconjugates, Historical Trends (Since 2023) and Forecasted Estimates (Till 2035)
- 24.3. Novel Antibody Therapies Market in North America: Distribution by Target Indication
- 24.3.1. Novel Antibody Therapies Market in North America for HER2-PBC, Historical Trends (Since 2023) and Forecasted Estimates (Till 2035)
- 24.3.2. Novel Antibody Therapies Market in North America for CHL, Historical Trends (Since 2023) and Forecasted Estimates (Till 2035)
- 24.3.3. Novel Antibody Therapies Market in North America for pcALCL or CD30 MF, Historical Trends (Since 2023) and Forecasted Estimates (Till 2035)
- 24.3.4. Novel Antibody Therapies Market in North America for PUSALCL or CD30 PTCL, Historical Trends (Since 2023) and Forecasted Estimates (Till 2035)
- 24.3.5. Novel Antibody Therapies Market in North America for BPDCN, Historical Trends (Since 2023) and Forecasted Estimates (Till 2035)
- 24.3.6. Novel Antibody Therapies Market in North America for RRBPALL, Historical Trends (Since 2023) and Forecasted Estimates (Till 2035)
- 24.3.7. Novel Antibody Therapies Market in North America for RRCTL, Historical Trends (Since 2023) and Forecasted Estimates (Till 2035)
- 24.3.8. Novel Antibody Therapies Market in North America for STS, Historical Trends (Since 2023) and Forecasted Estimates (Till 2035)
- 24.3.9. Novel Antibody Therapies Market in North America for LAMSM, Historical Trends (Since 2023) and Forecasted Estimates (Till 2035)
- 24.3.10. Novel Antibody Therapies Market in North America for RRAML, Historical Trends (Since 2023) and Forecasted Estimates (Till 2035)
- 24.3.11. Novel Antibody Therapies Market in North America for DLBL, Historical Trends (Since 2023) and Forecasted Estimates (Till 2035)
- 24.3.12. Novel Antibody Therapies Market in North America for MCRPC, Historical Trends (Since 2023) and Forecasted Estimates (Till 2035)
- 24.4. Novel Antibody Therapies Market in North America: Distribution by Type of Therapy
- 24.4.1. Novel Antibody Therapies Market in North America for Monotherapy, Historical Trends (Since 2021) and Forecasted Estimates (Till 2035)
- 24.4.2. Novel Antibody Therapies Market in North America for Combination Therapy, Historical Trends (Since 2021) and Forecasted Estimates (Till 2035)
- 24.5. Novel Antibody Therapies Market in North America: Distribution by Route of Administration
- 24.5.1. Novel Antibody Therapies Market in North America for Intravenous, Historical Trends (Since 2023) and Forecasted Estimates (Till 2035)
- 24.5.2. Novel Antibody Therapies Market in North America for Intratumoral, Historical Trends (Since 2023) and Forecasted Estimates (Till 2035)
25. MARKET OPPORTUNITY ANALYSIS: EUROPE
- 25.1. Novel Antibody Therapies Market in Europe: Distribution by Drugs
- 25.1.1. Novel Antibody Therapies Market in Europe for Adcetris, Historical Trends (Since 2023) and Forecasted Estimates (Till 2035)
- 25.1.2. Novel Antibody Therapies Market in Europe for for Kadcyla, Historical Trends (Since 2023) and Forecasted Estimates (Till 2035)
- 25.1.3. Novel Antibody Therapies Market in Europe for for ELZONRIS, Historical Trends (Since 2023) and Forecasted Estimates (Till 2035)
- 25.1.4. Novel Antibody Therapies Market in Europe for for Besponsa, Historical Trends (Since 2023) and Forecasted Estimates (Till 2035)
- 25.1.5. Novel Antibody Therapies Market in Europe for for LYMPHIR, Historical Trends (Since 2023) and Forecasted Estimates (Till 2035)
- 25.1.6. Novel Antibody Therapies Market in Europe for for Fibromun, Historical Trends (Since 2023) and Forecasted Estimates (Till 2035)
- 25.1.7. Novel Antibody Therapies Market in Europe for for Nidlegy, Historical Trends (Since 2023) and Forecasted Estimates (Till 2035)
- 25.1.8. Novel Antibody Therapies Market in Europe for for Iomab-B, Historical Trends (Since 2023) and Forecasted Estimates (Till 2035)
- 25.1.9. Novel Antibody Therapies Market in Europe for for TLX 591, Historical Trends (Since 2023) and Forecasted Estimates (Till 2035)
- 25.2. Novel Antibody Therapies Market in Europe: Distribution by Type of Novel Antibody
- 25.2.1. Novel Antibody Therapies Market in Europe for Immunotoxins, Historical Trends (Since 2023) and Forecasted Estimates (Till 2035)
- 25.2.2. Novel Antibody Therapies Market in Europe for Immunocytokines, Historical Trends (Since 2023) and Forecasted Estimates (Till 2035)
- 25.2.3. Novel Antibody Therapies Market in Europe for Radioisotope Immunoconjugates, Historical Trends (Since 2023) and Forecasted Estimates (Till 2035)
- 25.3. Novel Antibody Therapies Market in Europe: Distribution by Target Indication
- 25.3.1. Novel Antibody Therapies Market in Europe for HER2-PBC, Historical Trends (Since 2023) and Forecasted Estimates (Till 2035)
- 25.3.2. Novel Antibody Therapies Market in Europe for CHL, Historical Trends (Since 2023) and Forecasted Estimates (Till 2035)
- 25.3.3. Novel Antibody Therapies Market in Europe for pcALCL or CD30 MF, Historical Trends (Since 2023) and Forecasted Estimates (Till 2035)
- 25.3.4. Novel Antibody Therapies Market in Europe for PUSALCL or CD30 PTCL, Historical Trends (Since 2023) and Forecasted Estimates (Till 2035)
- 25.3.5. Novel Antibody Therapies Market in Europe for BPDCN, Historical Trends (Since 2023) and Forecasted Estimates (Till 2035)
- 25.3.6. Novel Antibody Therapies Market in Europe for RRBPALL, Historical Trends (Since 2023) and Forecasted Estimates (Till 2035)
- 25.3.7. Novel Antibody Therapies Market in Europe for RRCTL, Historical Trends (Since 2023) and Forecasted Estimates (Till 2035)
- 25.3.8. Novel Antibody Therapies Market in Europe for STS, Historical Trends (Since 2023) and Forecasted Estimates (Till 2035)
- 25.3.9. Novel Antibody Therapies Market in Europe for LAMSM, Historical Trends (Since 2023) and Forecasted Estimates (Till 2035)
- 25.3.10. Novel Antibody Therapies Market in Europe for RRAML, Historical Trends (Since 2023) and Forecasted Estimates (Till 2035)
- 25.3.11. Novel Antibody Therapies Market in Europe for DLBL, Historical Trends (Since 2023) and Forecasted Estimates (Till 2035)
- 25.3.12. Novel Antibody Therapies Market in Europe for MCRPC, Historical Trends (Since 2023) and Forecasted Estimates (Till 2035)
- 25.4. Novel Antibody Therapies Market in Europe: Distribution by Type of Therapy
- 25.4.1. Novel Antibody Therapies Market in Europe for Monotherapy, Historical Trends (Since 2021) and Forecasted Estimates (Till 2035)
- 25.4.2. Novel Antibody Therapies Market in Europe for Combination Therapy, Historical Trends (Since 2021) and Forecasted Estimates (Till 2035)
- 25.5. Novel Antibody Therapies Market in Europe: Distribution by Route of Administration
- 25.5.1. Novel Antibody Therapies Market in Europe for Intravenous, Historical Trends (Since 2023) and Forecasted Estimates (Till 2035)
- 25.5.2. Novel Antibody Therapies Market in Europe for Intratumoral, Historical Trends (Since 2023) and Forecasted Estimates (Till 2035)
26. MARKET OPPORTUNITY ANALYSIS: ASIA-PACIFIC
- 26.1. Novel Antibody Therapies Market in Asia-Pacific: Distribution by Drugs
- 26.1.1. Novel Antibody Therapies Market in Asia-Pacific for Adcetris, Historical Trends (Since 2023) and Forecasted Estimates (Till 2035)
- 26.1.2. Novel Antibody Therapies Market in Asia-Pacific for for Kadcyla, Historical Trends (Since 2023) and Forecasted Estimates (Till 2035)
- 26.1.3. Novel Antibody Therapies Market in Asia-Pacific for for ELZONRIS, Historical Trends (Since 2023) and Forecasted Estimates (Till 2035)
- 26.1.4. Novel Antibody Therapies Market in Asia-Pacific for for Besponsa, Historical Trends (Since 2023) and Forecasted Estimates (Till 2035)
- 26.1.5. Novel Antibody Therapies Market in Asia-Pacific for for LYMPHIR, Historical Trends (Since 2023) and Forecasted Estimates (Till 2035)
- 26.1.6. Novel Antibody Therapies Market in Asia-Pacific for for Fibromun, Historical Trends (Since 2023) and Forecasted Estimates (Till 2035)
- 26.1.7. Novel Antibody Therapies Market in Asia-Pacific for for Nidlegy, Historical Trends (Since 2023) and Forecasted Estimates (Till 2035)
- 26.1.8. Novel Antibody Therapies Market in Asia-Pacific for for Iomab-B, Historical Trends (Since 2023) and Forecasted Estimates (Till 2035)
- 26.1.9. Novel Antibody Therapies Market in Asia-Pacific for for TLX 591, Historical Trends (Since 2023) and Forecasted Estimates (Till 2035)
- 26.2. Novel Antibody Therapies Market in Asia-Pacific: Distribution by Type of Novel Antibody
- 26.2.1. Novel Antibody Therapies Market in Asia-Pacific for Immunotoxins, Historical Trends (Since 2023) and Forecasted Estimates (Till 2035)
- 26.2.2. Novel Antibody Therapies Market in Asia-Pacific for Immunocytokines, Historical Trends (Since 2023) and Forecasted Estimates (Till 2035)
- 26.2.3. Novel Antibody Therapies Market in Asia-Pacific for Radioisotope Immunoconjugates, Historical Trends (Since 2023) and Forecasted Estimates (Till 2035)
- 26.3. Novel Antibody Therapies Market in Asia-Pacific: Distribution by Target Indication
- 26.3.1. Novel Antibody Therapies Market in Asia-Pacific for HER2-PBC, Historical Trends (Since 2023) and Forecasted Estimates (Till 2035)
- 26.3.2. Novel Antibody Therapies Market in Asia-Pacific for CHL, Historical Trends (Since 2023) and Forecasted Estimates (Till 2035)
- 26.3.3. Novel Antibody Therapies Market in Asia-Pacific for pcALCL or CD30 MF, Historical Trends (Since 2023) and Forecasted Estimates (Till 2035)
- 26.3.4. Novel Antibody Therapies Market in Asia-Pacific for PUSALCL or CD30 PTCL, Historical Trends (Since 2023) and Forecasted Estimates (Till 2035)
- 26.3.5. Novel Antibody Therapies Market in Asia-Pacific for BPDCN, Historical Trends (Since 2023) and Forecasted Estimates (Till 2035)
- 26.3.6. Novel Antibody Therapies Market in Asia-Pacific for RRBPALL, Historical Trends (Since 2023) and Forecasted Estimates (Till 2035)
- 26.3.7. Novel Antibody Therapies Market in Asia-Pacific for RRCTL, Historical Trends (Since 2023) and Forecasted Estimates (Till 2035)
- 26.3.8. Novel Antibody Therapies Market in Asia-Pacific for STS, Historical Trends (Since 2023) and Forecasted Estimates (Till 2035)
- 26.3.9. Novel Antibody Therapies Market in Asia-Pacific for LAMSM, Historical Trends (Since 2023) and Forecasted Estimates (Till 2035)
- 26.3.10. Novel Antibody Therapies Market in Asia-Pacific for RRAML, Historical Trends (Since 2023) and Forecasted Estimates (Till 2035)
- 26.3.11. Novel Antibody Therapies Market in Asia-Pacific for DLBL, Historical Trends (Since 2023) and Forecasted Estimates (Till 2035)
- 26.3.12. Novel Antibody Therapies Market in Asia-Pacific for MCRPC, Historical Trends (Since 2023) and Forecasted Estimates (Till 2035)
- 26.4. Novel Antibody Therapies Market in Asia-Pacific: Distribution by Type of Therapy
- 26.4.1. Novel Antibody Therapies Market in Asia-Pacific for Monotherapy, Historical Trends (Since 2021) and Forecasted Estimates (Till 2035)
- 26.4.2. Novel Antibody Therapies Market in Asia-Pacific for Combination Therapy, Historical Trends (Since 2021) and Forecasted Estimates (Till 2035)
- 26.5. Novel Antibody Therapies Market in Asia-Pacific: Distribution by Route of Administration
- 26.5.1. Novel Antibody Therapies Market in Asia-Pacific for Intravenous, Historical Trends (Since 2023) and Forecasted Estimates (Till 2035)
- 26.5.2. Novel Antibody Therapies Market in Asia-Pacific for Intratumoral, Historical Trends (Since 2023) and Forecasted Estimates (Till 2035)
27. MARKET OPPORTUNITY ANALYSIS: MIDDLE EAST AND NORTH AFRICA
- 27.1. Novel Antibody Therapies Market in Middle East and North Africa: Distribution by Drugs
- 27.1.1. Novel Antibody Therapies Market in Middle East and North Africa for Adcetris, Historical Trends (Since 2023) and Forecasted Estimates (Till 2035)
- 27.1.2. Novel Antibody Therapies Market in Middle East and North Africa for for Kadcyla, Historical Trends (Since 2023) and Forecasted Estimates (Till 2035)
- 27.1.3. Novel Antibody Therapies Market in Middle East and North Africa for for ELZONRIS, Historical Trends (Since 2023) and Forecasted Estimates (Till 2035)
- 27.1.4. Novel Antibody Therapies Market in Middle East and North Africa for for Besponsa, Historical Trends (Since 2023) and Forecasted Estimates (Till 2035)
- 27.1.5. Novel Antibody Therapies Market in Middle East and North Africa for for LYMPHIR, Historical Trends (Since 2023) and Forecasted Estimates (Till 2035)
- 27.1.6. Novel Antibody Therapies Market in Middle East and North Africa for for Fibromun, Historical Trends (Since 2023) and Forecasted Estimates (Till 2035)
- 27.1.7. Novel Antibody Therapies Market in Middle East and North Africa for for Nidlegy, Historical Trends (Since 2023) and Forecasted Estimates (Till 2035)
- 27.1.8. Novel Antibody Therapies Market in Middle East and North Africa for for Iomab-B, Historical Trends (Since 2023) and Forecasted Estimates (Till 2035)
- 27.1.9. Novel Antibody Therapies Market in Middle East and North Africa for for TLX 591, Historical Trends (Since 2023) and Forecasted Estimates (Till 2035)
- 27.2. Novel Antibody Therapies Market in Middle East and North Africa: Distribution by Type of Novel Antibody
- 27.2.1. Novel Antibody Therapies Market in Middle East and North Africa for Immunotoxins, Historical Trends (Since 2023) and Forecasted Estimates (Till 2035)
- 27.2.2. Novel Antibody Therapies Market in Middle East and North Africa for Immunocytokines, Historical Trends (Since 2023) and Forecasted Estimates (Till 2035)
- 27.2.3. Novel Antibody Therapies Market in Middle East and North Africa for Radioisotope Immunoconjugates, Historical Trends (Since 2023) and Forecasted Estimates (Till 2035)
- 27.3. Novel Antibody Therapies Market in Middle East and North Africa: Distribution by Target Indication
- 27.3.1. Novel Antibody Therapies Market in Middle East and North Africa for HER2-PBC, Historical Trends (Since 2023) and Forecasted Estimates (Till 2035)
- 27.3.2. Novel Antibody Therapies Market in Middle East and North Africa for CHL, Historical Trends (Since 2023) and Forecasted Estimates (Till 2035)
- 27.3.3. Novel Antibody Therapies Market in Middle East and North Africa for PCALCL or CD30 MF, Historical Trends (Since 2023) and Forecasted Estimates (Till 2035)
- 27.3.4. Novel Antibody Therapies Market in Middle East and North Africa for PUSALCL or CD30 PTCL, Historical Trends (Since 2023) and Forecasted Estimates (Till 2035)
- 27.3.5. Novel Antibody Therapies Market in Middle East and North Africa for BPDCN, Historical Trends (Since 2023) and Forecasted Estimates (Till 2035)
- 27.3.6. Novel Antibody Therapies Market in Middle East and North Africa for RRBPALL, Historical Trends (Since 2023) and Forecasted Estimates (Till 2035)
- 27.3.7. Novel Antibody Therapies Market in Middle East and North Africa for RRCTL, Historical Trends (Since 2023) and Forecasted Estimates (Till 2035)
- 27.3.8. Novel Antibody Therapies Market in Middle East and North Africa for STS, Historical Trends (Since 2023) and Forecasted Estimates (Till 2035)
- 27.3.9. Novel Antibody Therapies Market in Middle East and North Africa for LAMSM, Historical Trends (Since 2023) and Forecasted Estimates (Till 2035)
- 27.3.10. Novel Antibody Therapies Market in Middle East and North Africa for RRAML, Historical Trends (Since 2023) and Forecasted Estimates (Till 2035)
- 27.3.11. Novel Antibody Therapies Market in Middle East and North Africa for DLBL, Historical Trends (Since 2023) and Forecasted Estimates (Till 2035)
- 27.3.12. Novel Antibody Therapies Market in Middle East and North Africa for MCRPC, Historical Trends (Since 2023) and Forecasted Estimates (Till 2035)
- 27.4. Novel Antibody Therapies Market in Middle East and North Africa: Distribution by Type of Therapy
- 27.4.1. Novel Antibody Therapies Market in Middle East and North Africa for Monotherapy, Historical Trends (Since 2021) and Forecasted Estimates (Till 2035)
- 27.4.2. Novel Antibody Therapies Market in Middle East and North Africa for Combination Therapy, Historical Trends (Since 2021) and Forecasted Estimates (Till 2035)
- 27.5. Novel Antibody Therapies Market in Middle East and North Africa: Distribution by Route of Administration
- 27.5.1. Novel Antibody Therapies Market in Middle East and North Africa for Intravenous, Historical Trends (Since 2023) and Forecasted Estimates (Till 2035)
- 27.5.2. Novel Antibody Therapies Market in Middle East and North Africa for Intratumoral, Historical Trends (Since 2023) and Forecasted Estimates (Till 2035)
28. NOVEL ANTIBODY THERAPIES MARKET, BY LEADING PLAYERS
- 28.1. Chapter Overview
- 28.2. Key Assumptions and Methodology
- 28.3. Novel Antibody Therapies Market: Distribution by Leading Companies
- 28.4. Data Triangulation and Validation
29. TABULATED DATA
30. LIST OF COMPANIES AND ORGANIZATIONS
List of Tables
- Table 7.1 List of Radioisotope Immunoconjugates
- Table 7.2 List of Radioisotope Immunoconjugates Developers
- Table 8.1 List of Immunocytokines
- Table 8.2 List of Immunocytokine Developers
- Table 9.1 List of Immunotoxins
- Table 9.2 List of Immunotoxin Developers
- Table 12.1 Novel Antibody Therapies: List of Publications, since 2020
- Table 13.1 Novel Antibody Therapies: List of Published Patents
- Table 14.1 Novel Antibody Therapies: List of Partnerships and Collaborations, since 2020
- Table 25.1 Radioisotope Immunoconjugates: Distribution by Stage of Development
- Table 25.2 Radioisotope Immunoconjugates: Distribution by Type of Therapy
- Table 25.3 Radioisotope Immunoconjugates: Distribution by Dosing Frequency
- Table 25.4 Radioisotope Immunoconjugates: Distribution by Route of Administration
- Table 25.5 Radioisotope Immunoconjugates: Distribution by Type of Radioisotope
- Table 25.6 Radioisotope Immunoconjugates: Distribution by Mode of Administration
- Table 25.7 Radioisotope Immunoconjugates: Distribution by Mechanism of Action
- Table 25.8 Radioisotope Immunoconjugates: Distribution by Therapeutic Area
- Table 25.9 Radioisotope Immunoconjugate Developers: Distribution by Year of Establishment
- Table 25.10 Radioisotope Immunoconjugate Developers: Distribution by Company Size
- Table 25.11 Radioisotope Immunoconjugate Developers: Distribution by Location of Headquarters
- Table 25.12 Radioisotope Immunoconjugate Developers: Distribution by Type of Developer
- Table 25.13 Most Active Players: Distribution by Number of Therapies
- Table 25.14 Immunocytokines: Distribution by Stage of Development
- Table 25.15 Immunocytokines: Distribution by Type of Cytokine
- Table 25.16 Immunocytokines: Distribution by Type of Therapy
- Table 25.17 Immunocytokines: Distribution by Dosing Frequency
- Table 25.18 Immunocytokines: Distribution by Mechanism of Action
- Table 25.19 Immunocytokines: Distribution by Mode of Administration
- Table 25.20 Immunocytokines: Distribution by Type of Antigen / Format
- Table 25.21 Immunocytokines: Distribution by Route of Administration
- Table 25.22 Immunocytokines: Distribution by Therapeutic Area
- Table 25.23 Immunocytokine Developers: Distribution by Year of Establishment
- Table 25.24 Immunocytokine Developers: Distribution by Company Size
- Table 25.25 Immunocytokine Developers: Distribution by Location of Headquarters (Region)
- Table 25.26 Immunocytokine Developers: Distribution by Location of Headquarters (Country)
- Table 25.27 Immunocytokine Developers: Distribution by Type of Developer
- Table 25.28 Most Active Players: Distribution by Number of Therapies
- Table 25.29 Immunotoxin Therapies: Distribution by Stage of Development
- Table 25.30 Immunotoxin Therapies: Distribution by Type of Toxin
- Table 25.31 Immunotoxin Therapies: Distribution by Dosing Frequency
- Table 25.32 Immunotoxin Therapies: Distribution by Type of Therapy
- Table 25.33 Immunotoxin Therapies: Distribution by Mode of Administration
- Table 25.34 Immunotoxin Therapies: Distribution by Type of Target
- Table 25.35 Immunotoxin Therapies: Distribution by Route of Administration
- Table 25.36 Immunotoxin Therapies: Distribution by Therapeutic Area
- Table 25.37 Immunotoxin Developers: Distribution by Year of Establishment
- Table 25.38 Immunotoxin Developers: Distribution by Developer Size
- Table 25.39 Immunotoxin Developers: Distribution by Location of Headquarters (Region)
- Table 25.40 Immunotoxin Developers: Distribution by Location of Headquarters (Country)
- Table 25.41 Immunotoxin Developers: Distribution by Type of Developer
- Table 25.42 Most Active Players: Distribution by Number of Therapies
- Table 25.43 Clinical Trial Analysis: Distribution by Trial Registration Year
- Table 25.44 Clinical Trial Analysis: Distribution by Trial Status
- Table 25.45 Clinical Trial Analysis: Distribution by Trial Registration Year and Trial Status
- Table 25.46 Clinical Trial Analysis: Distribution of Enrolled Patient Population by Trial Registration Year
- Table 25.47 Clinical Trial Analysis: Distribution of Enrolled Patient Population by Trial Phase
- Table 25.48 Clinical Trial Analysis: Distribution by Trial Phase
- Table 25.49 Clinical Trial Analysis: Distribution of Enrolled Patient Population by Trial Phase
- Table 25.50 Clinical Trial Analysis: Distribution by Study Design
- Table 25.51 Clinical Trial Analysis: Distribution by Target Patient Population
- Table 25.52 Clinical Trial Analysis: Distribution by Patient Gender
- Table 25.53 Clinical Trial Analysis: Distribution by Type of Sponsor / Collaborator
- Table 25.54 Most Active Players: Distribution by Number of Registered Trials
- Table 25.55 Clinical Trial Analysis: Distribution of Trials and Number of Patients Enrolled by Geography
- Table 25.56 Clinical Trial Analysis: Distribution of Enrolled Patient Population by Trial Status and Geography
- Table 25.57 Publication Analysis: Distribution by Year of Publication
- Table 25.58 Publication Analysis: Distribution by Type of Publication
- Table 25.59 Most Popular Publisher: Distribution by Number of Publications
- Table 25.60 Key Journals: Distribution by Number of Publications
- Table 25.61 Publication Analysis: Distribution by Impact Factor
- Table 25.62 Patent Analysis: Distribution by Publication Year
- Table 25.63 Patent Analysis: Distribution by Type of Patent
- Table 25.64 Patent Analysis: Distribution of Granted Patents and Patent Applications by Publication Year
- Table 25.65 Patent Analysis: Cumulative Year-wise Distribution by Type of Applicant
- Table 25.66 Patent Analysis: Distribution by Application Year
- Table 25.67 Patent Analysis: Distribution by Patent Jurisdiction (Region)
- Table 25.68 Patent Analysis: Distribution by Patent Jurisdiction (Country)
- Table 25.69 Patent Analysis: Distribution by Patent Age
- Table 25.70 Leading Industry Players: Distribution by Number of Patents
- Table 25.71 Leading Non-Industry Players: Distribution by Number of Patents
- Table 25.72 Leading Individual Assignees: Distribution by Number of Patents
- Table 25.73 Patent Benchmarking Analysis: Distribution of Patent Characteristics (CPC Codes) by Leading Industry Players
- Table 25.74 Patent Benchmarking Analysis: Distribution of Leading Industry Players by Patent Characteristics (CPC Codes)
- Table 25.75 Partnerships and Collaborations: Cumulative Year-wise Trend
- Table 25.76 Partnerships and Collaborations: Distribution by Type of Partnership
- Table 25.77 Partnerships and Collaborations: Distribution by Year and Type of Partnership
- Table 25.78 Partnerships and Collaborations: Distribution by Most Popular Drug
- Table 25.79 Partnerships and Collaborations: Distribution by Type of Partner
- Table 25.80 Most Active Players: Distribution by Number of Partnerships
- Table 25.81 Partnerships and Collaborations: Distribution by Therapeutic Area
- Table 25.82 Partnerships and Collaborations: Distribution by Therapeutic Area and Type of Partnership
- Table 25.83 Partnerships and Collaborations: Distribution by Country
- Table 25.84 Partnerships and Collaborations: Distribution by Continent
- Table 25.85 Global Novel Antibody Therapies Market, Historical Trends (since 2023) and Forecasted Estimates (till 2035) (USD Million)
- Table 25.86 Global Novel Antibody Therapies Market, Historical Trends (since 2023) and Forecasted Estimates (till 2035): Conservative Scenario (USD Million)
- Table 25.87 Global Novel Antibody Therapies Market, Historical Trends (since 2023) and Forecasted Estimates (till 2035): Optimistic Scenario (USD Million)
- Table 25.88 Novel Antibody Therapies Market: Distribution by Drug
- Table 25.89 Novel Antibody Therapies Market for Adcetris, Historical Trends (since 2023) and Forecasted Estimates (till 2035) (USD Million)
- Table 25.90 Novel Antibody Therapies Market for Kadcyla, Historical Trends (since 2023) and Forecasted Estimates (till 2035) (USD Million)
- Table 25.91 Novel Antibody Therapies Market for ELZONRIS, Historical Trends (since 2023) and Forecasted Estimates (till 2035) (USD Million)
- Table 25.92 Novel Antibody Therapies Market for Besponsa, Historical Trends (since 2023) and Forecasted Estimates (till 2035) (USD Million)
- Table 25.93 Novel Antibody Therapies Market for LYMPHIR, Historical Trends (since 2023) and Forecasted Estimates (till 2035) (USD Million)
- Table 25.94 Novel Antibody Therapies Market for Fibromun, Historical Trends (since 2023) and Forecasted Estimates (till 2035) (USD Million)
- Table 25.95 Novel Antibody Therapies Market for Nidlegy, Historical Trends (since 2023) and Forecasted Estimates (till 2035) (USD Million)
- Table 25.96 Novel Antibody Therapies Market for Iomab-B, Historical Trends (since 2023) and Forecasted Estimates (till 2035) (USD Million)
- Table 25.97 Novel Antibody Therapies Market for TLX 591, Historical Trends (since 2023) and Forecasted Estimates (till 2035) (USD Million)
- Table 25.98 Novel Antibody Therapies Market: Distribution by Type of Novel Antibody
- Table 25.99 Novel Antibody Therapies Market for Immunotoxins, Historical Trends (since 2023) and Forecasted Estimates (till 2035) (USD Million)
- Table 25.100 Novel Antibody Therapies Market for Immunocytokines, Historical Trends (since 2023) and Forecasted Estimates (till 2035) (USD Million)
- Table 25.101 Novel Antibody Therapies Market for Immunoconjugates, Historical Trends (since 2023) and Forecasted Estimates (till 2035) (USD Million)
- Table 25.102 Novel Antibody Therapies Market: Distribution by Target Indication
- Table 25.103 Novel Antibody Therapies Market for HER2-Positive Breast Cancer, Historical Trends (since 2023) and Forecasted Estimates (till 2035) (USD Million)
- Table 25.104 Novel Antibody Therapies Market for Classical Hodgkin Lymphoma, Historical Trends (since 2023) and Forecasted Estimates (till 2035) (USD Million)
- Table 25.105 Novel Antibody Therapies Market for Primary Cutaneous Anaplastic Large Cell Lymphoma or CD30-expressing Mycosis Fungoides, Historical Trends (since 2023) and Forecasted Estimates (till 2035) (USD Million)
- Table 25.106 Novel Antibody Therapies Market for Previously Untreated Systemic Anaplastic Large Cell Lymphoma or CD30-expressing Peripheral T-cell Lymphomas, Historical Trends (since 2023) and Forecasted Estimates (till 2035) (USD Million)
- Table 25.107 Novel Antibody Therapies Market for Blastic Plasmacytoid Dendritic Cell Neoplasm, Historical Trends (since 2023) and Forecasted Estimates (till 2035) (USD Million)
- Table 25.108 Novel Antibody Therapies Market for Relapsed or Refractory Cutaneous T-cell Lymphoma, Historical Trends (since 2023) and Forecasted Estimates (till 2035) (USD Million)
- Table 25.109 Novel Antibody Therapies Market for Soft Tissue Sarcoma, Historical Trends (since 2023) and Forecasted Estimates (till 2035) (USD Million)
- Table 25.110 Novel Antibody Therapies Market for Locally Advanced Melanoma / Stage III B/C Melanoma, Historical Trends (since 2023) and Forecasted Estimates (till 2035) (USD Million)
- Table 25.111 Novel Antibody Therapies Market for Relapsed/Refractory Acute Myeloid Leukemia, Historical Trends (since 2023) and Forecasted Estimates (till 2035) (USD Million)
- Table 25.112 Novel Antibody Therapies Market for Diffuse Large B-cell Lymphoma, Historical Trends (since 2023) and Forecasted Estimates (till 2035) (USD Million)
- Table 25.113 Novel Antibody Therapies Market for Metastatic Castration-resistant Prostate Cancer, Historical Trends (since 2023) and Forecasted Estimates (till 2035) (USD Million)
- Table 25.114 Novel Antibody Therapies Market: Distribution by Type of Therapy
- Table 25.115 Novel Antibody Therapies Market for Monotherapy, Historical Trends (since 2023) and Forecasted Estimates (till 2035) (USD Million)
- Table 25.116 Novel Antibody Therapies Market for Combination Therapy, Historical Trends (since 2023) and Forecasted Estimates (till 2035) (USD Million)
- Table 25.117 Novel Antibody Therapies Market: Distribution by Route of Administration
- Table 25.118 Novel Antibody Therapies Market for Intravenous Route of Administration, Historical Trends (since 2023) and Forecasted Estimates (till 2035) (USD Million)
- Table 25.119 Novel Antibody Therapies Market for Intratumoral Route of Administration, Historical Trends (since 2023) and Forecasted Estimates (till 2035) (USD Million)
- Table 25.120 Novel Antibody Therapies Market: Distribution by Key Geographical Regions
- Table 25.121 Novel Antibody Therapies Market in North America, Historical Trends (since 2023) and Forecasted Estimates (till 2035) (USD Million)
- Table 25.122 Novel Antibody Therapies Market in the US, Historical Trends (since 2023) and Forecasted Estimates (till 2035) (USD Million)
- Table 25.123 Novel Antibody Therapies Market in Canada, Historical Trends (since 2023) and Forecasted Estimates (till 2035) (USD Million)
- Table 25.124 Novel Antibody Therapies Market in Europe, Historical Trends (since 2023) and Forecasted Estimates (till 2035) (USD Million)
- Table 25.125 Novel Antibody Therapies Market in Germany, Historical Trends (since 2023) and Forecasted Estimates (till 2035) (USD Million)
- Table 25.126 Novel Antibody Therapies Market in the UK Historical Trends (since 2023) and Forecasted Estimates (till 2035) (USD Million)
- Table 25.127 Novel Antibody Therapies Market in France, Historical Trends (since 2023) and Forecasted Estimates (till 2035) (USD Million)
- Table 25.128 Novel Antibody Therapies Market in Italy, Historical Trends (since 2023) and Forecasted Estimates (till 2035) (USD Million)
- Table 25.129 Novel Antibody Therapies Market in Spain, Historical Trends (since 2023) and Forecasted Estimates (till 2035) (USD Million)
- Table 25.130 Novel Antibody Therapies Market in Asia-Pacific, Historical Trends (since 2023) and Forecasted Estimates (till 2035) (USD Million)
- Table 25.131 Novel Antibody Therapies Market in China, Historical Trends (since 2023) and Forecasted Estimates (till 2035) (USD Million)
- Table 25.132 Novel Antibody Therapies Market in Japan, Historical Trends (since 2023) and Forecasted Estimates (till 2035) (USD Million)
- Table 25.133 Novel Antibody Therapies Market in Australia, Historical Trends (since 2023) and Forecasted Estimates (till 2035) (USD Million)
- Table 25.134 Novel Antibody Therapies Market in New Zealand, Historical Trends (since 2023) and Forecasted Estimates (till 2035) (USD Million)
- Table 25.135 Novel Antibody Therapies Market in Middle East and Africa, Historical Trends (since 2023) and Forecasted Estimates (till 2035) (USD Million)
- Table 25.136 Novel Antibody Therapies Market in Egypt, Historical Trends (since 2023) and Forecasted Estimates (till 2035) (USD Million)
- Table 25.137 Novel Antibody Therapies Market in South Africa, Historical Trends (since 2023) and Forecasted Estimates (till 2035) (USD Million)
- Table 25.138 Novel Antibody Therapies Market in Iraq, Historical Trends (since 2023) and Forecasted Estimates (till 2035) (USD Million)
- Table 25.139 Novel Antibody Therapies Market in Morocco, Historical Trends (since 2023) and Forecasted Estimates (till 2035) (USD Million)
- Table 25.140 Novel Antibody Therapies Market: Distribution by Leading Players, Current Year (based on sales of therapies)
- Table 25.141 Novel Antibody Therapies Market: Distribution by Leading Players, 2035 (based on sales of therapies)
List of Figures
- Figure 2.1 Research Methodology: Project Methodology
- Figure 2.2 Research Methodology: Data Sources for Secondary Research
- Figure 2.3 Research Methodology: Robust Quality Control
- Figure 3.1 Market Dynamics: Forecast Methodology
- Figure 3.2 Market Dynamics: Market Assessment Framework
- Figure 3.3 Market Dynamics: Example List of Parameters
- Figure 4.1 Historical Analysis of Past Recessions and Lessons Learnt
- Figure 5.1 Executive Summary: Market Landscape
- Figure 5.2 Executive Summary: Market Trends
- Figure 5.3 Executive Summary: Market Forecast and Opportunity Analysis
- Figure 6.1 Therapeutic Antibodies: Developmental Approaches
- Figure 6.2 Mechanism of Action of Antibody-Directed Enzyme Prodrug Therapies
- Figure 6.3 Mechanism of Action of TCR like Antibodies
- Figure 6.4 Mechanism of Action of Radioisotope Immunoconjugates
- Figure 6.5 Mechanism of Action of Immunotoxins
- Figure 6.6 Mechanism of Action of Intracellular Antibodies
- Figure 6.7 Mechanism of Action of Immunocytokines
- Figure 7.1 Radioisotope Immunoconjugates: Distribution by Stage of Development
- Figure 7.2 Radioisotope Immunoconjugates: Distribution by Type of Therapy
- Figure 7.3 Radioisotope Immunoconjugates: Distribution by Route of Administration
- Figure 7.4 Radioisotope Immunoconjugates: Distribution by Dosing Frequency
- Figure 7.5 Radioisotope Immunoconjugates: Distribution by Type of Radioisotope
- Figure 7.6 Radioisotope Immunoconjugates: Distribution by Mode of Administration
- Figure 7.7 Radioisotope Immunoconjugates: Distribution by Mechanism of Action
- Figure 7.8 Radioisotope Immunoconjugates: Distribution by Therapeutic Area
- Figure 7.9 Radioisotope Immunoconjugate Developers: Distribution by Year of Establishment
- Figure 7.10 Radioisotope Immunoconjugate Developers: Distribution by Company Size
- Figure 7.11 Radioisotope Immunoconjugate Developers: Distribution by Location of Headquarters
- Figure 7.12 Radioisotope Immunoconjugate Developers: Distribution by Type of Developer
- Figure 7.13 Most Active Players: Distribution by Number of Therapies
- Figure 8.1 Immunocytokines: Distribution by Stage of Development
- Figure 8.2 Immunocytokines: Distribution by Type of Cytokine
- Figure 8.3 Immunocytokines: Distribution by Type of Therapy
- Figure 8.4 Immunocytokines: Distribution by Dosing Frequency
- Figure 8.5 Immunocytokines: Distribution by Mechanism of Action
- Figure 8.6 Immunocytokines: Distribution by Mode of Administration
- Figure 8.7 Immunocytokines: Distribution by Type of Antigen / Format
- Figure 8.8 Immunocytokines: Distribution by Route of Administration
- Figure 8.9 Immunocytokines: Distribution by Therapeutic Area
- Figure 8.10 Immunocytokine Developers: Distribution by Year of Establishment
- Figure 8.11 Immunocytokine Developers: Distribution by Company Size
- Figure 8.12 Immunocytokine Developers: Distribution by Location of Headquarters (Region)
- Figure 8.13 Immunocytokine Developers: Distribution by Location of Headquarters (Country)
- Figure 8.14 Immunocytokine Developers: Distribution by Type of Developer
- Figure 8.15 Most Active Players: Distribution by Number of Therapies
- Figure 9.1 Immunotoxin Therapies: Distribution by Stage of Development
- Figure 9.2 Immunotoxin Therapies: Distribution by Type of Toxin
- Figure 9.3 Immunotoxin Therapies: Distribution by Dosing Frequency
- Figure 9.4 Immunotoxin Therapies: Distribution by Type of Therapy
- Figure 9.5 Immunotoxin Therapies: Distribution by Mode of Administration
- Figure 9.6 Immunotoxin Therapies: Distribution by Type of Target
- Figure 9.7 Immunotoxin Therapies: Distribution by Mechanism of Action
- Figure 9.8 Immunotoxin Therapies: Distribution by Route of Administration
- Figure 9.9 Immunotoxin Therapies: Distribution by Therapeutic Area
- Figure 9.10 Immunotoxin Developers: Distribution by Year of Establishment
- Figure 9.11 Immunotoxin Developers: Distribution by Developer Size
- Figure 9.12 Immunotoxin Developers: Distribution by Location of Headquarters (Region)
- Figure 9.13 Immunotoxin Developers: Distribution by Location of Headquarters (Country)
- Figure 9.14 Immunotoxin Developers: Distribution by Type of Developer
- Figure 9.15 Most Active Players: Distribution by Number of Therapies
- Figure 11.1 Clinical Trial Analysis: Distribution by Trial Registration Year
- Figure 11.2 Clinical Trial Analysis: Distribution by Trial Status
- Figure 11.3 Clinical Trial Analysis: Distribution by Trial Registration Year and Trial Status
- Figure 11.4 Clinical Trial Analysis: Distribution of Enrolled Patient Population by Trial Registration Year
- Figure 11.5 Clinical Trial Analysis: Distribution of Enrolled Patient Population by Trial Phase
- Figure 11.6 Clinical Trial Analysis: Distribution by Trial Phase
- Figure 11.7 Clinical Trial Analysis: Distribution of Enrolled Patient Population by Trial Phase
- Figure 11.8 Clinical Trial Analysis: Distribution by Study Design
- Figure 11.9 Clinical Trial Analysis: Distribution by Target Patient Population
- Figure 11.10 Clinical Trial Analysis: Distribution by Patient Gender
- Figure 11.11 Clinical Trial Analysis: Distribution by Type of Sponsor / Collaborator
- Figure 11.12 Most Active Players: Distribution by Number of Registered Trials
- Figure 11.13 Clinical Trial Analysis: Distribution of Trials and Number of Patients Enrolled by Geography
- Figure 11.14 Clinical Trial Analysis: North America: Key Insights
- Figure 11.15 Clinical Trial Analysis: Europe: Key Insights
- Figure 11.16 Clinical Trial Analysis: Asia-Pacific: Key Insights
- Figure 11.17 Clinical Trial Analysis: Rest of the World: Key Insights
- Figure 11.18 Clinical Trial Analysis: Distribution of Enrolled Patient Population by Trial Status and Geography
- Figure 12.1 Publication Analysis: Distribution by Year of Publication
- Figure 12.2 Publication Analysis: Distribution by Type of Publication
- Figure 12.3 Most Popular Publisher: Distribution by Number of Publications
- Figure 12.4 Key Journals: Distribution by Number of Publications
- Figure 12.5 Publication Analysis: Distribution by Impact Factor
- Figure 13.1 Patent Analysis: Distribution by Publication Year
- Figure 13.2 Patent Analysis: Distribution by Type of Patent
- Figure 13.3 Patent Analysis: Distribution of Granted Patents and Patent Applications by Publication Year
- Figure 13.4 Patent Analysis: Cumulative Year-wise Distribution by Type of Applicant
- Figure 13.5 Patent Analysis: Distribution by Application Year
- Figure 13.6 Patent Analysis: Distribution by Patent Jurisdiction (Region)
- Figure 13.7 Patent Analysis: Distribution by Patent Jurisdiction (Country)
- Figure 13.8 Patent Analysis: Distribution by Patent Age
- Figure 13.9 Leading Industry Players: Distribution by Number of Patents
- Figure 13.10 Leading Non-Industry Players: Distribution by Number of Patents
- Figure 13.11 Leading Individual Assignees: Distribution by Number of Patents
- Figure 13.12 Patent Benchmarking Analysis: Distribution of Patent Characteristics (CPC Codes) by Leading Industry Players
- Figure 13.13 Patent Benchmarking Analysis: Distribution of Leading Industry Players by Patent Characteristics (CPC Codes)
- Figure 13.14 Patent Analysis: Distribution by CPC Symbols
- Figure 13.15 Novel Antibody Therapies Market: Patent Valuation
- Figure 14.1 Partnerships and Collaborations: Cumulative Year-wise Trend
- Figure 14.2 Partnerships and Collaborations: Distribution by Type of Partnership
- Figure 14.3 Partnerships and Collaborations: Distribution by Year and Type of Partnership
- Figure 14.4 Partnerships and Collaborations: Distribution by Most Popular Drug
- Figure 14.5 Partnerships and Collaborations: Distribution by Type of Partner
- Figure 14.6 Most Active Players: Distribution by Number of Partnerships
- Figure 14.7 Partnerships and Collaborations: Distribution by Therapeutic Area
- Figure 14.8 Partnerships and Collaborations: Distribution by Therapeutic Area and Type of Partnership
- Figure 14.9 Partnerships and Collaborations: Distribution by Country
- Figure 14.10 Partnerships and Collaborations: Distribution by Continent
- Figure 15.1 Benchmarking of Big Pharma Players: Distribution by Developer Strength
- Figure 15.2 Benchmarking of Big Pharma Players: Distribution by Portfolio Strength
- Figure 15.3 Benchmarking of Big Pharma Players: Distribution by Portfolio Diversity
- Figure 15.4 Benchmarking of Big Pharma Initiatives: Spider Web Analysis
- Figure 15.5 Big Pharma Initiatives: Harvey Ball Analysis
- Figure 15.6 Big Pharma Initiatives: Benchmarking: Wind Rose Chart
- Figure 16.1 Market Trends and Outlook: Growth Drivers
- Figure 16.2 Market Trends and Outlook: Growth Restraints
- Figure 16.3 Market Trends and Outlook: Market Opportunities
- Figure 16.4 Market Trends and Outlook: Market Challenges
- Figure 17.1 Global Novel Antibody Therapies Market, Historical Trends (since 2023) and Forecasted Estimates (till 2035) (USD Million)
- Figure 17.2 Global Novel Antibody Therapies Market, Historical Trends (since 2023) and Forecasted Estimates (till 2035): Conservative Scenario (USD Million)
- Figure 17.3 Global Novel Antibody Therapies Market, Historical Trends (since 2023) and Forecasted Estimates (till 2035): Optimistic Scenario (USD Million)
- Figure 18.1 Novel Antibody Therapies Market: Distribution by Drug
- Figure 18.2 Novel Antibody Therapies Market for Adcetris, Historical Trends (since 2023) and Forecasted Estimates (till 2035) (USD Million)
- Figure 18.3 Novel Antibody Therapies Market for Kadcyla, Historical Trends (since 2023) and Forecasted Estimates (till 2035) (USD Million)
- Figure 18.4 Novel Antibody Therapies Market for ELZONRIS, Historical Trends (since 2023) and Forecasted Estimates (till 2035) (USD Million)
- Figure 18.5 Novel Antibody Therapies Market for Besponsa, Historical Trends (since 2023) and Forecasted Estimates (till 2035) (USD Million)
- Figure 18.6 Novel Antibody Therapies Market for LYMPHIR, Historical Trends (since 2023) and Forecasted Estimates (till 2035) (USD Million)
- Figure 18.7 Novel Antibody Therapies Market for Fibromun, Historical Trends (since 2023) and Forecasted Estimates (till 2035) (USD Million)
- Figure 18.8 Novel Antibody Therapies Market for Nidlegy, Historical Trends (since 2023) and Forecasted Estimates (till 2035) (USD Million)
- Figure 18.9 Novel Antibody Therapies Market for Iomab-B, Historical Trends (since 2023) and Forecasted Estimates (till 2035) (USD Million)
- Figure 18.10 Novel Antibody Therapies Market for TLX 591, Historical Trends (since 2023) and Forecasted Estimates (till 2035) (USD Million)
- Figure 19.1 Novel Antibody Therapies Market: Distribution by Type of Novel Antibody
- Figure 19.2 Novel Antibody Therapies Market for Immunotoxins, Historical Trends (since 2023) and Forecasted Estimates (till 2035) (USD Million)
- Figure 19.3 Novel Antibody Therapies Market for Immunocytokines, Historical Trends (since 2023) and Forecasted Estimates (till 2035) (USD Million)
- Figure 19.4 Novel Antibody Therapies Market for Immunoconjugates, Historical Trends (since 2023) and Forecasted Estimates (till 2035) (USD Million)
- Figure 20.1 Novel Antibody Therapies Market: Distribution by Target Indication
- Figure 20.2 Novel Antibody Therapies Market for HER2-Positive Breast Cancer, Historical Trends (since 2023) and Forecasted Estimates (till 2035) (USD Million)
- Figure 20.3 Novel Antibody Therapies Market for Classical Hodgkin Lymphoma, Historical Trends (since 2023) and Forecasted Estimates (till 2035) (USD Million)
- Figure 20.4 Novel Antibody Therapies Market for Primary Cutaneous Anaplastic Large Cell Lymphoma or CD30-expressing Mycosis Fungoides, Historical Trends (since 2023) and Forecasted Estimates (till 2035) (USD Million)
- Figure 20.5 Novel Antibody Therapies Market for Previously Untreated Systemic Anaplastic Large Cell Lymphoma or CD30-expressing Peripheral T-cell Lymphomas, Historical Trends (since 2023) and Forecasted Estimates (till 2035) (USD Million)
- Figure 20.6 Novel Antibody Therapies Market for Blastic Plasmacytoid Dendritic Cell Neoplasm, Historical Trends (since 2023) and Forecasted Estimates (till 2035) (USD Million)
- Figure 20.7 Novel Antibody Therapies Market for Relapsed or Refractory Cutaneous T-cell Lymphoma, Historical Trends (since 2023) and Forecasted Estimates (till 2035) (USD Million)
- Figure 20.8 Novel Antibody Therapies Market for Soft Tissue Sarcoma, Historical Trends (since 2023) and Forecasted Estimates (till 2035) (USD Million)
- Figure 20.9 Novel Antibody Therapies Market for Locally Advanced Melanoma / Stage III B/C Melanoma, Historical Trends (since 2023) and Forecasted Estimates (till 2035) (USD Million)
- Figure 20.10 Novel Antibody Therapies Market for Relapsed/Refractory Acute Myeloid Leukemia, Historical Trends (since 2023) and Forecasted Estimates (till 2035) (USD Million)
- Figure 20.11 Novel Antibody Therapies Market for Diffuse Large B-cell Lymphoma, Historical Trends (since 2023) and Forecasted Estimates (till 2035) (USD Million)
- Figure 20.12 Novel Antibody Therapies Market for Metastatic Castration-resistant Prostate Cancer, Historical Trends (since 2023) and Forecasted Estimates (till 2035) (USD Million)
- Figure 21.1 Novel Antibody Therapies Market: Distribution by Type of Therapy
- Figure 21.2 Novel Antibody Therapies Market for Monotherapy, Historical Trends (since 2023) and Forecasted Estimates (till 2035) (USD Million)
- Figure 21.3 Novel Antibody Therapies Market for Combination Therapy, Historical Trends (since 2023) and Forecasted Estimates (till 2035) (USD Million)
- Figure 22.1 Novel Antibody Therapies Market: Distribution by Route of Administration
- Figure 22.2 Novel Antibody Therapies Market for Intravenous Route of Administration, Historical Trends (since 2023) and Forecasted Estimates (till 2035) (USD Million)
- Figure 22.3 Novel Antibody Therapies Market for Intratumoral Route of Administration, Historical Trends (since 2023) and Forecasted Estimates (till 2035) (USD Million)
- Figure 23.1 Novel Antibody Therapies Market: Distribution by Key Geographical Regions
- Figure 23.2 Novel Antibody Therapies Market in North America, Historical Trends (since 2023) and Forecasted Estimates (till 2035) (USD Million)
- Figure 23.3 Novel Antibody Therapies Market in the US, Historical Trends (since 2023) and Forecasted Estimates (till 2035) (USD Million)
- Figure 23.4 Novel Antibody Therapies Market in Canada, Historical Trends (since 2023) and Forecasted Estimates (till 2035) (USD Million)
- Figure 23.5 Novel Antibody Therapies Market in Europe, Historical Trends (since 2023) and Forecasted Estimates (till 2035) (USD Million)
- Figure 23.6 Novel Antibody Therapies Market in Germany, Historical Trends (since 2023) and Forecasted Estimates (till 2035) (USD Million)
- Figure 23.7 Novel Antibody Therapies Market in the UK, Historical Trends (since 2023) and Forecasted Estimates (till 2035) (USD Million)
- Figure 23.8 Novel Antibody Therapies Market in France, Historical Trends (since 2023) and Forecasted Estimates (till 2035) (USD Million)
- Figure 23.9 Novel Antibody Therapies Market in Italy, Historical Trends (since 2023) and Forecasted Estimates (till 2035) (USD Million)
- Figure 23.10 Novel Antibody Therapies Market in Spain, Historical Trends (since 2023) and Forecasted Estimates (till 2035) (USD Million)
- Figure 23.11 Novel Antibody Therapies Market in Asia-Pacific, Historical Trends (since 2023) and Forecasted Estimates (till 2035) (USD Million)
- Figure 23.12 Novel Antibody Therapies Market in China, Historical Trends (since 2023) and Forecasted Estimates (till 2035) (USD Million)
- Figure 23.13 Novel Antibody Therapies Market in Japan, Historical Trends (since 2023) and Forecasted Estimates (till 2035) (USD Million)
- Figure 23.14 Novel Antibody Therapies Market in Australia, Historical Trends (since 2023) and Forecasted Estimates (till 2035) (USD Million)
- Figure 23.15 Novel Antibody Therapies Market in New Zealand, Historical Trends (since 2023) and Forecasted Estimates (till 2035) (USD Million)
- Figure 23.16 Novel Antibody Therapies Market in Middle East and Africa, Historical Trends (since 2023) and Forecasted Estimates (till 2035) (USD Million)
- Figure 23.17 Novel Antibody Therapies Market in Egypt, Historical Trends (since 2023) and Forecasted Estimates (till 2035) (USD Million)
- Figure 23.18 Novel Antibody Therapies Market in South Africa, Historical Trends (since 2023) and Forecasted Estimates (till 2035) (USD Million)
- Figure 23.19 Novel Antibody Therapies Market in Iraq, Historical Trends (since 2023) and Forecasted Estimates (till 2035) (USD Million)
- Figure 23.20 Novel Antibody Therapies Market in Morocco, Historical Trends (since 2023) and Forecasted Estimates (till 2035) (USD Million)
- Figure 23.21 Penetration Growth (P-G) Matrix: Key Geographical Regions
- Figure 23.22 Market Movement Analysis: Key Geographical Regions
- Figure 24.1 Novel Antibody Therapies Market: Distribution by Leading Players, Current Year (based on sales of therapies)
- Figure 24.2 Novel Antibody Therapies Market: Distribution by Leading Players, 2035 (based on sales of therapies)
 對雙特異性抗體藥物複合體(BsADCs)的全球臨床試驗、監管核准、開發平台和市場機會的洞察(2026 年)
 抗CD4抗體市場報告:趨勢、預測和競爭分析(至2035年)
 抗體雞尾酒療法市場:按類型、適應症、分銷管道和地區分類
 FC 和糖基工程抗體市場分析及預測至 2035 年:按類型、產品類型、服務、技術、應用、最終用戶、製程、功能、安裝類型、模式抗體市場分析及預測(至2035年):類型、產品類型、服務、技術、應用、最終用戶、形式、製程、功能、組件新一代抗體療法市場分析及預測(至2035年):按類型、產品類型、技術、應用、製程、最終用戶、開發階段、實施類型、功能和模式分類全球HER2抗體市場規模、佔有率、趨勢和成長分析報告(2026-2034年)
 抗體介導的排斥反應市場-全球、區域和國家層面的分析與預測(2025-2035 年)
 FAP抗體市場按產品類型、技術、應用、最終用戶和分銷管道分類,全球預測(2026-2032年)內參抗體市場按產品類型、技術、應用、最終用戶和分銷管道分類-2026-2032年全球預測