


 |
市場調查報告書
商品編碼
1883724
量子運算市場:產業趨勢及2035年全球預測-依藥物發現服務類型、治療領域及主要地區劃分Quantum Computing Market: Industry Trends and Global Forecasts,Till 2035 - Distribution by Type of Drug Discovery Service Offered, Therapeutic Area and Key Geographical Regions |
||||||
全球量子運算市場概覽
根據Roots Analysis預測,全球量子運算市場在預測期內將以14.5%的複合年增長率成長,從目前的4.22億美元成長至16.33億美元。
市場規模與機會分析依下列參數分類:
提供的藥物發現服務類型
- 標靶識別/驗證
- 先導化合物發現/篩選
- 先導化合物優化
治療領域
- 心血管疾病
- 中樞神經系統疾病
- 皮膚病
- 內分泌疾病
- 胃腸道疾病
- 免疫系統疾病
- 傳染病
- 肌肉骨骼疾病
- 腫瘤疾病
- 呼吸系統疾病
- 其他
主要地區
- 北部美洲
- 歐洲
- 亞太地區
- 中東和北非
- 拉丁美洲
全球量子運算市場 - 成長與趨勢
將一種藥物推向市場平均需要 10-15 年的時間和 40-100 億美元的投資,這使得藥物研發過程漫長且資源密集。為了因應這些挑戰,研究人員正摒棄傳統方法,轉而採用創新的藥物研發策略。量子運算在藥物研發領域正成為一項關鍵技術,用於識別具有所需理化和藥物動力學特性的有前景的先導化合物,從而無需進行大量的篩選。量子計算的工作原理與依賴電壓驅動原理的傳統二進位計算機截然不同。與傳統計算中單一位元的 0-1 態不同,量子運算利用量子力學的概念,採用超導電路和離子阱等技術。這使得量子疊加成為可能——量子位元(qubit)可以同時處於 0 和 1 狀態。
近年來,量子計算取得了顯著進展,透過改進藥物與目標患者相互作用的映射,並減少與藥物研發相關的時間和成本,對製藥和醫療保健行業產生了深遠影響。此外,量子運算帶來的優勢和日益增長的需求,尤其是在生物製藥領域用於藥物發現和生產,預計將為服務提供者創造豐厚的商機。
全球量子運算市場-關鍵洞察
本報告深入分析了全球量子運算市場的現狀,並指出了該行業潛在的成長機會。主要發現包括:
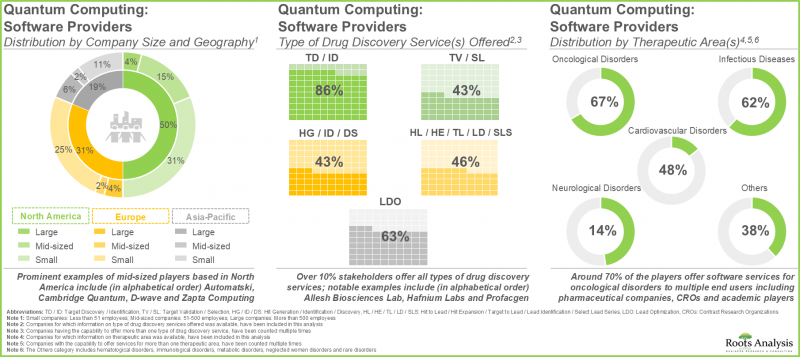
- 目前,全球已有超過 45 家公司致力於在藥物發現過程的各個階段提供量子運算服務。
- 憑藉自身專業知識,86% 的利害關係人提供涵蓋整個標靶發現和識別流程的服務,主要專注於腫瘤疾病。
- 為了獲得競爭優勢,製造商聲稱正在穩步擴展其現有能力,以加強其量子計算相關服務組合。
- 已向積極進行研發工作的各個組織授予超過 7000 萬美元的資助,以評估量子計算在藥物發現中的潛力。
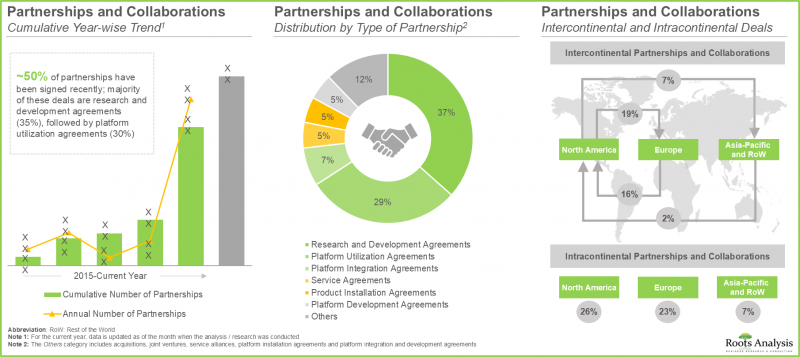
- 近年來,合作活動顯著增加,近 50% 的合作關係是在同一地區的公司之間達成的。
- 這些協定中,大部分是研發協議(35%),其次是平台存取協定(30%)。
- 全球有超過30家公司聲稱提供用於藥物研發的量子計算硬體即服務 (HaaS),並開發了各種計算方法所需的專業知識。
- 大多數量子運算硬體供應商總部位於北美,成立於2000年之前。事實上,大約50%的市場佔有率由大型公司佔。
- 量子運算在生物製藥產業的日益普及預計將為軟體和硬體供應商創造豐厚的商機。
- 根據先鋒、推手和堅持者的分類圖,將軟體供應商分為不同類別。預期部分先鋒公司將在長期內提供市場領先的價值主張。
- 預計未來十年,市場將以每年 14.5% 的速度成長。這一機會很可能均勻分佈在藥物研發服務類型、治療領域和主要地區。
全球量子運算市場 - 主要區隔市場
先導化合物優化區隔市場佔量子運算市場最大佔有率
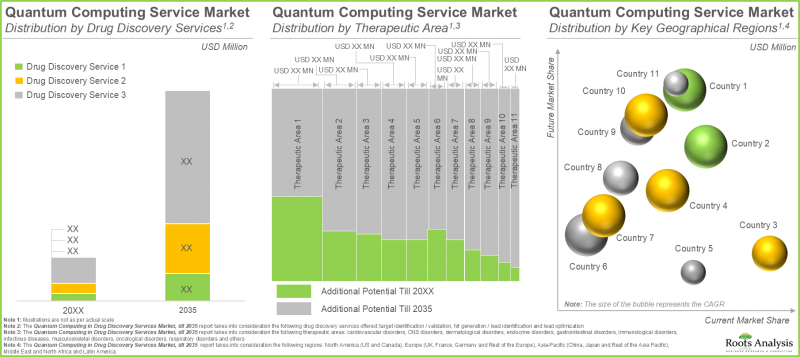
根據所提供的藥物發現服務,市場可區隔為標靶識別/驗證、先導化合物生成/識別和先導化合物優化。目前,先導化合物優化區隔市場佔了大部分市場佔有率(約 62%)。此外,該區隔市場的成長速度可能快於其他區隔市場。
量子運算市場中成長最快的治療領域是中樞神經系統疾病。
依治療領域劃分,市場可分為心血管疾病、中樞神經系統疾病、皮膚病、內分泌疾病、胃腸道疾病、免疫系統疾病、傳染病、肌肉骨骼疾病、腫瘤疾病、呼吸系統疾病及其他疾病。目前,腫瘤疾病領域在量子計算市場中佔最大佔有率。此外,中樞神經系統疾病領域預計將以相對較高的複合年增長率成長。
北美佔最大的市佔率。
依主要地區劃分,市場分為北美、歐洲、亞太、中東和北非以及拉丁美洲。目前,北美(48%)在量子計算市場中處於領先地位,佔最大的收入佔有率。然而,預計亞太地區的市場將以更高的複合年增長率成長。
全球量子運算市場代表性公司
- 埃森哲
- 亞馬遜網路服務
- Atos
- 富士通
- 華為
- IBM
- 微軟
- Xanadu
- XtalPi
全球量子計算市場 - 研究範圍
- 市場規模和機會分析:本報告對全球量子計算市場進行了詳細分析,重點關注關鍵市場區隔領域,例如[A] 提供的藥物發現服務類型,[B] 治療領域,以及[C] 主要地區。
- 軟體供應商市場概覽:本報告對量子計算軟體公司進行了全面評估,考慮了以下各項參數:[A] 成立年份,[B] 公司規模,[C] 總部所在地,[D] 業務能力,[E] 平台能力,[F] 提供的藥物發現服務類型,[G] 支持的分子類型,[E] 平台能力,[F] 提供的藥物發現服務類型,[G] 支持的分子類型,[H] 兼容的計算方法,
- 公司競爭分析:對量子運算軟體公司進行深入的競爭分析。檢視以下因素:[A] 公司實力,[B] 產品組合實力,以及 [C] 產品組合多樣性。
- 公司簡介:詳細介紹量子運算軟體/硬體公司。重點關注:[A] 公司概況,[B] 財務資訊(如有),[C] 服務組合,以及 [E] 近期發展和未來展望。
- 軟體供應商市場概況:對量子運算硬體公司進行全面評估,考慮以下各項參數:[A] 成立年份,[B] 公司規模,[C] 總部所在地,[D] 提供的服務類型,[E] 雲端資料存儲,以及 [F] 支援的運算技術。
- 資助分析:基於以下相關參數,對 170 多項專注於藥物研發中量子計算的學術資助項目進行深入分析:[A] 資助年份,[B] 資助金額,[C] 資助期限,[D] 研究部門類型,[E] 管理中心,[F] 資助類型,[G] 活動代碼,[H] 資助機制和資助機構受資助機構所在地,[L] 主要受資助機構,[M] 機構類型,[N] 授予主要受資助機構的資助金額。
- 合作夥伴關係與合作:對該領域利害關係人之間達成的各種合作關係和夥伴關係進行全面分析。分析以[A]合作年份、[B]合作類型和[C]區域活動為基礎。
- 應用案例研究:對量子計算應用進行深入分析,重點介紹其在各個行業的應用,例如[A]化學工業、[B]網路安全、[C]金融建模、[D]太空科學、[E]石油和天然氣行業以及[F]天氣預報。
- 波特五力分析:深入分析量子運算藥物研發市場的五種競爭力量,包括新進業者的威脅、買方的議價能力、供應商的議價能力、替代品的威脅以及現有競爭對手之間的競爭動態。
- 藍海策略:新創企業進入競爭激烈市場的策略指南:基於藍海策略對當前和未來市場進行詳細分析。本綜合指南為該行業的新興企業提供策略規劃和指導,幫助他們開發尚未開發的市場。
目錄
第一章:引言
第二章:摘要整理
第三章:導論
第四章:市場格局:軟體供應商
- 量子運算軟體供應商:市場格局
第五章:競爭分析
- 研究方法與關鍵參數
- 評分標準
- 公司競爭分析:北美公司(同業組 I)
- 公司競爭分析:歐洲公司(同業組 II)
- 公司競爭分析:亞太及其他地區(同業組 III)
第六章:公司簡介:軟體供應商
- 埃森哲
- Atos
- 富士通
- 華為
- 微軟
- Xanadu
- XtalPi
第七章:市場概況:硬體供應商
- 量子運算硬體供應商:市場概覽
第八章:公司簡介:硬體供應商
- 亞馬遜網路服務
- IBM
- 微軟
第九章:學術資助分析
第十章:合作夥伴關係與合作
第十一章:應用個案研究
- 量子計算概述
- 量子計算在各行業的應用
- 量子運算的未來趨勢
- 未來展望
第十二章:波特五力分析
第十三章:藍海策略:新創企業進入競爭激烈市場的策略指引
- 藍海策略概述
第十四章 市場規模與機會分析
- 預測研究方法與關鍵假設
- 藥物發現服務中的量子運算市場:至2035年
- 藥物發現服務中的量子計算市場(至2035年):依藥物發現服務類型分析
- 藥物發現服務中的量子計算市場(至2035年):依治療領域分析
- 藥物發現服務中的量子計算市場(至2035年):依主要地區分析
第十五章 高階主管洞察
第十六章 附錄1:表格資料
第十七章 附錄2:公司與組織清單
Global Quantum Computing Market: Overview
As per Roots Analysis, the global quantum computing market is expected to grow from USD 422 million in the current year to USD 1,633 million, at a CAGR of 14.5% during the forecast period.
The market sizing and opportunity analysis has been segmented across the following parameters:
Type of Drug Discovery Service Offered
- Target Identification / Validation
- Hit Generation / Lead Identification
- Lead Optimization
Therapeutic Area
- Cardiovascular Disorders
- CNS Disorders
- Dermatological Disorders
- Endocrine Disorders
- Gastrointestinal Disorders
- Immunological Disorders
- Infectious Diseases
- Musculoskeletal Disorders
- Oncological Disorders
- Respiratory Disorders
- Others
Key Geographical Regions
- North America
- Europe
- Asia-Pacific
- Middle East and North Africa
- Latin America
Global Quantum Computing Market: Growth and Trends
On average, it requires 10-15 years and investments ranging from USD 4-10 billion to bring a drug to market, which renders the drug discovery process lengthy and resource intensive. To tackle these issues, developers are moving away from conventional methods towards the implementation of innovative discovery approaches. Quantum computing in drug discovery has become a key technology that helps identify promising lead candidates with the necessary physiochemical and pharmacokinetic properties, eliminating the need for extensive screening processes. Quantum computing functions in a fundamentally different manner compared to conventional binary computers, which depend on voltage-driven principles. In contrast to the distinct 0 and 1 states of single bits in conventional computing. Quantum computing leverages the concepts of quantum mechanics, using methods such as superconducting circuits or ion traps. This allows them to attain quantum superposition - a condition where quantum bits (qubits) can be in a concurrent state of both 0 and 1.
In recent years, quantum computing has advanced considerably and influenced the pharmaceutical and healthcare sectors by improving the mapping of interactions between a medication and its intended patient while decreasing the time and expenses related to the development processes. Moreover, due to the advantages linked to quantum computing and its growing demand, particularly in the biopharmaceutical sector for drug discovery and production, this area is anticipated to generate profitable business prospects for service providers.
Global Quantum Computing Market: Key Insights
The report delves into the current state of global quantum computing market and identifies potential growth opportunities within industry. Some key findings from the report include:
- Presently, over 45 players around the globe claim to offer quantum computing services across different steps of drug discovery.
- Leveraging their expertise, 86% stakeholders offer such services across target discovery / identification, primarily focusing on oncological disorders.
- In pursuit of gaining a competitive edge, manufacturers claim to be steadily expanding their existing capabilities in order to enhance their service portfolios related to quantum computing.
- Grants worth over USD 70 million have been awarded to various organizations that have actively undertaken R&D efforts to evaluate the potential of quantum computing in drug discovery.
- A considerable increase in the partnership activity has been witnessed in the past few years; close to 50% of the collaborations were inked by firms based in the same region.
- Majority of these deals are research and development agreements (35%), followed by platform utilization agreements (30%).
- More than 30 players, worldwide, claim to offer hardware-as-a-service for quantum computing in drug discovery, and have developed the required expertise in different types of computational approaches.
- Majority of the quantum computing hardware providers, headquartered in North America, were established before the year 2000; in fact, ~50% of the overall market landscape is catered by large companies.
- The rise in the adoption of quantum computing in the biopharmaceutical industry is anticipated to create profitable business opportunities for both software and hardware providers.
- Based on the pioneer-migrator-settler map, we have classified the software providers into different categories; a selection of pioneers is expected to provide valuable offerings to lead the market in the long term.
- We expect the market to grow at an annualized rate of 14.5% in the coming decade; the opportunity is likely to be well distributed across types of drug discovery services, therapeutic areas and key geographical regions.
Global Quantum Computing Market: Key Segments
Lead Optimization Segment Occupies the Largest Share of the Quantum Computing Market
In terms of drug discovery service offered, the market is segmented into target identification / validation, hit generation / lead identification and lead optimization. At present, majority (~62%) of the market share is captured by lead optimization segment. Additionally, this segment is likely to grow at a faster pace compared to the other segments.
CNS Disorders are the Fastest Growing Therapeutic Area Segment in the Quantum Computing Market
In terms of the therapeutic area, the market is segmented into cardiovascular disorders, CNS disorders, dermatological disorders, endocrine disorders, gastrointestinal disorders, immunological disorders, infectious diseases, musculoskeletal disorders, oncological disorders, respiratory disorders and others. Currently, oncological disorders segment captures the highest proportion of quantum computing market. Further, the CNS disorders segment is expected to grow at a relatively higher CAGR.
North America Accounts for the Largest Share of the Market
In terms of key geographical regions, the market is segmented into North America, Europe, Asia- Pacific, Middle East and North Africa, and Latin America. Currently, North America (48%) dominates the quantum computing market and accounts for the largest revenue share. However, the market in Asia Pacific is expected to grow at a higher CAGR.
Example Players in the Global Quantum Computing Market
- Accenture
- Amazon Web Services
- Atos
- Fujitsu
- Huawei
- IBM
- Microsoft
- Xanadu
- XtalPi
Global Quantum Computing Market: Research Coverage
- Market Sizing and Opportunity Analysis: The report features an in-depth analysis of the global quantum computing market, focusing on key market segments, including [A] type of drug discovery service offered, [B] therapeutic area and [C] key geographical regions.
- Software Providers Market Landscape: A comprehensive evaluation of quantum computing software companies, considering various parameters, such as [A] year of establishment, [B] company size, [C] location of headquarters, [D] business capabilities, [E] platform capabilities, [F] type of drug discovery service(s) offered, [G] type of molecule(s) supported, [H] compatible computational approaches, [I] end user(s) and [J] therapeutic area(s).
- Company Competitiveness Analysis: An insightful competitive analysis of quantum computing software companies, examining factors, such as [A] company strength, [B] portfolio strength and [C] portfolio diversity.
- Company Profiles: In-depth profiles of quantum computing software / hardware companies, focusing on [A] company overview, [B] financial information (if available), [C] service portfolio, and [E] recent developments and an informed future outlook.
- Software Providers Market Landscape: A comprehensive evaluation of quantum computing hardware companies, considering various parameters, such as [A] year of establishment, [B] company size, [C] location of headquarters, [D] type of offering(s), [E] data storage on cloud and [F] compatible computational approaches.
- Grant Analysis: An in-depth analysis of over 170 academic grants focused on quantum computing in drug discovery across various relevant parameters, such as [A] year of grants awarded, [B] amount awarded, [C] support period, [D] type of study section, [E] administering institute center, [F] type of grant, [G] activity code, [H] funding mechanism and amount granted, [I] funding institute and support period, [J] prominent program officers, [K] location of recipient organizations, [L] popular recipient organizations, [M] organization type and [N] amount granted to popular recipient.
- Partnerships and Collaborations: A comprehensive analysis of various collaborations and partnerships that have been inked amongst stakeholders in this domain, based on [A] year of partnership, [B] type of partnership and [C] regional activity.
- Use Case Study: A detailed analysis of quantum computing use cases highlighting the applications of quantum computing across various industries, such as [A] chemical industry, [B] cybersecurity, [C] financial modeling, [D] space sciences, [E] oil and gas industry and [F] weather forecasting.
- Porter's Five Forces Analysis: An insightful analysis of the five competitive forces prevalent in quantum computing market supporting drug discovery, including threats for new entrants, bargaining power of buyers, bargaining power of suppliers, threats of substitute product and rivalry among existing competitors.
- Blue Ocean Strategy: A Strategic Guide for Start-Ups to Enter into Highly Competitive Market: A detailed analysis of the current and future market based on blue ocean strategy, covering a strategic plan / guide for emerging players in this industry to help unlock an uncontested market.
Key Questions Answered in this Report
- How many companies are currently engaged in this market?
- Which are the leading companies in this market?
- What factors are likely to influence the evolution of this market?
- What is the current and future market size?
- What is the CAGR of this market?
- How is the current and future market opportunity likely to be distributed across key market segments?
Reasons to Buy this Report
- The report provides a comprehensive market analysis, offering detailed revenue projections of the overall market and its specific sub-segments. This information is valuable to both established market leaders and emerging entrants.
- Stakeholders can leverage the report to gain a deeper understanding of the competitive dynamics within the market. By analyzing the competitive landscape, businesses can make informed decisions to optimize their market positioning and develop effective go-to-market strategies.
- The report offers stakeholders a comprehensive overview of the market, including key drivers, barriers, opportunities, and challenges. This information empowers stakeholders to stay abreast of market trends and make data-driven decisions to capitalize on growth prospects.
Additional Benefits
- Complimentary Excel Data Packs for all Analytical Modules in the Report
- 15% Free Content Customization
- Detailed Report Walkthrough Session with Research Team
- Free Updated report if the report is 6-12 months old or older
TABLE OF CONTENTS
1. PREFACE
- 1.1. Scope of the Report
- 1.2. Research Methodology
- 1.2.1. Research Assumptions
- 1.2.2. Project Methodology
- 1.2.3. Forecast Methodology
- 1.2.4. Robust Quality Control
- 1.2.5. Key Considerations
- 1.2.5.1. Demographics
- 1.2.5.2. Economic Factors
- 1.2.5.3. Government Regulations
- 1.2.5.4. Supply Chain
- 1.2.5.5. COVID Impact / Related Factors
- 1.2.5.6. Market Access
- 1.2.5.7. Healthcare Policies
- 1.2.5.8. Industry Consolidation
- 1.3 Key Questions Answered
- 1.4. Chapter Outlines
2. EXECUTIVE SUMMARY
3. INTRODUCTION
- 3.1. Chapter Overview
- 3.2. Overview of Quantum Computing in Drug Discovery
- 3.3. Drug Discovery and Development Timeline
- 3.4. Historical Evolution of Computational Drug Discovery Approaches
- 3.5. Classification of Quantum Computing Approaches
- 3.6. Applications of Quantum Computing in Drug Discovery Process
- 3.7. Advantages of Quantum Computing in Drug Discovery
- 3.8. Challenges Associated with Quantum Computing in Drug Discovery
- 3.9. Future Perspectives
4. MARKET LANDSCAPE: SOFTWARE PROVIDERS
- 4.1. Quantum Computing Software Providers: Overall Market Landscape
- 4.1.1. Analysis by Year of Establishment
- 4.1.2. Analysis by Company Size
- 4.1.3. Analysis by Location of Headquarters
- 4.1.4. Analysis by Business Capabilities
- 4.1.5. Analysis by Platform Capabilities
- 4.1.6. Analysis by Type of Drug Discovery Service(s) Offered
- 4.1.7. Analysis by Type of Molecule(s) Supported
- 4.1.8. Analysis by Compatible Computational Approaches
- 4.1.9. Analysis by End User(s)
- 4.1.10. Analysis by Therapeutic Area(s)
5. COMPANY COMPETITIVENESS ANALYSIS
- 5.1. Methodology and Key Parameters
- 5.2. Scoring Criteria
- 5.3. Company Competitiveness Analysis: Players based in North America (Peer Group I)
- 5.4. Company Competitiveness Analysis: Players based in Europe (Peer Group II)
- 5.5. Company Competitiveness Analysis: Players based in Asia-Pacific and Rest of the World (Peer Group III)
6. COMPANY PROFILES: SOFTWARE PROVIDERS
- 6.1. Accenture
- 6.1.1. Company Overview
- 6.1.2. Financial Information
- 6.1.3. Service Portfolio
- 6.1.4. Recent Developments and Future Outlook
- 6.2. Atos
- 6.2.1. Company Overview
- 6.2.2. Financial Information
- 6.2.3. Service Portfolio
- 6.2.4. Recent Developments and Future Outlook
- 6.3. Fujitsu
- 6.3.1. Company Overview
- 6.3.2. Financial Information
- 6.3.3. Service Portfolio
- 6.3.4. Recent Developments and Future Outlook
- 6.4. Huawei
- 6.4.1. Company Overview
- 6.4.2. Financial Information
- 6.4.3. Service Portfolio
- 6.4.4. Recent Developments and Future Outlook
- 6.5. Microsoft
- 6.5.1. Company Overview
- 6.5.2. Financial Information
- 6.5.3. Service Portfolio
- 6.5.4. Recent Developments and Future Outlook
- 6.6. Xanadu
- 6.6.1. Company Overview
- 6.6.2. Service Portfolio
- 6.6.3. Recent Developments and Future Outlook
- 6.7. XtalPi
- 6.7.1. Company Overview
- 6.7.2. Service Portfolio
- 6.7.3. Recent Developments and Future Outlook
7. MARKET LANDSCAPE: HARDWARE PROVIDERS
- 7.1. Quantum Computing Hardware Providers: Overall Market Landscape
- 7.1.1. Analysis by Year of Establishment
- 7.1.2. Analysis by Company Size
- 7.1.3. Analysis by Region of Headquarters
- 7.1.4. Analysis by Location of Headquarters
- 7.1.5. Analysis by Type of Offering(s)
- 7.1.6. Analysis by Data Storage on Cloud
- 7.1.7. Analysis by Compatible Computational Approaches
- 7.1.8. Analysis by Type of Offering(s) and Compatible Computational Approaches
8. COMPANY PROFILES: HARDWARE PROVIDERS
- 8.1. Amazon Web Services
- 8.1.1. Company Overview
- 8.1.2. Financial Information
- 8.1.3. Service Portfolio
- 8.1.4. Recent Developments and Future Outlook
- 8.2. IBM
- 8.2.1. Company Overview
- 8.2.2. Financial Information
- 8.2.3. Service Portfolio
- 8.2.4. Recent Developments and Future Outlook
- 8.3. Microsoft
- 8.3.1. Company Overview
- 8.3.2. Financial Information
- 8.3.3. Service Portfolio
- 8.3.4. Recent Developments and Future Outlook
9. ACADEMIC GRANTS ANALYSIS
- 9.1. Analysis Methodology
- 9.2. Key Parameters
- 9.3. Analysis by Year of Grant
- 9.4. Analysis by Amount Awarded
- 9.5. Analysis by Support Period
- 9.6. Analysis by Study Section
- 9.7. Word Cloud Analysis: Emerging Focus Areas
- 9.8. Analysis by Administering Institute Center
- 9.9. Analysis by Type of Grant
- 9.10. Analysis by Activity Code
- 9.11. Analysis by Purpose of Grant
- 9.12. Analysis by Administering Institute Center and Support Period
- 9.13. Prominent Program Officers: Analysis by Number of Grants
- 9.14. Analysis by Location of Recipient Organizations
- 9.15. Analysis by Type of Organization
- 9.16. Popular Recipient Organizations: Analysis by Number of Grants
- 9.17. Popular Recipient Organizations: Analysis by Amount Awarded
10. PARTNERSHIPS AND COLLABORATIONS
- 10.1. Partnership Models
- 10.2. Quantum Computing in Drug Discovery, Drug Manufacturing and Other Services: Partnerships and Collaborations
- 10.3. Analysis by Year of Partnership
- 10.4. Analysis by Type of Partnership
- 10.5. Analysis by Year and Type of Partnership
- 10.6. Most Active Players: Analysis by Number of Partnerships
- 10.7. Word Cloud Analysis: Key Focus Areas
- 10.8. Analysis by Type of Continent
- 10.9. Analysis by Company Size and Type of Partnership
- 10.10. Local and Intercontinental Agreements
- 10.11. Intercontinental and Intracontinental Agreements
11. USE CASE STUDY
- 11.1. Overview of Quantum Computing
- 11.2. Applications of Quantum Computing Across Various Industries
- 11.3. Upcoming Trends in Quantum Computing
- 11.4. Future Perspectives
12. PORTER'S FIVE FORCES ANALYSIS
- 12.1. Methodology and Assumptions
- 12.2. Key Parameters
- 12.2.1. Threats of New Entrants
- 12.2.2. Bargaining Power of Buyers
- 12.2.3. Bargaining Power of Suppliers
- 12.2.4. Threats of Substitute Products
- 12.2.5. Rivalry among Existing Competitors
13. BLUE OCEAN STRATEGY: A STRATEGIC GUIDE FOR START-UPS TO ENTER INTO HIGHLY COMPETITIVE MARKET
- 13.1. Overview of Blue Ocean Strategy
- 13.1.1. Red Oceans
- 13.1.2. Blue Oceans
- 13.1.3. Comparison of Red Ocean Strategy and Blue Ocean Strategy
- 13.1.4. Quantum Computing in Drug Discovery Services Market: Blue Ocean Strategy and Shift Tools
- 13.1.4.1. Value Innovation
- 13.1.4.2. Strategy Canvas
- 13.1.4.3. Four Action Framework
- 13.1.4.4. Eliminate-Raise-Reduce-Create (ERRC) Grid
- 13.1.4.5. Six Path Framework
- 13.1.4.6. Pioneer-Migrator-Settler (PMS) Map
- 13.1.4.7. Three Tiers of Non-customers
- 13.1.4.8. Sequence of Blue Ocean Strategy
- 13.1.4.9. Buyer Utility Map
- 13.1.4.10. The Price Corridor of the Mass
- 13.1.4.11. Four Hurdles to Strategy Execution
- 13.1.4.12. Tipping Point Leadership
- 13.1.4.13. Fair Process
14. MARKET SIZING AND OPPORTUNITY ANALYSIS
- 14.1. Forecast Methodology and Key Assumptions
- 14.2. Quantum Computing in Drug Discovery Services Market, Till 2035
- 14.2.1. Quantum Computing in Drug Discovery Services Market, Till 2035: Analysis by Type of Drug Discovery Service Offered
- 14.2.1.1. Quantum Computing in Drug Discovery Services Market for Target Identification / Validation, Till 2035
- 14.2.1.2. Quantum Computing in Drug Discovery Services Market for Hit Generation / Lead Identification, Till 2035
- 14.2.1.3. Quantum Computing in Drug Discovery Services Market for Target Lead Optimization, Till 2035
- 14.2.2. Quantum Computing in Drug Discovery Services Market, Till 2035: Analysis by Therapeutic Area
- 14.2.2.1. Quantum Computing in Drug Discovery Services Market for Cardiovascular Disorders, Till 2035
- 14.2.2.2. Quantum Computing in Drug Discovery Services Market for CNS Disorders, Till 2035
- 14.2.2.3. Quantum Computing in Drug Discovery Services Market for Dermatological Disorders, Till 2035
- 14.2.2.4. Quantum Computing in Drug Discovery Services Market for Endocrine Disorders, Till 2035
- 14.2.2.5. Quantum Computing in Drug Discovery Services Market for Gastrointestinal Disorders, Till 2035
- 14.2.2.6. Quantum Computing in Drug Discovery Services Market for Immunological Disorders, Till 2035
- 14.2.2.7. Quantum Computing in Drug Discovery Services Market for Infectious Diseases, Till 2035
- 14.2.2.8. Quantum Computing in Drug Discovery Services Market for Musculoskeletal Disorders, Till 2035
- 14.2.2.9. Quantum Computing in Drug Discovery Services Market for Oncological Disorders, Till 2035
- 14.2.2.10. Quantum Computing in Drug Discovery Services Market for Respiratory Disorders, Till 2035
- 14.2.2.11. Quantum Computing in Drug Discovery Services Market for Others, Till 2035
- 14.2.3. Quantum Computing in Drug Discovery Services Market, Till 2035: Analysis by Key Geographical Regions
- 14.2.3.1. Quantum Computing in Drug Discovery Services Market in North America, Till 2035
- 14.2.3.1.1. Quantum Computing in Drug Discovery Services Market in the US, Till 2035
- 14.2.3.1.2. Quantum Computing in Drug Discovery Services Market in Canada, Till 2035
- 14.2.3.2. Quantum Computing in Drug Discovery Services Market for Europe, Till 2035
- 14.2.3.2.1. Quantum Computing in Drug Discovery Services Market in the UK, Till 2035
- 14.2.3.2.2. Quantum Computing in Drug Discovery Services Market in France, Till 2035
- 14.2.3.2.3. Quantum Computing in Drug Discovery Services Market in Germany, Till 2035
- 14.2.3.2.4. Quantum Computing in Drug Discovery Services Market in Rest of Europe, Till 2035
- 14.2.3.3. Quantum Computing in Drug Discovery Services Market in Asia-Pacific, Till 2035
- 14.2.3.3.1. Quantum Computing in Drug Discovery Services Market in China, Till 2035
- 14.2.3.3.2. Quantum Computing in Drug Discovery Services Market in Japan, Till 2035
- 14.2.3.3.3. Quantum Computing in Drug Discovery Services Market in Rest of Asia-Pacific, Till 2035
- 14.2.3.4. Quantum Computing in Drug Discovery Services Market in Latin America, Till 2035
- 14.2.3.5. Quantum Computing in Drug Discovery Services Market in Middle East and North Africa, Till 2035
- 14.2.3.1. Quantum Computing in Drug Discovery Services Market in North America, Till 2035
- 14.2.1. Quantum Computing in Drug Discovery Services Market, Till 2035: Analysis by Type of Drug Discovery Service Offered
15. EXECUTIVE INSIGHTS
16. APPENDIX 1: TABULATED DATA
17. APPENDIX 2: LIST OF COMPANIES AND ORGANIZATIONS
List of Tables
- Table 4.1 List of Quantum Computing Software Providers
- Table 6.1 Accenture: Service Portfolio
- Table 6.2 Accenture: Recent Developments and Future Outlook
- Table 6.3 Atos: Service Portfolio
- Table 6.4 Atos: Recent Developments and Future Outlook
- Table 6.5 Fujitsu: Service Portfolio
- Table 6.6 Fujitsu: Recent Developments and Future Outlook
- Table 6.7 Huawei: Service Portfolio
- Table 6.8 Huawei: Recent Developments and Future Outlook
- Table 6.9 Microsoft: Service Portfolio
- Table 6.10 Microsoft: Recent Developments and Future Outlook
- Table 6.11 Xanadu: Service Portfolio
- Table 6.12 Xanadu: Recent Developments and Future Outlook
- Table 6.13 XtalPi: Service Portfolio
- Table 6.14 XtalPi: Recent Developments and Future Outlook
- Table 7.1 List of Quantum Computing Hardware Providers
- Table 8.1 Amazon Web Services: Recent Developments and Future Outlook
- Table 8.2 IBM: Recent Developments and Future Outlook
- Table 8.3 Microsoft: Recent Developments and Future Outlook
- Table 10.1 Quantum Computing in Drug Discovery Services: List of Partnerships and Collaborations
- Table 16.1 Quantum Computing Software Providers: Distribution by Year of Establishment
- Table 16.2 Quantum Computing Software Providers: Distribution by Company Size
- Table 16.3 Quantum Computing Software Providers: Distribution by Location of Headquarters
- Table 16.4 Quantum Computing Software Providers: Distribution by Business Capabilities
- Table 16.5 Quantum Computing Software Providers: Distribution by Platform Capabilities
- Table 16.6 Quantum Computing Software Providers: Distribution by Type of Drug Discovery Service(s) Offered
- Table 16.7 Quantum Computing Software Providers: Distribution by Type of Molecule(s) Supported
- Table 16.8 Quantum Computing Software Providers: Distribution by Type Compatible Computational Approaches
- Table 16.9 Quantum Computing Software Providers: Distribution by End user(s)
- Table 16.10 Quantum Computing Software Providers: Distribution by Therapeutic Area(s)
- Table 16.11 Accenture: Revenues in USD Billion (Since FY 2017)
- Table 16.12 Atos: Revenues in EUR Billion (Since FY 2017)
- Table 16.13 Fujitsu: Revenues in Yen Billion (Since FY 2017)
- Table 16.14 Huawei: Revenues in CNY Billion (Since FY 2017)
- Table 16.15 Microsoft: Revenues in USD Billion (Since FY 2017)
- Table 16.16 Quantum Computing Hardware Providers: Distribution by Year of Establishment
- Table 16.17 Quantum Computing Hardware Providers: Distribution by Company Size
- Table 16.18 Quantum Computing Hardware Providers: Distribution by Region of Headquarters
- Table 16.19 Quantum Computing Hardware Providers: Distribution by Location of Headquarters
- Table 16.20 Quantum Computing Hardware Providers: Distribution by Type of Offering(s)
- Table 16.21 Quantum Computing Hardware Providers: Distribution by Data Storage on Cloud
- Table 16.22 Quantum Computing Hardware Providers: Distribution by Compatible Computational Approaches
- Table 16.23 Quantum Computing Hardware Providers: Distribution by Type of offering(s) and Compatible Computational Approaches
- Table 16.24 Amazon Web Services: Revenues in USD Billion (Since FY 2017)
- Table 16.25 IBM: Revenues in USD Billion (Since FY 2017)
- Table 16.26 Microsoft: Revenues in USD Billion (Since FY 2017)
- Table 16.27 Academic Grants Analysis: Distribution by Year of Grant
- Table 16.28 Academic Grants Analysis: Distribution by Amount Awarded
- Table 16.29 Academic Grants Analysis: Distribution by Support Period
- Table 16.30 Academic Grants Analysis: Distribution by Study Section
- Table 16.31 Academic Grants Analysis: Distribution by Administrating Institute Center
- Table 16.32 Academic Grants Analysis: Distribution by Type of Grant
- Table 16.33 Academic Grants Analysis: Distribution by Activity Code
- Table 16.34 Academic Grants Analysis: Distribution by Purpose of Grant
- Table 16.35 Academic Grants Analysis: Distribution by Administering Institute Center and Support Period
- Table 16.36 Prominent Program Officers: Distribution by Number of Grants
- Table 16.37 Academic Grants Analysis: Distribution by Location of Organizations
- Table 16.38 Academic Grants Analysis: Distribution by Type of Organization
- Table 16.39 Popular Recipient Organizations: Analysis by Number of Grants
- Table 16.40 Popular Recipient Organizations: Analysis by Amount Awarded
- Table 16.41 Partnerships and Collaborations: Distribution by Year
- Table 16.42 Partnerships and Collaborations: Distribution by Type of Partnership
- Table 16.43 Partnerships and Collaborations: Distribution by Year and Type of Partnership
- Table 16.44 Most Active Players: Distribution by Number of Partnerships
- Table 16.45 Partnerships and Collaborations: Distribution by Type of Continent
- Table 16.46 Partnerships and Collaborations: Distribution by Company Size and Type of Partnership
- Table 16.47 Partnerships and Collaborations: Local and International Agreements
- Table 16.48 Partnerships and Collaborations: Intercontinental and Intracontinental Agreements
- Table 16.49 Quantum Computing in Drug Discovery Services Market, Till 2035: Scenario I, Scenario II and Scenario III (USD Million)
- Table 16.50 Quantum Computing in Drug Discovery Services Market: Distribution by Type of Drug Discovery Service Offered
- Table 16.51 Quantum Computing in Drug Discovery Services Market for Target Identification / Validation, Till 2035: Scenario I, Scenario II and Scenario III (USD Million)
- Table 16.52 Quantum Computing in Drug Discovery Services Market for Hit Generation / Lead Identification, Till 2035: Scenario I, Scenario II and Scenario III (USD Million)
- Table 16.53 Quantum Computing in Drug Discovery Services Market for Target Lead Optimization, Till 2035: Scenario I, Scenario II and Scenario III (USD Million)
- Table 16.54 Quantum Computing in Drug Discovery Services Market: Distribution by Therapeutic Area
- Table 16.55 Quantum Computing in Drug Discovery Services Market for Cardiovascular Disorders, Till 2035: Scenario I, Scenario II and Scenario III (USD Million)
- Table 16.56 Quantum Computing in Drug Discovery Services Market for CNS Disorders, Till 2035: Scenario I, Scenario II and Scenario III (USD Million)
- Table 16.57 Quantum Computing in Drug Discovery Services Market for Dermatological Disorders, Till 2035: Scenario I, Scenario II and Scenario III (USD Million)
- Table 16.58 Quantum Computing in Drug Discovery Services Market for Endocrine Disorders, Till 2035: Scenario I, Scenario II and Scenario III (USD Million)
- Table 16.59 Quantum Computing in Drug Discovery Services Market for Gastrointestinal Disorders, Till 2035: Scenario I, Scenario II and Scenario III (USD Million)
- Table 16.60 Quantum Computing in Drug Discovery Services Market for Immunological Disorders, Till 2035: Scenario I, Scenario II and Scenario III (USD Million)
- Table 16.61 Quantum Computing in Drug Discovery Services Market for Infectious Diseases, Till 2035: Scenario I, Scenario II and Scenario III (USD Million)
- Table 16.62 Quantum Computing in Drug Discovery Services Market for Musculoskeletal Disorders, Till 2035: Scenario I, Scenario II and Scenario III (USD Million)
- Table 16.63 Quantum Computing in Drug Discovery Services Market for Oncological Disorders, Till 2035: Scenario I, Scenario II and Scenario III (USD Million)
- Table 16.64 Quantum Computing in Drug Discovery Services Market for Respiratory Disorders, Till 2035: Scenario I, Scenario II and Scenario III (USD Million)
- Table 16.65 Quantum Computing in Drug Discovery Services Market for Others, Till 2035: Scenario I, Scenario II and Scenario III (USD Million)
- Table 16.66 Quantum Computing in Drug Discovery Services Market: Distribution by Key Geographical Regions
- Table 16.67 Quantum Computing in Drug Discovery Services Market in North America, Till 2035: Scenario I, Scenario II and Scenario III (USD Million)
- Table 16.68 Quantum Computing in Drug Discovery Services Market in the US, Till 2035: Scenario I, Scenario II and Scenario III (USD Million)
- Table 16.69 Quantum Computing in Drug Discovery Services Market in Canada, Till 2035: Scenario I, Scenario II and Scenario III (USD Million)
- Table 16.70 Quantum Computing in Drug Discovery Services Market for Europe, Till 2035: Scenario I, Scenario II and Scenario III (USD Million)
- Table 16.71 Quantum Computing in Drug Discovery Services Market in the UK, Till 2035: Scenario I, Scenario II and Scenario III (USD Million)
- Table 16.72 Quantum Computing in Drug Discovery Services Market in France, Till 2035: Scenario I, Scenario II and Scenario III (USD Million)
- Table 16.73 Quantum Computing in Drug Discovery Services Market in Germany, Till 2035: Scenario I, Scenario II and Scenario III (USD Million)
- Table 16.74 Quantum Computing in Drug Discovery Services Market in Rest of Europe, Till 2035: Scenario I, Scenario II and Scenario III (USD Million)
- Table 16.75 Quantum Computing in Drug Discovery Services Market in Asia-Pacific, Till 2035: Scenario I, Scenario II and Scenario III (USD Million)
- Table 16.76 Quantum Computing in Drug Discovery Services Market in China, Till 2035: Scenario I, Scenario II and Scenario III (USD Million)
- Table 16.77 Quantum Computing in Drug Discovery Services Market in Japan, Till 2035: Scenario I, Scenario II and Scenario III (USD Million)
- Table 16.78 Quantum Computing in Drug Discovery Services Market in Rest of Asia-Pacific, Till 2035: Scenario I, Scenario II and Scenario III (USD Million)
- Table 16.79 Quantum Computing in Drug Discovery Services Market in Latin America, Till 2035: Scenario I, Scenario II and Scenario III (USD Million)
- Table 16.80 Quantum Computing in Drug Discovery Services Market in Middle East and North Africa, Till 2035: Scenario I, Scenario II and Scenario III (USD Million)
List of Figures
- Figure 4.1 Quantum Computing Software Providers: Distribution by Year of Establishment
- Figure 4.2 Quantum Computing Software Providers: Distribution by Company Size
- Figure 4.3 Quantum Computing Software Providers: Distribution by Location of Headquarters
- Figure 4.4 Quantum Computing Software Providers: Distribution by Business Capabilities
- Figure 4.5 Quantum Computing Software Providers: Distribution by Platform Capabilities
- Figure 4.6 Quantum Computing Software Providers: Distribution by Type of Drug Discovery Service(s) Offered
- Figure 4.7 Quantum Computing Software Providers: Distribution by Type of Molecule(s) Supported
- Figure 4.8 Quantum Computing Software Providers: Distribution by Compatible Computational Approaches
- Figure 4.9 Quantum Computing Software Providers: Distribution by End user(s)
- Figure 4.10 Quantum Computing Software Providers: Distribution by Therapeutic Area(s)
- Figure 5.1 Company Competitiveness Analysis: Players based in North America (Peer Group I)
- Figure 5.2 Company Competitiveness Analysis: Players based in Europe (Peer Group II)
- Figure 5.3 Company Competitiveness Analysis: Players based in Asia-Pacific and Rest of the World (Peer Group III)
- Figure 6.1 Accenture: Revenues in USD Billion (Since FY 2017)
- Figure 6.2 Atos: Revenues in EUR Billion (Since FY 2017)
- Figure 6.3 Fujitsu: Revenues in Yen Billion (Since FY 2017)
- Figure 6.4 Huawei: Revenues in CNY Billion (Since FY 2017)
- Figure 6.5 Microsoft: Revenues in USD Billion (Since FY 2017)
- Figure 7.1 Quantum Computing Hardware Providers: Distribution by Year of Establishment
- Figure 7.2 Quantum Computing Hardware Providers: Distribution by Company Size
- Figure 7.3 Quantum Computing Hardware Providers: Distribution by Region of Headquarters
- Figure 7.4 Quantum Computing Hardware Providers: Distribution by Location of Headquarters
- Figure 7.5 Quantum Computing Hardware Providers: Distribution by Type of Offering(s)
- Figure 7.6 Quantum Computing Hardware Providers: Distribution by Data Storage on Cloud
- Figure 7.6 Quantum Computing Hardware Providers: Distribution by Compatible Computational Approaches
- Figure 7.7 Quantum Computing Hardware Providers: Distribution by Type of Offering(s) and Compatible Computational Approaches
- Figure 8.1 Amazon Web Services: Revenues in USD Billion (Since FY 2017)
- Figure 8.2 Amazon Web Services: Service Portfolio
- Figure 8.3 IBM: Revenues in USD Billion (Since FY 2017)
- Figure 8.4 IBM: Service Portfolio
- Figure 8.5 Microsoft: Revenues in USD Billion (Since FY 2017)
- Figure 8.6 Microsoft: Service Portfolio
- Figure 9.1 Academic Grants Analysis: Distribution by Year of Grant
- Figure 9.2 Academic Grants Analysis: Distribution by Amount Awarded
- Figure 9.3 Academic Grants Analysis: Distribution by Support Period
- Figure 9.4 Academic Grants Analysis: Distribution by Study Section
- Figure 9.5 Word Cloud Analysis: Emerging Focus Areas
- Figure 9.6 Academic Grants Analysis: Distribution by Administrating Institute Center
- Figure 9.7 Academic Grants Analysis: Distribution by Type of Grant
- Figure 9.8 Academic Grants Analysis: Distribution by Activity Code
- Figure 9.9 Academic Grants Analysis: Distribution by Purpose of Grant
- Figure 9.10 Academic Grants Analysis: Distribution by Funding Institute Center and Support Period
- Figure 9.11 Prominent Program Officers: Distribution by Number of Grants
- Figure 9.12 Academic Grants Analysis: Distribution by Location of Recipient Organizations
- Figure 9.13 Academic Grants Analysis: Distribution by Type of Organization
- Figure 9.14 Popular Recipient Organizations: Analysis by Number of Grants
- Figure 9.15 Popular Recipient Organizations: Analysis by Amount Awarded
- Figure 10.1 Partnerships and Collaborations: Cumulative Year-wise Trend
- Figure 10.2 Partnerships and Collaborations: Distribution by Type of Partnership
- Figure 10.3 Partnerships and Collaborations: Distribution by Year and Type of Partnership
- Figure 10.4 Most Active Players: Distribution by Number of Partnerships
- Figure 10.5 Word Cloud Analysis: Emerging Focus Areas
- Figure 10.6 Partnerships and Collaborations: Distribution by Type of Continent
- Figure 10.7 Partnerships and Collaborations: Distribution by Company Size and Type of Partnership
- Figure 10.8 Partnerships and Collaborations: Local and International Agreements
- Figure 10.9 Partnerships and Collaborations: Intercontinental and Intracontinental Agreements
- Figure 10.10 Partnerships and Collaborations: Key Value Drivers
- Figure 12.1 Porter's Five Forces: Key Parameters
- Figure 12.2 Porter's Five Forces: Harvey Ball Analysis
- Figure 13.1 Blue Ocean Strategy: Strategy Canvas
- Figure 13.2 Blue Ocean Strategy: Pioneer-Migrator-Settler (PMS) Map
- Figure 14.1 Quantum Computing in Drug Discovery Services Market, Till 2035 (USD Million)
- Figure 14.2 Quantum Computing in Drug Discovery Services Market: Distribution by Type of Drug Discovery Service Offered
- Figure 14.3 Quantum Computing in Drug Discovery Services Market for Target Identification / Validation, Till 2035 (USD Million)
- Figure 14.4 Quantum Computing in Drug Discovery Services Market for Hit Generation / Lead Identification, Till 2035 (USD Million)
- Figure 14.5 Quantum Computing in Drug Discovery Services Market for Target Lead Optimization, Till 2035 (USD Million)
- Figure 14.6 Quantum Computing in Drug Discovery Services Market: Distribution by Therapeutic Area
- Figure 14.7 Quantum Computing in Drug Discovery Services Market for Cardiovascular Disorders, Till 2035 (USD Million)
- Figure 14.8 Quantum Computing in Drug Discovery Services Market for CNS Disorders, Till 2035 (USD Million)
- Figure 14.9 Quantum Computing in Drug Discovery Services Market for Dermatological Disorders, Till 2035 (USD Million)
- Figure 14.10 Quantum Computing in Drug Discovery Services Market for Endocrine Disorders, Till 2035 (USD Million)
- Figure 14.11 Quantum Computing in Drug Discovery Services Market for Gastrointestinal Disorders, Till 2035 (USD Million)
- Figure 14.12 Quantum Computing in Drug Discovery Services Market for Immunological Disorders, Till 2035 (USD Million)
- Figure 14.13 Quantum Computing in Drug Discovery Services Market for Infectious Diseases, Till 2035 (USD Million)
- Figure 14.14 Quantum Computing in Drug Discovery Services Market for Musculoskeletal Disorders, Till 2035 (USD Million)
- Figure 14.15 Quantum Computing in Drug Discovery Services Market for Oncological Disorders, Till 2035 (USD Million)
- Figure 14.16 Quantum Computing in Drug Discovery Services Market for Respiratory Disorders, Till 2035 (USD Million)
- Figure 14.17 Quantum Computing in Drug Discovery Services Market for Others, Till 2035 (USD Million)
- Figure 14.18 Quantum Computing in Drug Discovery Services Market: Distribution by Key Geographical Regions
- Figure 14.19 Quantum Computing in Drug Discovery Services Market in North America, Till 2035 (USD Million)
- Figure 14.20 Quantum Computing in Drug Discovery Services Market in the US, Till 2035 (USD Million)
- Figure 14.21 Quantum Computing in Drug Discovery Services Market in Canada, Till 2035 (USD Million)
- Figure 14.22 Quantum Computing in Drug Discovery Services Market for Europe, Till 2035 (USD Million)
- Figure 14.23 Quantum Computing in Drug Discovery Services Market in the UK, Till 2035 (USD Million)
- Figure 14.24 Quantum Computing in Drug Discovery Services Market in France, Till 2035 (USD Million)
- Figure 14.25 Quantum Computing in Drug Discovery Services Market in Germany, Till 2035 (USD Million)
- Figure 14.26 Quantum Computing in Drug Discovery Services Market in Rest of Europe, Till 2035 (USD Million)
- Figure 14.27 Quantum Computing in Drug Discovery Services Market in Asia-Pacific, Till 2035 (USD Million)
- Figure 14.28 Quantum Computing in Drug Discovery Services Market in China, Till 2035 (USD Million)
- Figure 14.29 Quantum Computing in Drug Discovery Services Market in Japan, Till 2035 (USD Million)
- Figure 14.30 Quantum Computing in Drug Discovery Services Market in Rest of Asia-Pacific, Till 2035 (USD Million)
- Figure 14.31 Quantum Computing in Drug Discovery Services Market in Latin America, Till 2035 (USD Million)
- Figure 14.32 Quantum Computing in Drug Discovery Services Market in Middle East and North Africa, Till 2035 (USD Million)
 全球中性原子量子計算市場(2026-2036)
 量子運算市場規模、佔有率和成長分析(按產品、部署類型、技術、應用、最終用戶產業和地區分類)—產業預測(2026-2033 年)
 企業量子運算市場規模、佔有率和成長分析(按產品類型、部署類型、技術、應用、最終用戶產業和地區分類)-2026-2033年產業預測
 拓樸絕緣體材料市場機會、成長促進因素、產業趨勢分析及預測(2025-2034年)
 量子運算人工智慧最佳化市場規模、佔有率和趨勢分析報告:按組件、技術、應用、最終用途、地區和細分市場預測(2025-2033 年)
 2025年全球商業量子計算解決方案市場報告拓樸絕緣體市場規模、佔有率和趨勢分析報告:按類型、應用、地區和細分市場預測(2025-2033 年)
 企業量子運算市場:按組件、部署模式、技術、組織規模、應用領域和最終用戶產業分類-2025-2032年全球預測汽車量子運算市場:按組件、技術類型、部署類型、應用和最終用戶分類-全球預測,2025-2032年醫療保健領域量子運算市場:按組件、技術、應用和最終用戶分類-2025年至2032年全球預測