


 |
市場調查報告書
商品編碼
1849799
皮下生技藥品市場(第5版):2035年前的產業趨勢和全球預測 - 各生技藥品類型,基本原理,各治療領域,各藥物輸送設備,各地區,醫藥品預測銷售額Subcutaneous Biologics Market (5th Edition), Industry Trends and Global Forecasts, till 2035 - Distribution by Type of Biologic, Fundamental Principle, Therapeutic Area, Drug Delivery Device, Geographical Regions and Sales Forecast of Drugs |
||||||
皮下生技藥品市場:概要
全球皮下生物製劑市場預計將從目前的 2,510 億美元成長到 2035 年的 2,330 億美元。
市場區隔與機會分析依下列參數劃分:
生物製劑類型
- 抗體
- 核?酸
- 蛋白質
治療類型
- 單劑療法
- 聯合治療
- 雙方(單劑療法和聯合治療)
投藥法
- 注射
- 輸液
- 雙方(注射和點滴)
基本原理
- 包封
- 絡合
- 偶聯
- 胺基酸交互作用
- 其他
終端用戶
- 製藥公司及生物製藥公司
- 生物科技企業
- 醫療科技公司
- 開發·受託製造廠商
- 教育機關
- 醫療設備廠商
- 其他
付款方法
- 階段性付款
- 契約退職金
治療領域
- 自體免疫疾病
- 骨疾病
- 血液疾病
- 感染疾病
- 發炎性疾病
- 代謝疾病
- 神經疾病
- 眼科疾病
- 腫瘤學的疾病
- 其他
藥物輸送類型
- 大容量穿戴式註射器
- 自動注射器
- 無針注射系統
- 新型藥物復溶系統
- 預充式註射器
地區
- 北美
- 歐洲
- 亞太地區
- 中東·北非
- 南美
皮下生物製劑市場成長與趨勢
生物製劑的需求持續成長。近年來,生物製劑在製藥業取得了顯著進展。事實上,美國FDA核准的生物製劑數量增加。這項變化歸功於生物製劑能夠最大限度地減少藥物交互作用,並透過其精準的結合和獨特的代謝途徑提供標靶治療。
然而,生物製劑的研發面臨諸多挑戰。這些挑戰包括高分子量、複雜的結構、給藥後易降解以及複雜的生產工藝,迫使製藥公司採用新技術進行研發。利用偶聯、胺基酸修飾和包封技術製備皮下生物製劑就是這些技術創新的一個例子。
此外,為了給藥高黏度製劑,人們正在開發新的給藥系統,例如自動注射器、預充式註射器和無針給藥方法。此前,由於生物製劑全身分佈迅速且生物利用度高,通常以靜脈注射給藥。雖然靜脈注射有效,但通常需要醫護人員定期給藥,這對病患的用藥依從性帶來了障礙。此外,皮下生物製劑的普及得益於患者對自我給藥治療的需求不斷增長,以及自動注射器和預充式註射器等易於使用的給藥工具的普及。
皮下生物製劑市場關鍵洞察
本報告深入分析了皮下生物製劑市場的現狀,並指出了該行業的潛在成長機會。主要發現包括:
- 目前,已有超過175種皮下生物製劑獲準用於治療各種慢性疾病,其中約50%的生物製劑獲批作為每日一次的蛋白質療法。
- 自2020年以來,約有20%的皮下生物製劑獲得批准,其中大部分是可作為單藥療法給藥的抗體。 目前有超過340種皮下生物製劑處於臨床開發階段,其中10%是獲得孤兒藥資格認定的抗體。
- 約60%的臨床階段皮下生物製劑是基於抑制機制。值得注意的是,這些生物製劑中的大多數都能夠用於單藥治療。
- 近20%的技術是基於封裝原理。具體而言,這些技術都致力於延長、控製或維持藥物釋放。
- 人們對這一領域日益增長的興趣也反映在合作活動的增加上;事實上,近70%的交易都是在過去三年內達成的。
- 多種新型創新藥物遞送系統有助於皮下給藥,目前已有超過560種系統上市或正在研發中。
- 由於人們越來越關注患者依從性和治療效果的改善,預計到 2027 年,已獲批准的皮下生物製劑市場將以約 5% 的複合年增長率增長。
- 由於皮下注射技術具有諸多優勢,且授權協議數量不斷增加,預計未來十年該市場將以 22.7% 的複合年增長率增長。
皮下生物製劑市場的主要細分市場
已核准的皮下生物製劑市場
抗體佔最大市佔率
依生物製劑類型劃分,全球已核准的皮下生物製劑市場可分為抗體、核苷酸和蛋白質。由於抗體具有高標靶特異性、安全性和低毒性,目前佔最大的市場佔有率。此外,預計在預測期內,已獲批准的皮下生物製劑(核苷酸)市場將顯著成長。
單藥療法和聯合療法均佔了相當大的市場佔有率。
全球已獲批准的皮下生物製劑市場可細分為單藥療法、聯合療法以及單藥聯合療法。
單藥療法和聯合療法目前均佔最大的市場佔有率,預計在預測期內將顯著增長。
注射劑佔已核准的皮下生物製劑市場佔有率的大部分。
本節闡述了全球已核准的皮下生物製劑市場按各種給藥途徑(包括注射、輸注以及注射和輸注聯合給藥)的分佈。值得注意的是,注射目前佔已批准的皮下生物製劑市場佔有率的大部分,預計在預測期內仍將保持主導地位。這是因為注射給藥對病人和醫護人員來說都比較方便。它也能降低過敏反應和體液超負荷的發生率。
自體免疫疾病佔皮下生物製劑市場最大佔有率
全球已獲批准的皮下生物製劑市場按治療領域細分為自體免疫疾病、代謝性疾病、腫瘤、血液疾病、發炎性疾病、神經系統疾病、骨骼疾病和其他疾病。目前,自體免疫疾病佔皮下生物製劑市場最大佔有率。這主要是由於這些藥物在治療各種常見自體免疫疾病(例如乾癬、僵直性脊椎炎、潰瘍性結腸炎和克隆氏症)方面具有高效性。然而,由於糖尿病和肥胖患者(需要長期用藥)越來越傾向於皮下注射,預計代謝性疾病領域在預測期內將佔更大的市場佔有率。
預計北美將佔整體市場的大部分佔有率。
本部分分析了已核准的皮下生物製劑市場在各地區的分佈情況,包括北美、歐洲、亞太地區、中東和北非以及拉丁美洲。根據我們的預測,北美目前佔整體市場的大部分佔有率(約 50%)。此外,值得注意的是,預計亞太市場在預測期內(至 2035 年)將以相對較高的複合年增長率成長。亞太市場的成長主要受患者人數快速成長、慢性疾病(例如神經系統疾病、遺傳性疾病和自體免疫疾病)盛行率上升以及對有效、先進療法的需求不斷增長的驅動。此外,亞洲各國監管機構加大投資並採取更多舉措,以促進患者和醫生對生物製劑的接受度,這有望在未來推動市場成長。
皮下生物製劑製劑技術市場
依基本原理劃分的市佔率
全球皮下生物製劑製劑技術市場按多種基本原理進行細分,例如胺基酸交互作用、絡合、偶聯、包封等。目前,透過包封技術授權產生的收入佔了整個市場的大部分佔有率,預計在預測期內將保持其主導地位。值得注意的是,包封有助於提高疏水性生物製劑的溶解度,進而增加藥物在患者體內的吸收。此外,藥物包封還能提高標靶特異性,進而降低副作用(通常由全身性暴露引起)的可能性。
生技公司預計將以相對較高的複合年增長率成長
全球皮下生物製劑技術市場服務於眾多終端用戶,包括生物技術公司、合約研發生產機構、學術機構、醫療器材製造商、醫療技術公司、製藥和生物製藥公司以及其他終端用戶。雖然製藥和生物製藥公司目前佔最大的市場佔有率,但預計在市場估算和預測期內,生物技術公司將以相對較高的複合年增長率成長。
腫瘤疾病佔皮下生物製劑技術市場最大佔有率
本部分闡述了全球皮下生物製劑技術市場在各個治療領域的分佈情況,包括自體免疫疾病、骨骼疾病、血液疾病、傳染病、發炎性疾病、代謝性疾病、神經系統疾病、眼科疾病、腫瘤疾病和其他疾病。值得注意的是,腫瘤領域目前佔技術市場最大的佔有率。這主要是由於腫瘤疾病的高發生率,2022年約有190萬例,2023年超過200萬例。此外,預計在預測期內,用於治療自體免疫疾病的皮下生物製劑全球市場將以最高的複合年增長率成長。
亞太地區的皮下生物製劑技術市場預計將以最高的複合年增長率成長。
本節闡述了皮下生物製劑技術市場在各個地區的分佈情況,包括北美、歐洲和亞太地區。目前,北美在全球皮下生物製劑技術市場中佔主導地位。
值得注意的是,亞太地區的皮下生物製劑技術市場佔了近 65% 的市場。此外,預計亞太地區的皮下生物製劑技術市場在預測期內將以最高的複合年增長率成長。亞太地區市場成長的驅動力在於該地區越來越多的技術先驅積極與藥物研發公司簽訂授權協議。
里程碑付款佔主要佔有率
全球皮下生物製劑技術市場分為里程碑付款和預付款兩種付款方式。目前,里程碑付款佔了市場的大部分佔有率,而且這一趨勢在未來不太可能改變。
皮下生物製劑市場參與者
- Adocia
- Alteogen
- Ascendis Pharma
- CD Bioparticles
- Creative Biolabs
- Creative BioMart
- Foresee Pharmaceuticals
- Pacira Biosciences
- The Wyss Institute
- Xeris Biopharma
初步研究概要
本市場報告中提出的觀點和見解受到與產業利害關係人討論的影響。
本報告包含以下產業利害關係人的詳細訪談記錄:- 美國,小型企業,創辦人兼執行長
- 英國,中型市場公司,創辦人兼首席技術官
- 美國,小型企業,執行長兼創辦人
- 丹麥,小型企業,首席執行官
- 美國,中型市場公司,首席執行官
- 印度,大型企業公司,首席技術官
- 以色列,大型企業公司,副總裁兼首席科學家
- 美國,大型企業公司,資深投資組合總監
- 奧地利,小型企業,總經理
- 法國,中型市場公司,傳播負責人
- 美國,中型市場公司,前創辦人兼首席科學家,副總裁兼產品開發負責人,前製劑資深科學家
- 德國,大型公司,前首席商務官
- 美國公司,匿名
- 歐洲公司,匿名
皮下生技藥品市場調查對象
- 市場規模和機會分析:本報告對全球皮下生物製劑市場進行了全面分析,涵蓋以下關鍵細分市場:[A] 初級包裝類型,[B] 生物製劑類型,[C] 治療類型,[D] 給藥途徑,[E] 基本原理,[F] 最終用戶,[G] 支付方式,[H] 治療領域,[I] 裝置類型,[I] 地區。
- 市場概況:本報告基於以下相關參數對皮下生物製劑市場中的公司進行了詳細評估:A] 成立年份,B] 公司規模,C] 總部所在地,D] 市場發展狀況,E] 生物製品類型,F] 治療類型,G] 作用機制,H] 給藥頻率,I] 目標疾病適應症,J] 治療領域,G] 藥物名稱。
- 技術概覽:基於多項相關參數,例如 A] 成立年份,B] 公司規模,C] 總部所在地,D] 核心理念,E] 分子類型,F] 給藥途徑,G] 治療領域,以及 H] 主要特性,對皮下生物製劑市場中皮下製劑技術的現狀進行詳細評估。
- 技術競爭分析:基於 A] 公司實力,B] 技術實力等參數,對皮下製劑技術進行全面分析。
- 公司簡介:詳細介紹北美、歐洲和亞太地區主要皮下生物製劑技術開發公司,重點關注以下參數:A) 公司概況,[B] 財務資訊(如有),[C] 服務組合,[D] 生產設施,以及 [E] 近期發展和未來展望。
- 合作夥伴關係與合作:基於以下參數,對本領域報告的合作夥伴關係活動進行詳細分析:A) 合作年份,[B] 合作類型,以及 [C] 合作公司類型。
- SWOT 分析:透過 SWOT 分析,深入洞察預計將影響皮下生物製劑市場整體發展的產業相關趨勢、機會和挑戰。
目錄
第1章 序文
第2章 調查手法
第3章 市場動態
- 章概要
- 預測調查手法
- 市場評估組成架構
- 預測工具和技巧
- 重要的考慮事項
- 主要的市場區隔
- 堅牢的品管
- 限制事項
第4章 經濟以及其他的計劃特有的考慮事項
- 章概要
- 市場動態
第5章 摘要整理
第6章 簡介
- 章概要
- 治療分子的種類
- 生物來源分子
- 產品類型
- 與給藥途徑製劑
- 皮下製劑
- 法規上的考慮事項
- 醫療設備
- 醫藥品·醫療設備複合產品
- 未來展望
第7章 已通過核准皮下生技藥品:市場形勢
- 章概要
第7章 2.已通過核准皮下生技藥品:市場概要
- 核准各年度分析
- 生物製藥的各類型分析
- 治療類型分別分析
- 各給藥途徑分析
- 各投藥法分析
- 按給藥頻率分析
- 按輻射劑量濃度分析
- 對象疾病各適應症分析
- 各治療領域分析
- 藥物輸送設備類型類分別分析
- 已通過核准皮下生技藥品:開發商清單
第8章 已通過核准皮下生技藥品:成功通訊協定分析
- 章概要
- 調查手法
- 已通過核准主要皮下生技藥品的成功通訊協定分析
- Benlysta®(Human Genome Sciences)
- BESREMi®(Pharma Essencia)
- Cosentyx® (諾華)
- Darzalex Faspro®/Darzalex® SC(Halozyme)
- Dupixent®(Regeneron Pharmaceuticals)
- Enbrel®(安進)
- Hemlibra®(羅氏)
- Prolia®/Pralia®(安進)
- Stelara®(強生生物技術)
- Trulicity®(禮來)
- 結論
第9章 臨床階段的皮下生技藥品:市場形勢
- 章概要
第9章 2.臨床階段的皮下注射治療生物製藥:市場概要
- 各開發階段分析
- 生物製藥的各類型分析
- 治療方法分別分析
- 各作用機制分析
- 按給藥頻率分析
- 按醫藥品指定分析
- 對象疾病各適應症分析
- 各治療領域分析
- 臨床階段的皮下注射治療生物製藥:開發企業一覽
第10章 皮下製劑:科技形勢
- 章概要
- 皮下製劑:技術形勢
- 按基本原理分析
- 各分子類型分析
- 各給藥途徑分析
- 各治療領域分析
- 按主要特性分析
- 皮下製劑:技術開發商的形勢
第11章 技術競爭力分析
- 章概要
- 前提主要的參數
- 調查手法
- 技術競爭力分析:皮下製劑技術
- 北美企業所開發的皮下製劑技術(Pierre群組I)
- 歐洲企業所開發的皮下製劑技術(Pierre群組II)
- 亞太地區企業所開發的皮下製劑技術(Pierre群組III)
第12章 皮下製劑技術供應商:企業簡介
- 章概要
- 北美技術開發業者
- CD Bioparticles
- Creative Biolabs
- Creative BioMart
- Pacira BioSciences
- The Wyss Institute
- Xeris Biopharma
- 歐洲技術開發業者
- Adocia
- Ascendis Pharma
- 亞太地區技術開發業者
- Alteogen
- Foresee Pharmaceuticals
第13章 皮下製劑技術:夥伴關係和合作
- 章概要
- 夥伴關係模式
- 夥伴關係與合作:皮下製劑技術
- 各地區分析
第14章 皮下藥物遞輸系統:市場形勢
- 章概要
- 皮下藥物遞輸系統類型
- 高容量穿戴式注射器
- 自動注射器
- 筆型注射器
- 無針頭注射系統
- 新的藥物重組通知系統
- 預填充式注射器
- 植入
第15章 皮下藥物遞輸系統:產品競爭力分析
- 章概要
- 高容量穿戴式注射器
- 自動注射器
- 無針頭注射系統
- 預填充式注射器
第16章 SWOT分析
第17章 全球已通過核准皮下生技藥品市場
第18章 已通過核准皮下生技藥品市場(各生技藥品類型)
第19章 已通過核准皮下生技藥品市場(各治療類型)
第20章 已通過核准皮下生技藥品市場(各投藥法)
第21章 已通過核准皮下生技藥品市場(各治療領域)
第22章 已通過核准皮下生技藥品市場(各地區)
第23章 已通過核准皮下生技藥品市場,醫藥品的銷售額預測
- 章概要
- 主要的前提與調查手法
- 各類醫藥品預測銷售額
第24章 已通過核准皮下生技藥品市場(各主要企業)
第25章 全球皮下生技藥品技術市場
第26章 皮下生技藥品製劑技術市場(基本原理)
第27章 皮下生技藥品製劑技術市場(各終端用戶)
第28章 皮下生技藥品製劑技術市場(各治療領域)
第29章 皮下生技藥品製劑技術市場(各主要地區)
第30章 皮下生技藥品製劑技術市場(付款方式)
第31章 皮下生技藥品製劑技術市場,各主要企業
第32章 皮下藥物遞輸系統:市場預測
第33章 結論
第34章 執行洞察
第35章 附錄1:表格形式資料
第36章 附錄2:企業·團體一覽
Subcutaneous Biologics Market: Overview
As per Roots Analysis, the global subcutaneous biologics market is estimated to grow from USD 251 billion in the current year to USD 233 billion by 2035.
The market sizing and opportunity analysis has been segmented across the following parameters:
Type of Biologic
- Antibodies
- Nucleotides
- Proteins
Type of Therapy
- Monotherapies
- Combination Therapies
- Both (Monotherapies and Combination Therapies)
Method of Administration
- Injection
- Infusion
- Both (Injection and Infusion)
Fundamental Principle
- Encapsulation
- Complex Formation
- Conjugation
- Amino acid Interaction
- Other Fundamental Principles
End User
- Pharmaceutical and Biopharmaceutical Companies
- Biotechnology Companies
- MedTech Companies
- Contract Development and Manufacturing Organizations
- Educational Institutes
- Medical Equipment Manufacturers
- Other End Users
Payment Method Employed
- Milestone Payments
- Upfront Payments
Therapeutic Area
- Autoimmune Disorders
- Bone Disorders
- Hematological Disorders
- Infectious Diseases
- Inflammatory Disorders
- Metabolic Disorders
- Neurological Disorders
- Ocular Disorders
- Oncological Disorders
- Other Disorders
Type of Drug Delivery Device
- Large Volume Wearable Injectors
- Autoinjectors
- Needle-free Injection System
- Novel Drug Reconstitution System
- Prefilled Syringes
Geographical Regions
- North America
- Europe
- Asia-Pacific
- Middle East and North Africa
- Latin America
Subcutaneous Biologics Market: Growth and Trends
The demand of biologics has risen in the recent years in the pharmaceutical industry. In fact, the industry has witnessed a rise in the number of biologic drugs approved by the USFDA. This shift is due to the ability of biologics to offer targeted treatment, enabling minimal drug interactions owing to their precise binding and unique metabolic pathways.
However, developing biologics involves various challenges. These include high molecular weight, structure complexity susceptibility to degradation after administration, and productional complexities have prompted pharmaceutical companies to adopt new technologies for their development. Formulating subcutaneous biologics via conjugation, amino acid modification, and encapsulation methods are some of these technological innovations.
Additionally, novel drug delivery systems, including autoinjectors, pre-filled syringes, and needle-free methods, have been developed to administer highly viscous formulations. Previously, biologics were administered intravenously because of their swift systemic distribution and strong bioavailability. Although intravenous administration is effective, it frequently necessitates regular administration by healthcare providers, creating a hurdle for medication adherence. In recent years, methods and devices for subcutaneous administration have become increasingly popular among healthcare practitioners due to their effectiveness, safety, and tolerability Moreover, the shift towards subcutaneous biologics is fueled by the increasing need for self-administered treatments and the presence of easy-to-use drug delivery tools such as autoinjectors and pre-filled syringes.
Subcutaneous Biologics Market: Key Insights
The report delves into the current state of the subcutaneous biologics market and identifies potential growth opportunities within industry. Some key findings from the report include:
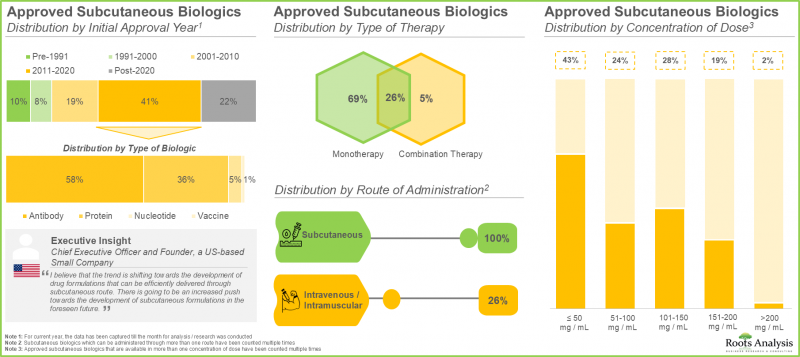
- Presently, more than 175 subcutaneous biologics have been approved for the treatment of various chronic disorders; around 50% of these biologics are proteins approved for once daily administration.
- ~20% of the subcutaneous biologics have been approved post-2020, majority of which are antibodies that can be administered as monotherapy alone.
- More than 340 subcutaneous biologics are in clinical-stages of development; ~10% of these biologics are antibodies that have received orphan drug designation.
- Around 60% of the clinical-stage subcutaneous biologics are based on inhibition mechanism; interestingly, majority of these biologics can be administered as monotherapy alone.
- Close to 20% of technologies are based on encapsulation principle; notably, all these technologies are focused towards providing extended / controlled / sustained drug release
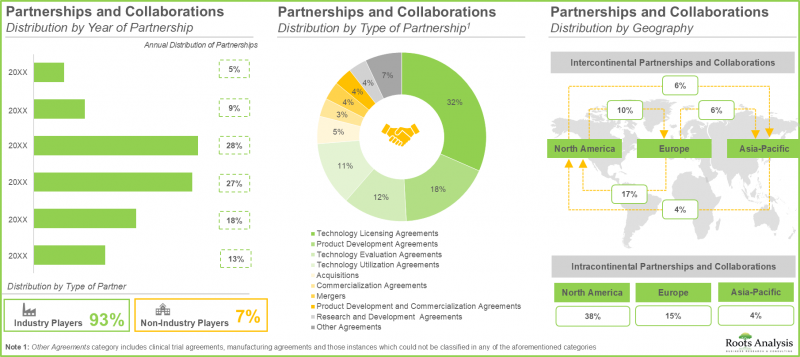
- The rising interest in this domain is reflected by the rise in partnership activity; in fact, close to 70% of the deals were inked in the last three years.
- There are several new and innovative drug delivery systems that facilitate subcutaneous administration; we identified over 560 such systems that are presently available / under development.
- Driven by the increased emphasis towards patient compliance and improved treatment outcome, the approved subcutaneous biologics market is likely to grow at a CAGR of ~5%, till 2027.
- Owing to the numerous advantages offered by subcutaneous formulation technologies and increase in the number of licensing deals, the market is anticipated to grow at an annualized rate of 22.7% in the coming decade.
Subcutaneous Biologics Market: Key Segments
Approved Subcutaneous Biologics Market
Antibodies Occupy the Highest Share in the Market
Based on type of biologic, the global market for approved subcutaneous biologics is segmented into antibodies, nucleotides and proteins. It is worth mentioning that, currently, antibodies occupy the highest share in the market, attributing to its higher target specificity, increased safety profile and lower toxicity. Further, approved subcutaneous biologics market for nucleotides is expected to witness substantial growth during the forecast period.
The Highest Market Share is Captured by Both Monotherapy and Combination Therapies
The global market for approved subcutaneous biologics is segmented across monotherapy, combination therapy, and both monotherapy and combination therapies. Both monotherapy and combination therapies segments occupy the largest current market share and is expected to witness a substantial growth during the forecast period.
Majority of the Approved Subcutaneous Biologics Market Share is Occupied by Injection
This segment highlights the distribution of global market for approved subcutaneous biologics across different types of methods of administration, such as injection, infusion, and both injection and infusion. It is worth highlighting that, presently, majority of the approved subcutaneous biologics market share is occupied by injection as a method of administration and is expected to remain dominant, during the forecast period. This can be attributed to the fact that delivery via injections is more convenient for the patients as well as healthcare professionals. Additionally, the chances of any allergic reaction and fluid overload are also reduced.
Autoimmune Disorders Segment Occupies the Highest Subcutaneous Biologics Market Share
Based on therapeutic area, the global market for approved subcutaneous biologics is segmented into autoimmune disorders, metabolic disorders, oncological disorders, hematological disorders, inflammatory disorders, neurological disorders, bone disorders and other disorders. Currently, autoimmune disorders segment occupies the highest subcutaneous biologics market share. This can be primarily attributed to the high efficacy of these drugs in the treatment of various prevalent autoimmune disorders, such as psoriasis, ankylosing spondylitis, ulcerative colitis and Crohn's disease. However, during the forecast period, metabolic disorders segment is likely to capture a larger market share owing to the rising preference of subcutaneous injection for the administration in patients suffering from diabetes mellitus and obesity (wherein long-term administration of drugs is required).
North America is Likely to Capture a Majority Share in the Overall Market
This segment highlights the distribution of approved subcutaneous biologics market across various geographies, such as North America, Europe, Asia-Pacific, Middle East and North Africa, and Latin America. According to our projections, presently, North America is likely to capture a majority share (~50%) in the overall market. Further, it is worth highlighting that the market in Asia-Pacific is expected to grow at a relatively higher CAGR, during the forecast period, till 2035. The growth of the market in Asia-Pacific can be ascribed to the rapidly growing patient population, the rising incidence of chronic disorders (including neurological disorders, genetic disorders and autoimmune disorders), and the rising demand for effective and advanced therapeutics. Further, the increasing investments and initiatives taken by regulatory bodies in the Asian countries to promote the adoption of biologics among patients and physicians is likely to drive the market in future.
Subcutaneous Biologics Market for Formulation Technologies
Market Share by Fundamental Principle
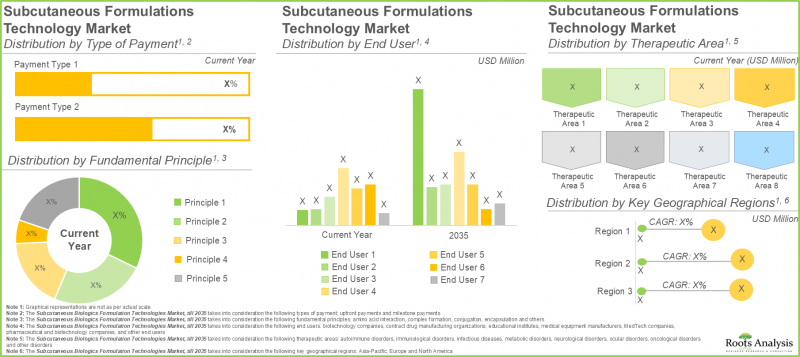
The global subcutaneous biologics formulation technology market is segmented across various fundamental principles, such as amino acid interaction, complex formation, conjugation, amino acid interaction, encapsulation and other fundamental principles. Presently, the revenues generated through the licensing of technologies that are based on encapsulation principle are likely to capture majority share in the overall market and is expected to remain dominant during the forecast period. It is worth highlighting that encapsulation helps in increasing the solubility of the biologics that are hydrophobic, which further results in increased absorption of the drugs in the patient's body. Further, drug encapsulation also leads to high target specificity, thereby reducing the likelihood of adverse effects (that usually occur due to high systemic exposure).
Biotechnology Companies are Estimated to Grow at a Relatively Higher CAGR
The global subcutaneous biologics formulation technology market caters to a wide variety of end users, including biotechnology companies, contract development and manufacturing organizations, educational institutes, medical equipment manufacturers, MedTech companies, pharmaceutical and biopharmaceutical companies and other end users. Notably, pharmaceutical and biopharmaceutical companies are expected to currently capture the highest share in the market, However, biotechnology companies are estimated to grow at a relatively higher CAGR, during the forecast period.
Oncological Disorders Hold the Largest Share in the Subcutaneous Technology Market
This segment highlights the distribution of global subcutaneous biologics formulation technology market across different therapeutic areas, such as autoimmune disorders, bone diseases, hematological disorders, infectious diseases, inflammatory disorders, metabolic disorders, neurological disorders, ocular disorders, oncological disorders and other disorders. It is worth highlighting that the oncological disorders hold the largest share in the current technology market. This can be attributed to the high incidence rate of oncological disorders, accounting for around 1.9 million cases in 2022 and over 2 million cases in 2023. Further, the global subcutaneous biologics market for formulation technology for autoimmune disorders is estimated to grow at the highest CAGR, during the forecast period.
Subcutaneous Biologics Formulation Technology Market in Asia-Pacific is Expected To Grow with the Highest CAGR
This segment highlights the distribution of subcutaneous biologics formulation technology market across various geographies, such as North America, Europe and Asia-Pacific. It is worth highlighting that North America captures close to 65% of the current global subcutaneous biologics market for formulation technology. Further, the subcutaneous biologics formulation technology market in Asia-Pacific is expected to grow with the highest CAGR, during the forecast period. The growth of market in Asia-Pacific can be attributed to the rise in number of technology developers in this region, that will be actively involved in inking licensing deals with the drug developers.
Milestone Payments Occupy the Majority Share
Based on payment method employed, the global subcutaneous formulation technology market is segmented into milestone payments and upfront payments. It is worth mentioning that milestone payments occupy the majority share in the current market and this trend is unlikely to change in the future.
Example Players in the Subcutaneous Biologics Market
- Adocia
- Alteogen
- Ascendis Pharma
- CD Bioparticles
- Creative Biolabs
- Creative BioMart
- Foresee Pharmaceuticals
- Pacira Biosciences
- The Wyss Institute
- Xeris Biopharma
Primary Research Overview
The opinions and insights presented in the market report were influenced by discussions held with stakeholders in the industry. The report features detailed transcripts of interviews held with the following industry stakeholders:
- Founder and Chief Executive Officer, Small Company, US
- Founder and Chief Technology Officer, Mid-sized Company, UK
- Chief Executive Officer & Founder, Small Company, US
- Chief Executive Officer, Small Company, Denmark
- Chief Executive Officer, Mid-sized Company, US
- Chief Technical Officer, Very Large Company, India
- Vice President and Chief Scientist, Large Company, Israel
- Senior Portfolio Director, Large Company, US
- Managing Director, Small Company, Austria
- Communication Leader, Mid-sized Company, France
- Former Founder and Chief Scientific Officer, Vice President and Product Development, Former Senior Scientist Formulation, Mid-sized Company, US
- Former Chief Commercial Officer, Large Company, Germany
- Anonymous, a US-based company
- Anonymous, a Europe-based company
Subcutaneous Biologics Market: Research Coverage
- Market Sizing and Opportunity Analysis: The report features a thorough analysis of the global subcutaneous biologics market, in terms of the key market segments, including [A] type of primary packaging container, [B] type of biologic, [C] type of therapy, [D] method of administration, [E] fundamental principle, [F] end-user, [G] payment method employed, and [H] therapeutic area, [I] type of drug delivery device and [J] geographical regions.
- Market Landscape: An in-depth assessment of the companies involved in the subcutaneous biologics market, based on several relevant parameters, such as [A] year of establishment, [B] company size, [C] location of headquarters, [D] status of development, [E]type of biologic, [F] type of therapy, [G] mechanism of action, [H] dosing frequency, [I] target disease indication, [J] therapeutic area and [K] drug designation.
- Technology Landscape: An in-depth assessment of the landscape of subcutaneous formulation technologies in the subcutaneous biologics market, based on several relevant parameters, such as [A] year of establishment, [B] company size, [C] location of headquarters, [D] as fundamental principle, [E] type of molecule, [F] route of administration, [G] therapeutic area and [H] key characteristics.
- Technology Competitive Analysis: A comprehensive analysis of subcutaneous formulation technologies based on parameters, such as [A] company strength and [B] technology strength.
- Company Profiles: In-depth profiles of leading subcutaneous formulation technology developers based in North America, Europe and Asia-Pacific engaged in the subcutaneous market, focused on parameters such as [A] company overview, [B] financial information (if available), [C] service portfolio, [D] manufacturing facilities and [E] recent developments and an informed future outlook.
- Partnerships and Collaborations: An in-depth analysis of the partnership's activity reported in this domain, based on parameters such as [A] year of partnership, [B] type of partnership [C] type of partner company.
- SWOT Analysis: Deep insights on industry affiliated trends, opportunities and challenges, under SWOT analysis, which are anticipated to impact the overall evolution of the subcutaneous biologics market.
Key Questions Answered in this Report
- How many companies are currently engaged in this market?
- Which are the leading companies in this market?
- What factors are likely to influence the evolution of this market?
- What is the current and future market size?
- What is the CAGR of this market?
- How is the current and future market opportunity likely to be distributed across key market segments?
Reasons to Buy this Report
- The report provides a comprehensive market analysis, offering detailed revenue projections of the overall market and its specific sub-segments. This information is valuable to both established market leaders and emerging entrants.
- Stakeholders can leverage the report to gain a deeper understanding of the competitive dynamics within the market. By analyzing the competitive landscape, businesses can make informed decisions to optimize their market positioning and develop effective go-to-market strategies.
- The report offers stakeholders a comprehensive overview of the market, including key drivers, barriers, opportunities, and challenges. This information empowers stakeholders to stay abreast of market trends and make data-driven decisions to capitalize on growth prospects.
Additional Benefits
- Complimentary PPT Insights Packs
- Complimentary Excel Data Packs for all Analytical Modules in the Report
- 15% Free Content Customization
- Detailed Report Walkthrough Session with Research Team
- Free Updated report if the report is 6-12 months old or older
TABLE OF CONTENTS
1. PREFACE
- 1.1. Introduction
- 1.2. Market Share Insights
- 1.3. Key Market Insights
- 1.4. Report Coverage
- 1.5. Key Questions Answered
- 1.6. Chapter Outlines
2. RESEARCH METHODOLOGY
- 2.1. Chapter Overview
- 2.2. Research Assumptions
- 2.2.1. Market Landscape and Market Trends
- 2.2.2. Market Forecast and Opportunity Analysis
- 2.3. Database Building
- 2.3.1. Data Collection
- 2.3.2. Data Validation
- 2.3.3. Data Analysis
- 2.4. Project Methodology
- 2.4.1. Secondary Research
- 2.4.1.1. Annual Reports
- 2.4.1.2. Academic Research Papers
- 2.4.1.3. Company Websites
- 2.4.1.4. Investor Presentations
- 2.4.1.5. Regulatory Filings
- 2.4.1.6. White Papers
- 2.4.1.7. Industry Publications
- 2.4.1.8. Conferences and Seminars
- 2.4.1.9. Government Portals
- 2.4.1.10. Media and Press Releases
- 2.4.1.11. Newsletters
- 2.4.1.12. Industry Databases
- 2.4.1.13. Roots Proprietary Databases
- 2.4.1.14. Paid Databases and Sources
- 2.4.1.15. Social Media Portals
- 2.4.1.16. Other Secondary Sources
- 2.4.2. Primary Research
- 2.4.2.1. Types of Primary Research
- 2.4.2.1.1. Qualitative Research
- 2.4.2.1.2. Quantitative Research
- 2.4.2.1.3. Hybrid Approach
- 2.4.2.2. Advantages of Primary Research
- 2.4.2.3. Techniques for Primary Research
- 2.4.2.3.1. Interviews
- 2.4.2.3.2. Surveys
- 2.4.2.3.3. Focus Groups
- 2.4.2.3.4. Observational Research
- 2.4.2.3.5. Social Media Interactions
- 2.4.2.4. Key Opinion Leaders Considered in Primary Research
- 2.4.2.4.1. Company Executives (CXOs)
- 2.4.2.4.2. Board of Directors
- 2.4.2.4.3. Company Presidents and Vice Presidents
- 2.4.2.4.4. Research and Development Heads
- 2.4.2.4.5. Technical Experts
- 2.4.2.4.6. Subject Matter Experts
- 2.4.2.4.7. Scientists
- 2.4.2.4.8. Doctors and Other Healthcare Providers
- 2.4.2.5. Ethics and Integrity
- 2.4.2.5.1. Research Ethics
- 2.4.2.5.2. Data Integrity
- 2.4.2.1. Types of Primary Research
- 2.4.3. Analytical Tools and Databases
- 2.4.1. Secondary Research
3. MARKET DYNAMICS
- 3.1. Chapter Overview
- 3.2. Forecast Methodology
- 3.2.1. Top-down Approach
- 3.2.2. Bottom-up Approach
- 3.2.3. Hybrid Approach
- 3.3. Market Assessment Framework
- 3.3.1. Total Addressable Market (TAM)
- 3.3.2. Serviceable Addressable Market (SAM)
- 3.3.3. Serviceable Obtainable Market (SOM)
- 3.3.4. Currently Acquired Market (CAM)
- 3.4. Forecasting Tools and Techniques
- 3.4.1. Qualitative Forecasting
- 3.4.2. Correlation
- 3.4.3. Regression
- 3.4.4. Extrapolation
- 3.4.5. Convergence
- 3.4.6. Sensitivity Analysis
- 3.4.7. Scenario Planning
- 3.4.8. Data Visualization
- 3.4.9. Time Series Analysis
- 3.4.10. Forecast Error Analysis
- 3.5. Key Considerations
- 3.5.1. Demographics
- 3.5.2. Government Regulations
- 3.5.3. Reimbursement Scenarios
- 3.5.4. Market Access
- 3.5.5. Supply Chain
- 3.5.6. Industry Consolidation
- 3.5.7. Pandemic / Unforeseen Disruptions Impact
- 3.6. Key Market Segmentation
- 3.7. Robust Quality Control
- 3.8. Limitations
4. ECONOMIC AND OTHER PROJECT SPECIFIC CONSIDERATIONS
- 4.1. Chapter Overview
- 4.2. Market Dynamics
- 4.2.1. Time Period
- 4.2.1.1. Historical Trends
- 4.2.1.2. Current and Future Estimates
- 4.2.2. Currency Coverage and Foreign Exchange Rate
- 4.2.2.1. Major Currencies Affecting the Market
- 4.2.2.2. Factors Affecting Currency Fluctuations and Foreign Exchange Rates
- 4.2.2.3. Impact of Foreign Exchange Rate Volatility on the Market
- 4.2.2.4. Strategies for Mitigating Foreign Exchange Risk
- 4.2.3. Trade Policies
- 4.2.3.1. Impact of Trade Barriers on the Market
- 4.2.3.2. Strategies for Mitigating the Risks Associated with Trade Barriers
- 4.2.4. Recession
- 4.2.4.1. Historical Analysis of Past Recessions and Lessons Learnt
- 4.2.4.2. Assessment of Current Economic Conditions and Potential Impact on the Market
- 4.2.5. Inflation
- 4.2.5.1. Measurement and Analysis of Inflationary Pressures in the Economy
- 4.2.5.2. Potential Impact of Inflation on the Market Evolution
- 4.2.1. Time Period
5. EXECUTIVE SUMMARY
6. INTRODUCTION
- 6.1. Chapter Overview
- 6.2. Types of Therapeutic Molecules
- 6.3. Biologically Derived Molecules
- 6.3.1. Type of Products
- 6.3.2. Routes of Administration and Formulations
- 6.3.3. Subcutaneous Formulations
- 6.3.3.1. Approaches in Subcutaneous Delivery of Biologics
- 6.3.3.1.1. Reformulation
- 6.3.3.1.2. Differing Potencies
- 6.3.3.1.3. Novel Technologies
- 6.3.3.2. Methods of Subcutaneous Administration
- 6.3.3.3. Advantages of Subcutaneous Administration
- 6.3.3.4. Limitations of Subcutaneous Administration
- 6.3.3.1. Approaches in Subcutaneous Delivery of Biologics
- 6.4. Regulatory Considerations
- 6.4.1. Medical Devices
- 6.4.2. Drug Device Combination Products
- 6.5. Future Perspectives
7. APPROVED SUBCUTANEOUS BIOLOGICS: MARKET LANDSCAPE
- 7.1. Chapter Overview
7.2. Approved Subcutaneous Biologics: Overall Market Overview
- 7.2.1. Analysis by Initial Approval Year
- 7.2.2. Analysis by Type of Biologic
- 7.2.3. Analysis by Type of Therapy
- 7.2.4. Analysis by Route of Administration
- 7.2.5. Analysis by Method of Administration
- 7.2.6. Analysis by Dosing Frequency
- 7.2.7. Analysis by Concentration of Dose
- 7.2.8. Analysis by Target Disease Indication
- 7.2.9. Analysis by Therapeutic Area
- 7.2.10. Analysis by Type of Drug Delivery Device
- 7.3. Approved Subcutaneous Biologics: List of Developers
- 7.3.1. Analysis by Year of Establishment
- 7.3.2. Analysis by Company Size
- 7.3.3. Analysis by Location of Headquarters (Region)
- 7.3.4. Analysis by Location of Headquarters (Country)
- 7.3.5. Most Active Developers: Analysis by Number of Approved Drugs
8. APPROVED SUBCUTANEOUS BIOLOGICS: SUCCESS PROTOCOL ANALYSIS
- 8.1. Chapter Overview
- 8.2. Methodology
- 8.3. Success Protocol Analysis of Top Approved Subcutaneous Biologics
- 8.3.1. BENLYSTA(R) (Human Genome Sciences)
- 8.3.1.1. Overview
- 8.3.1.2. Development History
- 8.3.1.3. Phase of Development, Route of Administration, and Target Disease Indication
- 8.3.1.4. Success Protocol Analysis
- 8.3.2. BESREMi(R) (PharmaEssentia)
- 8.3.2.1. Overview
- 8.3.2.2. Development History
- 8.3.2.3. Phase of Development, Route of Administration, and Target Disease Indication
- 8.3.2.4. Success Protocol Analysis
- 8.3.3. COSENTYX(R) (Novartis)
- 8.3.3.1. Overview
- 8.3.3.2. Development History
- 8.3.3.3. Phase of Development, Route of Administration, and Target Disease Indication
- 8.3.3.4. Success Protocol Analysis
- 8.3.4. DARZALEX FASPRO(R) / DARZALEX(R) SC (Halozyme)
- 8.3.4.1. Overview
- 8.3.4.2. Development History
- 8.3.4.3. Phase of Development, Route of Administration, and Target Disease Indication
- 8.3.4.4. Success Protocol Analysis
- 8.3.5. DUPIXENT(R) (Regeneron Pharma)
- 8.3.5.1. Overview
- 8.3.5.2. Development History
- 8.3.5.3. Phase of Development, Route of Administration, and Target Disease Indication
- 8.3.5.4. Success Protocol Analysis
- 8.3.6. Enbrel(R) (Amgen)
- 8.3.6.1. Overview
- 8.3.6.2. Development History
- 8.3.6.3. Phase of Development, Route of Administration, and Target Disease Indication
- 8.3.6.4. Success Protocol Analysis
- 8.3.7. HEMLIBRA(R) (Roche)
- 8.3.7.1. Overview
- 8.3.7.2. Development History
- 8.3.7.3. Phase of Development, Route of Administration, and Target Disease Indication
- 8.3.7.4. Success Protocol Analysis
- 8.3.8. Prolia(R) / Pralia(R) (Amgen)
- 8.3.8.1. Overview
- 8.3.8.2. Development History
- 8.3.8.3. Phase of Development, Route of Administration, and Target Disease Indication
- 8.3.8.4. Success Protocol Analysis
- 8.3.9. STELARA(R) (Janssen Biotech)
- 8.3.9.1. Overview
- 8.3.9.2. Development History
- 8.3.9.3. Phase of Development, Route of Administration, and Target Disease Indication
- 8.3.9.4. Success Protocol Analysis
- 8.3.10. Trulicity(R) (Eli Lilly)
- 8.3.10.1. Overview
- 8.3.10.2. Development History
- 8.3.10.3. Phase of Development, Route of Administration, and Target Disease Indication
- 8.3.10.4. Success Protocol Analysis
- 8.3.1. BENLYSTA(R) (Human Genome Sciences)
- 8.4. Conclusion
9. CLINICAL-STAGE SUBCUTANEOUS BIOLOGICS: MARKET LANDSCAPE
- 9.1. Chapter Overview
9.2. Clinical-stage Subcutaneous Biologics: Overall Market Overview
- 9.2.1. Analysis by Phase of Development
- 9.2.2. Analysis by Type of Biologic
- 9.2.3. Analysis by Type of Therapy
- 9.2.4. Analysis by Mechanism of Action
- 9.2.5. Analysis by Dosing Frequency
- 9.2.6. Analysis by Drug Designation
- 9.2.7. Analysis by Target Disease Indication
- 9.2.8. Analysis by Therapeutic Area
- 9.3. Clinical-stage Subcutaneous Biologics: List of Developers
- 9.3.1. Analysis by Year of Establishment
- 9.3.2. Analysis by Company Size
- 9.3.3. Analysis by Location of Headquarters
- 9.3.4. Most Active Developers: Analysis by Number of Clinical-stage Drugs
10. SUBCUTANEOUS FORMULATION: TECHNOLOGY LANDSCAPE
- 10.1. Chapter Overview
- 10.2. Subcutaneous Formulation: Technology Landscape
- 10.2.1. Analysis by Fundamental Principle
- 10.2.2. Analysis by Type of Molecule
- 10.2.3. Analysis by Route of Administration
- 10.2.4. Analysis by Therapeutic Area
- 10.2.5. Analysis by Key Characteristics
- 10.3. Subcutaneous Formulation: Technology Developers Landscape
- 10.3.1. Analysis by Year of Establishment
- 10.3.2. Analysis by Company Size
- 10.3.3. Analysis by Location of Headquarters
11. TECHNOLOGY COMPETITIVENESS ANALYSIS
- 11.1. Chapter Overview
- 11.2. Assumptions and Key Parameters
- 11.3. Methodology
- 11.4. Technology Competitiveness Analysis: Subcutaneous Formulation Technology
- 11.4.1. Subcutaneous Formulation Technology Developed by Companies based in North America (Peer Group I)
- 11.4.2. Subcutaneous Formulation Technology Developed by Companies based in Europe (Peer Group II)
- 11.4.3. Subcutaneous Formulation Technology Developed by Companies based in Asia-Pacific (Peer Group III)
12. SUBCUTANEOUS FORMULATION TECHNOLOGY PROVIDERS: COMPANY PROFILES
- 12.1. Chapter Overview
- 12.2. Technology Developers Based in North America
- 12.2.1. CD Bioparticles
- 12.2.1.1. Company Overview
- 12.2.1.2. Technology Portfolio
- 12.2.1.3. Recent Developments and Future Outlook
- 12.2.2. Creative Biolabs
- 12.2.2.1. Company Overview
- 12.2.2.2. Technology Portfolio
- 12.2.2.3. Recent Developments and Future Outlook
- 12.2.3. Creative BioMart
- 12.2.3.1. Company Overview
- 12.2.3.2. Technology Portfolio
- 12.2.3.3. Recent Developments and Future Outlook
- 12.2.4. Pacira BioSciences
- 12.2.4.1. Company Overview
- 12.2.4.2. Financial Information
- 12.2.4.3. Technology Portfolio
- 12.2.4.4. Recent Developments and Future Outlook
- 12.2.5. The Wyss Institute
- 12.2.5.1. Company Overview
- 12.2.5.2. Technology Portfolio
- 12.2.5.3. Recent Developments and Future Outlook
- 12.2.6. Xeris Biopharma
- 12.2.6.1. Company Overview
- 12.2.6.2. Financial Information
- 12.2.6.3. Technology Portfolio
- 12.2.6.4. Recent Developments and Future Outlook
- 12.2.1. CD Bioparticles
- 12.3. Technology Developers Based in Europe
- 12.3.1. Adocia
- 12.3.1.1. Company Overview
- 12.3.1.2. Financial Information
- 12.3.1.3. Technology Portfolio
- 12.3.1.4. Recent Developments and Future Outlook
- 12.3.2. Ascendis Pharma
- 12.3.2.1. Company Overview
- 12.3.2.2. Financial Information
- 12.3.2.3. Technology Portfolio
- 12.3.2.4. Recent Developments and Future Outlook
- 12.3.1. Adocia
- 12.4. Technology Developers Based in Asia-Pacific
- 12.4.1. Alteogen
- 12.4.1.1. Company Overview
- 12.4.1.2. Technology Portfolio
- 12.4.1.3. Recent Developments and Future Outlook
- 12.4.2. Foresee Pharmaceuticals
- 12.4.2.1. Company Overview
- 12.4.2.2. Financial Information
- 12.4.2.3. Technology Portfolio
- 12.4.2.4. Recent Developments and Future Outlook
- 12.4.1. Alteogen
13. SUBCUTANEOUS FORMULATION TECHNOLOGIES: PARTNERSHIPS AND COLLABORATIONS
- 13.1. Chapter Overview
- 13.2. Partnership Models
- 13.3. Partnerships and Collaborations: Subcutaneous Formulation Technology
- 13.3.1. Analysis by Year of Partnership
- 13.3.2. Analysis by Type of Partnership
- 13.3.3. Analysis by Year and Type of Partnership
- 13.3.4. Analysis by Type of Partner
- 13.3.5. Analysis by Location of Headquarters of Partner
- 13.3.6. Analysis by Therapeutic Area
- 13.3.7. Most Active Players: Analysis by Number of Partnerships
- 13.4. Analysis by Geography
- 13.4.1. Intracontinental and Intercontinental Agreements
- 13.4.2. International and Local Agreements
14. SUBCUTANEOUS DRUG DELIVERY SYSTEMS: MARKET LANDSCAPE
- 14.1. Chapter Overview
- 14.2. Types of Subcutaneous Drug Delivery Systems
- 14.2.1. Large Volume Wearable Injectors
- 14.2.1.1. Large Volume Wearable Injectors for Non-Insulin Drugs: Market Landscape
- 14.2.1.1.1. Analysis by Status of Development
- 14.2.1.1.2. Analysis by Type of Device
- 14.2.1.1.3. Analysis by Usability
- 14.2.1.1.4. Analysis by Type of Dose
- 14.2.1.1.5. Analysis by Type of Drug Container
- 14.2.1.1.6. Analysis by Mode of Drug Filling
- 14.2.1.1.7. Analysis by Container Volume (mL)
- 14.2.1.1.8. Analysis by Route of Administration
- 14.2.1.1.9. Analysis by Mode of Injection
- 14.2.1.1.10. Analysis by Mechanism of Action / Driving Force
- 14.2.1.1.11. Analysis by Type of Technology
- 14.2.1.1.12. Analysis by Availability of Connectivity Feature
- 14.2.1.1.13. Analysis by Type of Compatible Drug
- 14.2.1.1.14. Analysis by Compatibility with High Viscosity Drugs
- 14.2.1.1.15. Analysis by Therapeutic Area
- 14.2.1.1.16. Most Active Players: Analysis by Number of Large Volume Wearable Injectors for Non-Insulin Drugs
- 14.2.1.2. Large Volume Wearable Injectors for Insulin Drugs
- 14.2.1.2.1. Analysis by Status of Development
- 14.2.1.2.2. Analysis by Type of Device
- 14.2.1.2.3. Analysis by Usability
- 14.2.1.2.4. Analysis by Type of Dose
- 14.2.1.2.5. Analysis by Mode of Drug Filling
- 14.2.1.2.6. Analysis by Container Volume (mL)
- 14.2.1.2.7. Analysis by Type of Diabetes
- 14.2.1.2.8. Analysis by Type of Combination Insulin
- 14.2.1.2.9. Analysis by Period of Use (Days)
- 14.2.1.2.10. Analysis by Type of Device Control Feature
- 14.2.1.2.11. Analysis by Availability of Interoperable Device
- 14.2.1.2.12. Analysis by Availability of Continuous Glucose Monitoring (CGM) / Blood Glucose Meters (BGM) System
- 14.2.1.2.13. Analysis by Availability of Automatic Insulin Delivery (AID) / Artificial Pancreas
- 14.2.1.2.14. Analysis by Type of Automated Insulin Delivery (AID) Feature
- 14.2.1.2.15. Analysis by Availability of Connectivity Feature
- 14.2.1.2.16. Analysis by Waterproof Capabilities
- 14.2.1.2.17. Most Active Players: Analysis by Number of Large Volume Wearable Injectors for Insulin Drugs
- 14.2.1.3. Large Volume Drug Device Combinations for Non-Insulin Drugs: Market Landscape
- 14.2.1.3.1. Analysis by Status of Development
- 14.2.1.3.2. Analysis by Type of Device
- 14.2.1.3.3. Analysis by Usability
- 14.2.1.3.4. Analysis by Type of Dose
- 14.2.1.3.5. Analysis by Type of Drug Container
- 14.2.1.3.6. Analysis by Mode of Drug Filling
- 14.2.1.3.7. Analysis by Container Volume (mL)
- 14.2.1.3.8. Analysis by Route of Administration
- 14.2.1.3.9. Analysis by Mode of Injection
- 14.2.1.3.10. Analysis by Type of Compatible Drug
- 14.2.1.3.11. Analysis by Mechanism of Action / Driving Force
- 14.2.1.3.12. Analysis by Type of Technology
- 14.2.1.3.13. Analysis by Therapeutic Area
- 14.2.1.3.14. Leading Players: Analysis by Number of Drug Device Combinations for Non-Insulin Drugs
- 14.2.1.1. Large Volume Wearable Injectors for Non-Insulin Drugs: Market Landscape
- 14.2.2. Autoinjectors
- 14.2.2.1. Current Market Landscape
- 14.2.2.1.1. Analysis by Stage of Development
- 14.2.2.1.2. Analysis by Usability
- 14.2.2.1.3. Analysis by Type of Primary Drug Container
- 14.2.2.1.4. Analysis by Requirement of Needle
- 14.2.2.1.5. Analysis by Volume of Container
- 14.2.2.1.6. Analysis by Type of Dose Delivered
- 14.2.2.1.7. Analysis by Route of Administration
- 14.2.2.1.8. Analysis by Type of Actuation Mechanism
- 14.2.2.1.9. Analysis by Type of Feedback Mechanism
- 14.2.2.1.10. Analysis by Availability of Connectivity Feature
- 14.2.2.1.11. Analysis by Target Indication
- 14.2.2.1.12. Analysis by Type of Molecule Delivered
- 14.2.2.1.13. Analysis by End User
- 14.2.2.1.14. Most Active Players: Analysis by Number of Autoinjectors
- 14.2.2.1. Current Market Landscape
- 14.2.3. Pen Injectors
- 14.2.3.1. Current Market Landscape
- 14.2.3.1.1. Analysis by Type of Dose
- 14.2.3.1.2. Analysis by Storage Volume / Capacity
- 14.2.3.1.3. Analysis by Usability
- 14.2.3.1.4. Most Active Players: Analysis by Number of Devices
- 14.2.3.2. Drug Device Combination Products
- 14.2.3.1. Current Market Landscape
- 14.2.4. Needle Free Injection System
- 14.2.4.1. Current Market Landscape
- 14.2.4.1.1. Analysis by Actuation Mechanism
- 14.2.4.1.2. Analysis by Route of Administration
- 14.2.4.1.3. Analysis by Type of Formulation Administered
- 14.2.4.1.4. Analysis by Type of Drug Delivered
- 14.2.4.1.5. Analysis by Therapeutic Area
- 14.2.4.1.6. Analysis by Usability
- 14.2.4.1.7. Analysis by Type of Formulation Administered and Actuation Mechanism
- 14.2.4.1. Current Market Landscape
- 14.2.5. Novel Drug Reconstitution Delivery Systems
- 14.2.5.1. Current Market Landscape
- 14.2.5.1.1. Analysis by Type of Device
- 14.2.5.1.2. Analysis by Type of Chamber
- 14.2.5.1.3. Analysis by Type of Device and Type of Chamber
- 14.2.5.1.4. Analysis by Physical State of Drug
- 14.2.5.1.5. Analysis by Container Fabrication Material
- 14.2.5.1.6. Analysis by Volume of Container
- 14.2.5.1.7. Analysis by Drug Class
- 14.2.5.1.8. Analysis by Device Usability
- 14.2.5.1.9. Analysis by Container Fabrication Material and Device Usability
- 14.2.5.1.10. Analysis by Type of Pre-sterilized Devices
- 14.2.5.1.11. Analysis by Type of User-sterilized Devices
- 14.2.5.1.12. Analysis by Type of Sterilization Equipment Used
- 14.2.5.1.13. Most Active Players: Analysis by Number of Novel Drug Reconstitution Systems Manufactured
- 14.2.5.1. Current Market Landscape
- 14.2.6. Prefilled Syringes
- 14.2.6.1. Current Market Landscape
- 14.2.6.1.1. Analysis by Type of Barrel Fabrication Material
- 14.2.6.1.2. Analysis by Number of Barrel Chambers
- 14.2.6.1.3. Analysis by Type of Needle System
- 14.2.6.1.4. Analysis by Volume of Syringe
- 14.2.6.1.5. Most Active Players: Analysis by Number of Prefilled Syringes
- 14.2.6.2. Drug Device Combination Products
- 14.2.6.1. Current Market Landscape
- 14.2.7. Implants
- 14.2.7.1. Current Market Landscape
- 14.2.7.1.1. Analysis by Phase of Development
- 14.2.7.1.2. Analysis by Therapeutic Area
- 14.2.7.1.3. Analysis by Implant Material
- 14.2.7.1.4. Analysis by Treatment Duration
- 14.2.7.1.5. Analysis by Type of Delivery System
- 14.2.7.1.6. Most Active Players: Analysis by Number of Implants
- 14.2.7.2. Subcutaneous Implants Eluting Small Molecules
- 14.2.7.1. Current Market Landscape
- 14.2.1. Large Volume Wearable Injectors
15. SUBCUTANEOUS DRUG DELIVERY SYSTEMS: PRODUCT COMPETITIVENESS ANALYSIS
- 15.1. Chapter Overview
- 15.2. Large Volume Wearable Injectors
- 15.2.1. Assumptions and Key Parameters
- 15.2.2. Methodology
- 15.2.3. Product Competitiveness Analysis: Large Volume Wearable Injectors for Non-Insulin Drugs
- 15.2.3.1. Products Developed by Players in North America
- 15.2.3.2. Products Developed by Players in Europe
- 15.2.3.3. Products Developed by Players in Asia and Middle East and North Africa
- 15.2.4. Product Competitiveness Analysis: Large Volume Wearable Injectors for Insulin Drugs
- 15.2.4.1. Products Developed by Players in North America
- 15.2.4.2. Products Developed by Players in Europe
- 15.2.4.3. Products Developed by Players in Asia and Middle East and North Africa
- 15.2.5. Product Competitiveness Analysis: Large Volume Drug Device Combinations for Non-Insulin Drugs
- 15.2.5.1. Products Developed by Players in North America
- 15.2.5.2. Products Developed by Players in Europe
- 15.2.5.3. Products Developed by Players in Middle East and North Africa
- 15.3. Autoinjectors
- 15.3.1. Assumptions and Key Parameters
- 15.3.2. Methodology
- 15.3.3. Product Competitiveness Analysis: Autoinjectors
- 15.3.3.1. Disposable Autoinjectors
- 15.3.3.2. Reusable Autoinjectors
- 15.4. Needle-free Injection Systems
- 15.4.1. Assumptions and Key Parameters
- 15.4.2. Methodology
- 15.4.3. Product Competitiveness Analysis: Needle-free Injection Systems
- 15.4.3.1. Spring-based Needle-free Injection Systems
- 15.4.3.2. Gas-powered Needle-free Injection Systems
- 15.4.3.3. Other Needle-free Injection Systems
- 15.5. Prefilled Syringes
- 15.5.1. Assumptions and Key Parameters
- 15.5.2. Methodology
- 15.5.3. Product Competitiveness Analysis: Prefilled Syringes
- 15.5.3.1. Glass Barrel Prefilled Syringes
- 15.5.3.2. Plastic Barrel Prefilled Syringes
16. SWOT ANALYSIS
- 16.1. Chapter Overview
- 16.2. Comparison of SWOT Factors
- 16.2.1. Strengths
- 16.2.2. Weaknesses
- 16.2.3. Opportunities
- 16.2.4. Threats
17. GLOBAL APPROVED SUBCUTANEOUS BIOLOGICS MARKET
- 17.1. Chapter Overview
- 17.2. Key Assumptions and Methodology
- 17.3. Global Approved Subcutaneous Biologics Market, till 2035
- 17.3.1. Roots Analysis Perspective on Market Growth
- 17.3.2. Scenario Analysis
- 17.3.2.1. Conservative Scenario
- 17.3.2.2. Optimistic Scenario
- 17.4. Key Market Segmentations
18. APPROVED SUBCUTANEOUS BIOLOGICS MARKET, BY TYPE OF BIOLOGIC
- 18.1. Chapter Overview
- 18.2. Key Assumptions and Methodology
- 18.3. Approved Subcutaneous Biologics Market: Distribution by Type of Biologic, Current year and 2035
- 18.3.1. Approved Subcutaneous Biologics Market for Antibodies, till 2035
- 18.3.2. Approved Subcutaneous Biologics Market for Proteins, till 2035
- 18.3.3. Approved Subcutaneous Biologics Market for Nucleotides, till 2035
- 18.4. Data Triangulation and Validation
19. APPROVED SUBCUTANEOUS BIOLOGICS MARKET, BY TYPE OF THERAPY
- 19.1. Chapter Overview
- 19.2. Key Assumptions and Methodology
- 19.3. Approved Subcutaneous Biologics Market: Distribution by Type of Therapy, Current year and 2035
- 19.3.1. Approved Subcutaneous Biologics Market for Monotherapy, till 2035
- 19.3.2. Approved Subcutaneous Biologics Market for Combination Therapy, till 2035
- 19.3.3. Approved Subcutaneous Biologics Market for Both Monotherapy and Combination Therapies, till 2035
- 19.4. Data Triangulation and Validation
20. APPROVED SUBCUTANEOUS BIOLOGICS MARKET, BY METHOD OF ADMINISTRATION
- 20.1. Chapter Overview
- 20.2. Key Assumptions and Methodology
- 20.3. Approved Subcutaneous Biologics Market: Distribution by Method of Administration, Current year and 2035
- 20.3.1. Approved Subcutaneous Biologics Market for Administration via Injection, till 2035
- 20.3.2. Approved Subcutaneous Biologics Market for Administration via Infusion, till 2035
- 20.3.3. Approved Subcutaneous Biologics Market for Administration via Both Injection and Infusion, till 2035
- 20.4. Data Triangulation and Validation
21. APPROVED SUBCUTANEOUS BIOLOGICS MARKET, BY THERAPEUTIC AREA
- 21.1. Chapter Overview
- 21.2. Key Assumptions and Methodology
- 21.3. Approved Subcutaneous Biologics Market: Distribution by Therapeutic Area, Current year and 2035
- 21.3.1. Approved Subcutaneous Biologics Market for Autoimmune Disorders, till 2035
- 21.3.2. Approved Subcutaneous Biologics Market for Metabolic Disorders, till 2035
- 21.3.3. Approved Subcutaneous Biologics Market for Oncological Disorders, till 2035
- 21.3.4. Approved Subcutaneous Biologics Market for Hematological Disorders, till 2035
- 21.3.5. Approved Subcutaneous Biologics Market for Inflammatory Disorders, till 2035
- 21.3.6. Approved Subcutaneous Biologics Market for Neurological Disorders, till 2035
- 21.3.7. Approved Subcutaneous Biologics Market for Bone Disorders, till 2035
- 21.3.8. Approved Subcutaneous Biologics Market for Other Disorders, till 2035
- 21.4. Data Triangulation and Validation
22. APPROVED SUBCUTANEOUS BIOLOGICS MARKET, BY GEOGRAPHICAL REGIONS
- 22.1. Chapter Overview
- 22.2. Key Assumptions and Methodology
- 22.3. Approved Subcutaneous Biologics Market: Distribution by Geographical Regions, Current year and 2035
- 22.3.1. Approved Subcutaneous Biologics Market in North America, till 2035
- 22.3.2. Approved Subcutaneous Biologics Market in Europe, till 2035
- 22.3.3. Approved Subcutaneous Biologics Market in Asia-Pacific, till 2035
- 22.3.4. Approved Subcutaneous Biologics Market in Middle East and North Africa, till 2035
- 22.3.5. Approved Subcutaneous Biologics Market in Latin America, till 2035
- 22.4. Penetration-Growth (P-G) Matrix
- 22.5. Data Triangulation and Validation
23. APPROVED SUBCUTANEOUS BIOLOGICS MARKET, SALES FORECAST OF DRUGS
- 23.1. Chapter Overview
- 23.2. Key Assumptions and Methodology
- 23.3. Drug-wise Sales Forecast
- 23.3.1. Actemra(R) / RoActemra(R)
- 23.3.2. Acthar(R) Gel / ACTHar
- 23.3.3. AIMOVIG(R)
- 23.3.4. AJOVY(R)
- 23.3.5. AMVUTTRA(R)
- 23.3.6. Aranesp(R) / NESP(R)
- 23.3.7. Basaglar(R) / Abasaglar
- 23.3.8. BENLYSTA(R)
- 23.3.9. Betaseron(R) / Betaferon(R) / EXTAVIA(R)
- 23.3.10. CABLIVI(R)
- 23.3.11. CIMZIA(R)
- 23.3.12. COSENTYX(R)
- 23.3.13. CRYSVITA(R)
- 23.3.14. DARZALEX FASPRO(R) / DARZALEX(R) SC
- 23.3.15. DUPIXENT(R)
- 23.3.16. EMGALITY(R)
- 23.3.17. Enbrel(R)
- 23.3.18. ENSPRYNG(R)
- 23.3.19. ENTYVIO(R)
- 23.3.20. Epogen(R) / Procrit(R) / Eprex(R)
- 23.3.21. EVENITY(R)
- 23.3.22. FASENRA(R)
- 23.3.23. FIASP(R)
- 23.3.24. Forteo(R) / Forsteo(R)
- 23.3.25. GATTEX(R) / Revestive(R)
- 23.3.26. Genotropin(R)
- 23.3.27. GIVLAARI(R)
- 23.3.28. G-LASTA(R) / Peglasta(R) / Neulasta(R) / GRAN(R)
- 23.3.29. Gonal-F(R)
- 23.3.30. HAEGARDA(R)
- 23.3.31. HEMLIBRA(R)
- 23.3.32. Herceptin(R) SC / HERCEPTIN(TM) HYLECTA
- 23.3.33. Hizentra(R)
- 23.3.34. Humalog(R)
- 23.3.35. HUMIRA(R)
- 23.3.36. Humulin(R)
- 23.3.37. ILARIS(R)
- 23.3.38. Kesimpta(R)
- 23.3.39. KEVZARA(R)
- 23.3.40. KINERET(R)
- 23.3.41. LANTUS(R)
- 23.3.42. LEQVIO(R)
- 23.3.43. Mircera(R)
- 23.3.44. MOUNJARO(R)
- 23.3.45. NPLATE(R)
- 23.3.46. Nucala(R)
- 23.3.47. ORENCIA(R)
- 23.3.48. OXLUMO(R)
- 23.3.49. PALYNZIQ(R)
- 23.3.50. Phesgo(R)
- 23.3.51. PLEGRIDY(R)
- 23.3.52. PRALUENT(R)
- 23.3.53. Prolia(R) / Pralia(R)
- 23.3.54. Rebif(R)
- 23.3.55. REBLOZYL(R)
- 23.3.56. REKOVELLE(R)
- 23.3.57. Repatha(R)
- 23.3.58. RITUXAN HYCELA(R) / MabThera(R) SC
- 23.3.59. RYZODEG(R) 70/30 SC
- 23.3.60. Saizen(R)
- 23.3.61. Saxenda(R)
- 23.3.62. SIMPONI(R)
- 23.3.63. Skyrizi(R)
- 23.3.64. SOLIQUA(R) 100/33
- 23.3.65. STELARA(R)
- 23.3.66. Strensiq(R)
- 23.3.67. TAKHZYRO(R)
- 23.3.68. Taltz(R)
- 23.3.69. Tecentriq(R)
- 23.3.70. TEGSEDI(R)
- 23.3.71. TEZSPIRE(R)
- 23.3.72. Toujeo(R)
- 23.3.73. TREMFYA(R)
- 23.3.74. TRESIBA(R)
- 23.3.75. Trulicity(R)
- 23.3.76. Tysabri(R)
- 23.3.77. Ultomiris(R)
- 23.3.78. Victoza(R)
- 23.3.79. Voxzogo(R)
- 23.3.80. VYVGART(R) Hytrulo
- 23.3.81. WAINUA(TM)
- 23.3.82. Xgeva(R) / RANMARK(R)
- 23.3.83. XOLAIR(R)
- 23.3.84. XULTOPHY(R)
- 23.3.85. ZEPBOUND(R)
24. APPROVED SUBCUTANEOUS BIOLOGICS MARKET, BY LEADING PLAYERS
25. GLOBAL SUBCUTANEOUS BIOLOGICS FORMULATION TECHNOLOGIES MARKET
- 25.1. Chapter Overview
- 25.2. Key Assumptions and Methodology
- 25.3. Global Subcutaneous Biologics Formulation Technologies Market, till 2035
- 25.3.1. Roots Analysis Perspective on Market Growth
- 25.3.2. Scenario Analysis
- 25.3.2.1. Conservative Scenario
- 25.3.2.2. Optimistic Scenario
- 25.4. Key Market Segmentations
26. SUBCUTANEOUS BIOLOGICS FORMULATION TECHNOLOGIES MARKET, BY FUNDAMENTAL PRINCIPLE
- 26.1. Chapter Overview
- 26.2. Key Assumptions and Methodology
- 26.3. Subcutaneous Biologics Formulation Technologies Market: Distribution by Fundamental Principle, Current year and 2035
- 26.3.1. Subcutaneous Biologics Formulation Technologies Market for Encapsulation Principle, till 2035
- 26.3.2. Subcutaneous Biologics Formulation Technologies Market for Complex Formation Principle, till 2035
- 26.3.3. Subcutaneous Biologics Formulation Technologies Market for Conjugation Principle, till 2035
- 26.3.4. Subcutaneous Biologics Formulation Technologies Market for Amino Acid Interaction Principle, till 2035
- 26.3.5. Subcutaneous Biologics Formulation Technologies Market for Other Principles, till 2035
- 26.4. Data Triangulation and Validation
27. SUBCUTANEOUS BIOLOGICS FORMULATION TECHNOLOGIES MARKET, BY END USER
- 27.1. Chapter Overview
- 27.2. Key Assumptions and Methodology
- 27.3. Subcutaneous Biologics Formulation Technologies Market: Distribution by Type of End User, Current year and 2035
- 27.3.1. Subcutaneous Biologics Formulation Technologies for Pharmaceutical and Biopharmaceutical Companies, till 2035
- 27.3.2. Subcutaneous Biologics Formulation Technologies for Biotechnology Companies, till 2035
- 27.3.3. Subcutaneous Biologics Formulation Technologies for MedTech Companies, till 2035
- 27.3.4. Subcutaneous Biologics Formulation Technologies for Contract Drug Manufacturing Organizations, till 2035
- 27.3.5. Subcutaneous Biologics Formulation Technologies for Educational Institutes, till 2035
- 27.3.6. Subcutaneous Biologics Formulation Technologies for Medical Equipment Manufacturers, till 2035
- 27.3.7. Subcutaneous Biologics Formulation Technologies for Other End Users, till 2035
- 27.4. Data Triangulation and Validation
28. SUBCUTANEOUS BIOLOGICS FORMULATION TECHNOLOGIES MARKET, BY THERAPEUTIC AREA
- 28.1. Chapter Overview
- 28.2. Key Assumptions and Methodology
- 28.3. Subcutaneous Biologics Formulation Technologies Market: Distribution by Therapeutic Area, Current year and 2035
- 28.3.1. Subcutaneous Biologics Formulation Technologies for Oncological Disorders, till 2035
- 28.3.2. Subcutaneous Biologics Formulation Technologies for Metabolic Disorders, till 2035
- 28.3.3. Subcutaneous Biologics Formulation Technologies for Ocular Disorders, till 2035
- 28.3.4. Subcutaneous Biologics Formulation Technologies for Infectious Diseases, till 2035
- 28.3.5. Subcutaneous Biologics Formulation Technologies for Autoimmune Disorders, till 2035
- 28.3.6. Subcutaneous Biologics Formulation Technologies for Neurological Disorders, till 2035
- 28.3.7. Subcutaneous Biologics Formulation Technologies for Immunological Disorders, till 2035
- 28.3.8. Subcutaneous Biologics Formulation Technologies for Other Disorders, till 2035
- 28.4. Data Triangulation and Validation
29. SUBCUTANEOUS BIOLOGICS FORMULATION TECHNOLOGIES MARKET, BY KEY GEOGRAPHICAL REGIONS
- 29.1. Chapter Overview
- 29.2. Key Assumptions and Methodology
- 29.3. Subcutaneous Biologics Formulation Technologies Market: Distribution by Key Geographical Regions, Current year and 2035
- 29.3.1. Subcutaneous Biologics Formulation Technologies Market in North America, till 2035
- 29.3.2. Subcutaneous Biologics Formulation Technologies Market in Europe, till 2035
- 29.3.3. Subcutaneous Biologics Formulation Technologies Market in Asia-Pacific, till 2035
- 29.4. Penetration-Growth (P-G) Matrix
- 29.5. Data Triangulation and Validation
30. SUBCUTANEOUS BIOLOGICS FORMULATION TECHNOLOGIES MARKET, BY TYPE OF PAYMENT METHOD EMPLOYED
- 30.1. Chapter Overview
- 30.2. Key Assumptions and Methodology
- 30.3. Subcutaneous Biologics Formulation Technologies Market: Distribution by Type of Payment Method Employed, Current year and 2035
- 30.3.1. Subcutaneous Biologics Formulation Technologies Market based on Milestone Payments, till 2035
- 30.3.2. Subcutaneous Biologics Formulation Technologies Market based on Upfront Payments, till 2035
- 30.4. Data Triangulation and Validation
31. SUBCUTANEOUS BIOLOGICS FORMULATION TECHNOLOGIES MARKET, BY LEADING PLAYERS
32. SUBCUTANEOUS DRUG DELIVERY SYSTEM: MARKET FORECAST
- 32.1. Chapter Overview
- 32.2. Global Large Volume Wearable Injectors Market
- 32.2.1. Global Large Volume Wearable Injectors Market for Non-Insulin Drugs, till 2035 (By Value)
- 32.2.2. Global Large Volume Wearable Injectors Market for Non-Insulin Drugs, till 2035 (By Volume)
- 32.2.3. Global Large Volume Wearable Injectors Market for Insulin Drugs, till 2035 (By Value)
- 32.2.4. Global Large Volume Wearable Injectors Market for Insulin Drugs, till 2035 (By Volume)
- 32.2.5. Global Autoinjectors Market
- 32.2.6. Global Needle-free Injection Systems Market
- 32.2.7. Global Novel Drug Reconstitution Systems Market
- 32.2.8. Global Prefilled Syringes Market
33. CONCLUSION
34. EXECUTIVE INSIGHTS
- 34.1. Chapter Overview
- 34.2. Company A
- 34.2.1. Company Snapshot
- 34.2.2. Interview Transcript: Founder and Chief Executive Officer
- 34.3. Company B
- 34.3.1. Company Snapshot
- 34.3.2. Interview Transcript: Founder and Chief Technology Officer
- 34.4. Company C
- 34.4.1. Company Snapshot
- 34.4.2. Interview Transcript: Chief Executive Officer & Founder
- 34.5. Company D
- 34.5.1. Company Snapshot
- 34.5.2. Interview Transcript: Chief Executive Officer
- 34.6. Company E
- 34.6.1. Company Snapshot
- 34.6.2. Interview Transcript: Chief Executive Officer
- 34.7. Company F
- 34.7.1. Company Snapshot
- 34.7.2. Interview Transcript: Chief Technical Officer
- 34.8. Company G
- 34.8.1. Company Snapshot
- 34.8.2. Interview Transcript: Vice President and Chief Scientist
- 34.9. Company H
- 34.9.1. Company Snapshot
- 34.9.2. Interview Transcript: Senior Portfolio Director
- 34.10. Company I
- 34.10.1. Company Snapshot
- 34.10.2. Interview Transcript: Managing Director
- 34.11. Company J
- 34.11.1. Company Snapshot
- 34.11.2. Interview Transcript: Communication Leader
- 34.12. Company K
- 34.12.1. Company Snapshot
- 34.12.2. Interview Transcript: Former Founder and Chief Scientific Officer, Former Vice President (Product Development) and Former Sr. Scientist Formulation
- 34.13. Company L
- 34.13.1. Company Snapshot
- 34.13.2. Interview Transcript:Former Chief Commercial Officer
- 34.14. Company M
- 34.14.1. Company Snapshot
- 34.14.2. Interview Transcript: Anonymous
- 34.15. Company N
- 34.15.1. Company Snapshot
- 34.15.2. Interview Transcript: Anonymous
35. APPENDIX 1: TABULATED DATA
36. APPENDIX 2: LIST OF COMPANIES AND ORGANIZATIONS
List of Tables
- Table 6.1 Comparison of Characteristics of Small Molecules and Biologics
- Table 6.2 Parenteral Routes of Administration
- Table 6.3 Parenteral Drug Formulations: Associated Physical and Chemical Instabilities
- Table 6.4 Parenteral Drug Formulations: Key Excipients
- Table 7.1 Approved Subcutaneous Biologics: Market Landscape
- Table 7.2 Approved Subcutaneous Biologics: Information on Type of Therapy, Route and Method of Administration
- Table 7.3 Approved Subcutaneous Biologics: Information on Dosing Frequency and Concentration of Dose
- Table 7.4 Approved Subcutaneous Biologics: Information on Target Disease Indication and Therapeutic Area
- Table 7.5 Approved Subcutaneous Biologics: Information on Type of Drug Delivery Device
- Table 7.6 Approved Subcutaneous Biologics: List of Developers
- Table 8.1 List of Top Approved Subcutaneous Biologics
- Table 8.2 BENLYSTA (Human Genome Sciences): Phase of Development, Route of Administration, and Target Disease Indication
- Table 8.3 BENLYSTA (Human Genome Sciences): Success Protocol Analysis Parameters
- Table 8.4 BESREMi (Pharmaessentia): Phase of Development, Route of Administration, and Target Disease Indication
- Table 8.5 BESREMi (Pharmaessentia): Success Protocol Analysis Parameters
- Table 8.6 COSENTYX (Novartis): Phase of Development, Route of Administration, and Target Disease Indication
- Table 8.7 COSENTYX (Novartis): Success Protocol Analysis Parameters
- Table 8.8 DARZALEX FASPRO (Halozyme): Phase of Development, Route of Administration, and Target Disease Indication
- Table 8.9 DARZALEX FASPRO (Halozyme): Success Protocol Analysis Parameters
- Table 8.10 DUPIXENT (Regeneron Pharma): Phase of Development, Route of Administration, and Target Disease Indication
- Table 8.11 DUPIXENT (Regeneron Pharma): Success Protocol Analysis Parameters
- Table 8.12 Enbrel (Amgen): Phase of Development, Route of Administration, and Target Disease Indication
- Table 8.13 Enbrel (Amgen): Success Protocol Analysis Parameters
- Table 8.14 HEMLIBRA (Roche): Phase of Development, Route of Administration, and Target Disease Indication
- Table 8.15 HEMLIBRA (Roche): Success Protocol Analysis Parameters
- Table 8.16 Prolia / Pralia (Amgen): Phase of Development, Route of Administration, and Target Disease Indication
- Table 8.17 Prolia / Pralia (Amgen): Success Protocol Analysis Parameters
- Table 8.18 STELARA (Janssen Biotech): Phase of Development, Route of Administration, and Target Disease Indication
- Table 8.19 STELARA (Janssen Biotech): Success Protocol Analysis Parameters
- Table 8.20 Trulicity (Eli Lilly): Phase of Development, Route of Administration, and Target Disease Indication
- Table 8.21 Trulicity (Eli Lilly): Success Protocol Analysis Parameters
- Table 9.1 Clinical-stage Subcutaneous Biologics: Market Landscape
- Table 9.2 Clinical-stage Subcutaneous Biologics: Information on Type of Therapy, Mechanism of Action and Dosing Frequency
- Table 9.3 Clinical-stage Subcutaneous Biologics: Information on Drug Designation
- Table 9.4 Clinical-stage Subcutaneous Biologics: Information on Target Disease Indication and Therapeutic Area
- Table 9.5 Clinical-stage Subcutaneous Biologics: List of Developers
- Table 10.1 Subcutaneous Formulation Technologies: Information on Fundamental Principle and Type of Molecule
- Table 10.2 Subcutaneous Formulation Technologies: Information on Route of Administration
- Table 10.3 Subcutaneous Formulation Technologies: Information on Therapeutic Area
- Table 10.4 Subcutaneous Formulation Technologies: Information on Key Characteristics
- Table 10.5 Subcutaneous Formulation Technologies: List of Developers
- Table 12.1 Subcutaneous Formulation Technologies Developers: List of Companies Profiled
- Table 12.2 CD Bioparticles: Company Snapshot
- Table 12.3 CD Bioparticles: Technology Portfolio
- Table 12.4 Creative Biolabs: Company Snapshot
- Table 12.5 Creative Biolabs: Technology Portfolio
- Table 12.6 Creative Biolabs: Recent Developments and Future Outlook
- Table 12.7 Creative BioMart: Company Snapshot
- Table 12.8 Creative BioMart: Technology Portfolio
- Table 12.9 Creative BioMart: Recent Developments and Future Outlook
- Table 12.10 Pacira BioSciences: Company Snapshot
- Table 12.11 Pacira BioSciences: Technology Portfolio
- Table 12.12 Pacira BioSciences: Recent Developments and Future Outlook
- Table 12.13 The Wyss Institute: Company Snapshot
- Table 12.14 The Wyss Institute: Technology Portfolio
- Table 12.15 Xeris Biopharma: Company Snapshot
- Table 12.16 Xeris Biopharma: Technology Portfolio
- Table 12.17 Xeris Biopharma: Recent Developments and Future Outlook
- Table 12.18 Adocia: Company Snapshot
- Table 12.19 Adocia: Technology Portfolio
- Table 12.20 Adocia: Recent Developments and Future Outlook
- Table 12.21 Ascendis Pharma: Company Snapshot
- Table 12.22 Ascendis Pharma: Technology Portfolio
- Table 12.23 Ascendis Pharma: Recent Developments and Future Outlook
- Table 12.24 Alteogen: Company Snapshot
- Table 12.25 Alteogen: Technology Portfolio
- Table 12.26 Alteogen: Recent Developments and Future Outlook
- Table 12.27 Foresee Pharmaceuticals: Company Snapshot
- Table 12.28 Foresee Pharmaceuticals: Technology Portfolio
- Table 12.29 Foresee Pharmaceuticals: Recent Developments and Future Outlook
- Table 13.1 Partnerships and Collaborations: Information on Type of Partner, Year of Agreement and Type of Partnership, since 2019
- Table 13.2 Partnerships and Collaborations: Information on Therapeutic Area and Type of Agreement (Country-wise and Continent-wise)
- Table 14.1 Large Volume Wearable Injectors for Non-Insulin Drugs: Information on Status of Development, Type of Device and Usability
- Table 14.2 Large Volume Wearable Injectors for Non-Insulin Drugs: Information on Type of Dose, Type of Drug Container and Mode of Drug Filling
- Table 14.3 Large Volume Wearable Injectors for Non-Insulin Drugs: Information on Container Volume (mL), Route of Administration and Mode of Injection
- Table 14.4 Large Volume Wearable Injectors for Non-Insulin Drugs: Information on Mechanism of Action / Driving Force and Type of Technology
- Table 14.5 Large Volume Wearable Injectors for Non-Insulin Drugs: Information on Availability of Connectivity Feature and Type of Compatible Drug
- Table 14.6 Large Volume Wearable Injectors for Non-Insulin Drugs: Information on Compatibility with High Viscosity Drugs and Therapeutic Area
- Table 14.7 Large Volume Wearable Injectors for Insulin Drugs: Information on Status of Development, Type of Device and Usability
- Table 14.8 Large Volume Wearable Injectors for Insulin Drugs: Information on Type of Dose, Mode of Drug Filling and Container Volume (mL)
- Table 14.9 Large Volume Wearable Injectors for Insulin Drugs: Information on Type of Diabetes, Type of Combination Insulin and Period of Use (days)
- Table 14.10 Large Volume Wearable Injectors for Insulin Drugs: Information on Type of Device Control Feature and Availability of Interoperable Device
- Table 14.11 Large Volume Wearable Injectors for Insulin Drugs: Information on Availability of CGM / BGM system, Availability of Automatic Insulin Delivery / Artificial Pancreases and Type of Automated Insulin Delivery Feature
- Table 14.12 Large Volume Wearable Injectors for Insulin Drugs: Information on Availability of Connectivity Feature and Waterproof Capabilities
- Table 14.13 Large Volume Drug Device Combinations for Non-Insulin Drugs: Information on Developer, Status of Development, Type of Device and Usability
- Table 14.14 Large Volume Drug Device Combinations for Non-Insulin Drugs: Information on Type of Dose, Mode of Drug Filling, Type of Drug Container and Container Volume (mL)
- Table 14.15 Large Volume Drug Device Combinations for Non-Insulin Drugs: Information on Route of Administration, Mode of Injection and Type of Compatible Drug
- Table 14.16 Large Volume Drug Device Combinations for Non-Insulin Drugs: Information on Type of Technology, Mechanism of Action / Driving Force and Therapeutic Area
- Table 14.17 Autoinjectors: Overall Market Landscape
- Table 14.18 Autoinjectors: Information on Requirement of Needle, Volume of Container, Type of Dose Delivered and Route of Administration
- Table 14.19 Autoinjectors: Information on Type of Actuation Mechanism, Type of Feedback Mechanism, Availability of Connectivity Feature and Target Indication
- Table 14.20 Autoinjectors: Information on Type of Molecule Delivered and End-user
- Table 14.21 Pen Injectors: Development Landscape
- Table 14.22 List of Smart Pen Injectors
- Table 14.23 List of Drug and Pen Injector Combination Products
- Table 14.24 List of Needle-free Injection Systems
- Table 14.25 Needle-free Injection Systems: Information on Type of Actuation Mechanism
- Table 14.26 Needle-free Injection Systems: Information on Route of Administration
- Table 14.27 Needle-free Injection Systems: Information on Type of Formulation Administered
- Table 14.28 Needle-free Injection Systems: Information on Type of Drugs Delivered
- Table 14.29 Needle-free Injection Systems: Information on Therapeutic Area
- Table 14.30 Needle-free Injection Systems: Information on Usability
- Table 14.31 Novel Drug Reconstitution Systems: Information on Manufacturer, Type of Device, Number of Chambers, Physical State of Drug and Certifications / Accreditations
- Table 14.32 Novel Drug Reconstitution Systems: Information on Container Fabrication Material, Type of Plastic, Volume, Drug Class, Device Usability and Provisions for Self-Administration
- Table 14.33 Novel Drug Reconstitution Systems: Information on Type of Pre-sterilized Device, User-sterilized Device, Sterilization Equipment Used and Type of Technology
- Table 14.34 Prefilled Syringes: List of Products
- Table 14.35 Prefilled Syringe Combination Products: List of Approved Drugs, 2013-2023
- Table 14.36 List of Other Drugs Available in Prefilled Syringe Format
- Table 14.37 Implants: Development Landscape
- Table 14.38 Implants: Information on Material Type, Treatment Duration and Type of Delivery System
- Table 14.39 Implants: Subcutaneous Implants Eluting Small Molecules
- Table 17.1 Number of Approved Subcutaneous Drugs since 2018 (not having sales information)
- Table 25.1 Subcutaneous Biologics Formulation Technologies: Average Upfront and Milestone Payment, since 2019 (USD Million)
- Table 25.2 Licensing Deals: Tranches of Milestone Payments
- Table 31.1 Leading Players: Based on Number of Technology Licensing / Utilization Deals
- Table 31.2 Leading Players: Based on Number of Partnership Deals
- Table 34.1 Rx Bandz: Company Snapshot
- Table 34.2 Oval Medical Technologies: Company Snapshot
- Table 34.3 Lindy Biosciences: Company Snapshot
- Table 34.4 Subcuject: Company Snapshot
- Table 34.5 Qlibrium: Company Snapshot
- Table 34.6 Intas Pharmaceuticals: Company Snapshot
- Table 34.7 Elcam Medical: Company Snapshot
- Table 34.8 IDEO: Company Snapshot
- Table 34.9 Pharma Consult: Company Snapshot
- Table 34.10 Medincell: Company Snapshot
- Table 34.11 Xeris Biopharma: Company Snapshot
- Table 34.12 IDT Biologika: Company Snapshot
- Table 35.1 Approved Subcutaneous Biologics: Distribution by Initial Approval Year
- Table 35.2 Approved Subcutaneous Biologics: Distribution by Type of Biologic
- Table 35.3 Approved Subcutaneous Biologics: Distribution by Initial Approval Year and Type of Biologic
- Table 35.4 Approved Subcutaneous Biologics: Distribution by Type of Therapy
- Table 35.5 Approved Subcutaneous Biologics: Distribution by Route of Administration
- Table 35.6 Approved Subcutaneous Biologics: Distribution by Method of Administration
- Table 35.7 Approved Subcutaneous Biologics: Distribution by Dosing Frequency
- Table 35.8 Approved Subcutaneous Biologics: Distribution by Concentration of Dose
- Table 35.9 Approved Subcutaneous Biologics: Distribution by Target Disease Indications
- Table 35.10 Approved Subcutaneous Biologics: Distribution by Therapeutic Area
- Table 35.11 Approved Subcutaneous Biologics: Distribution by Type of Drug Delivery Device
- Table 35.12 Approved Subcutaneous Biologic Developers: Distribution by Year of Establishment
- Table 35.13 Approved Subcutaneous Biologics Developers: Distribution by Company Size
- Table 35.14 Approved Subcutaneous Biologics Developers: Distribution by Location of Headquarters (Region)
- Table 35.15 Approved Subcutaneous Biologics Developers: Distribution by Location of Headquarters (Country)
- Table 35.16 Approved Subcutaneous Biologics Developers: Distribution by Company Size and Location of Headquarters (Region)
- Table 35.17 Most Active Developers: Distribution by Number of Approved Therapies
- Table 35.18 Clinical-stage Subcutaneous Biologics: Phase of Development
- Table 35.19 Clinical-stage Subcutaneous Biologics: Distribution by Type of Biologic
- Table 35.20 Clinical-Stage Subcutaneous Biologics: Distribution by Stage of Development and Type of Biologic
- Table 35.21 Clinical-stage Subcutaneous Biologics: Distribution by Type of Therapy
- Table 35.22 Clinical-stage Subcutaneous Biologics: Distribution by Mechanism of Action
- Table 35.23 Clinical-stage Subcutaneous Biologics: Distribution by Dosing Frequency
- Table 35.24 Clinical-stage Subcutaneous Biologics: Distribution by Drug Designation
- Table 35.25 Clinical-stage Subcutaneous Biologics: Distribution by Target Disease Indication
- Table 35.26 Clinical-stage Subcutaneous Biologics: Distribution by Therapeutics Area
- Table 35.27 Clinical-stage Subcutaneous Biologics: Distribution by Stage of Development and Therapeutics Area
- Table 35.28 Clinical-stage Subcutaneous Biologics: Distribution by Therapeutic Area and Type of Biologic
- Table 35.29 Clinical-stage Subcutaneous Biologic Developers: Distribution by Year of Establishment
- Table 35.30 Clinical-stage Subcutaneous Biologics Developers: Distribution by Company Size
- Table 35.31 Clinical-stage Subcutaneous Biologics Developers: Distribution by Location of Headquarters (Region)
- Table 35.32 Clinical-stage Subcutaneous Biologics Developers: Distribution by Company Size and Location of Headquarters (Region)
- Table 35.33 Most Active Developers: Distribution by Number of Clinical-stage Therapies
- Table 35.34 Subcutaneous Formulation Technologies: Distribution by Fundamental Principle
- Table 35.35 Subcutaneous Formulation Technologies: Distribution by Type of Molecule
- Table 35.36 Subcutaneous Formulation Technologies: Distribution by Route of Administration
- Table 35.37 Subcutaneous Formulation Technologies: Distribution by Therapeutic Area
- Table 35.38 Subcutaneous Formulation Technologies: Distribution by Type of Molecule and Route of Administration
- Table 35.39 Subcutaneous Formulation Technologies: Distribution by Key Characteristics
- Table 35.40 Subcutaneous Formulation Technology Developers: Distribution by Year of Establishment
- Table 35.41 Subcutaneous Formulation Technology Developers: Distribution by Company Size
- Table 35.42 Subcutaneous Formulation Technology Developers: Distribution by Location of Headquarters (Region)
- Table 35.43 Subcutaneous Formulation Technology Developers: Distribution by Company Size and Location of Headquarters (Region)
- Table 35.44 Pacira BioSciences: Annual Revenues, since 2020 (USD Million)
- Table 35.45 Xeris Pharmaceuticals: Annual Revenues, since 2020 (USD Million)
- Table 35.46 ADOCIA: Annual Revenues, since 2019 (EUR Million)
- Table 35.47 Ascendis Pharma: Annual Revenues, since 2020 (EUR Million)
- Table 35.48 Foresee Pharmaceuticals: Annual Revenues, since 2020 (NTD Million)
- Table 35.49 Partnerships and Collaborations: Cumulative Year-wise Trend, since 2019
- Table 35.50 Partnerships and Collaborations: Distribution by Type of Partnership
- Table 35.51 Partnerships and Collaborations: Distribution by Year and Type of Partnership, since 2019
- Table 35.52 Partnerships and Collaborations: Distribution by Type of Partner
- Table 35.53 Partnerships and Collaborations: Distribution by Therapeutic Area
- Table 35.54 Partnerships and Collaborations: Distribution by Location of Headquarters of Partner
- Table 35.55 Most Active Players: Distribution by Number of Partnerships
- Table 35.56 Partnerships and Collaborations: Distribution by Region
- Table 35.57 Partnerships and Collaborations: Distribution by Intercontinental and Intracontinental Agreements
- Table 35.58 Partnerships and Collaborations: Distribution by International and Local Agreements
- Table 35.59 Large Volume Wearable Injectors: Distribution by Type of Device (By Drug Administered)
- Table 35.60 Large Volume Wearable Injectors for Non-Insulin Drugs: Distribution by Status of Development
- Table 35.61 Large Volume Wearable Injectors for Non-Insulin Drugs: Distribution by Type of Device
- Table 35.62 Large Volume Wearable Injectors for Non-Insulin Drugs: Distribution by Usability
- Table 35.63 Large Volume Wearable Injectors for Non-Insulin Drugs: Distribution by Type of Dose
- Table 35.64 Large Volume Wearable Injectors for Non-Insulin Drugs: Distribution by Type of Drug Container
- Table 35.65 Large Volume Wearable Injectors for Non-Insulin Drugs: Distribution by Mode of Drug Filling
- Table 35.66 Large Volume Wearable Injectors for Non-Insulin Drugs: Distribution by Container Volume (mL)
- Table 35.67 Large Volume Wearable Injectors for Non-Insulin Drugs: Distribution by Route of Administration
- Table 35.68 Large Volume Wearable Injectors for Non-Insulin Drugs: Distribution by Mode of Injection
- Table 35.69 Large Volume Wearable Injectors for Non-Insulin Drugs: Distribution by Mechanism of Action / Driving Force
- Table 35.70 Large Volume Wearable Injectors for Non-Insulin Drugs: Distribution by Type of Technology
- Table 35.71 Large Volume Wearable Injectors for Non-Insulin Drugs: Distribution by Availability for Connectivity Feature
- Table 35.72 Large Volume Wearable Injectors for Non-Insulin Drugs: Distribution by Type of Compatible Drug
- Table 35.73 Large Volume Wearable Injectors for Non-Insulin Drugs: Distribution by Compatibility with High Viscosity Drugs
- Table 35.74 Large Volume Wearable Injectors for Non-Insulin Drugs: Distribution by Therapeutic Area
- Table 35.75 Most-Active Players: Distribution by Number of Large Volume Wearable Injectors Manufactured for Non-Insulin Drugs
- Table 35.76 Large Volume Wearable Injectors for Insulin Drugs: Distribution by Status of Development
- Table 35.77 Large Volume Wearable Injectors for Insulin Drugs: Distribution by Type of Device
- Table 35.78 Large Volume Wearable Injectors for Insulin Drugs: Distribution by Usability
- Table 35.79 Large Volume Wearable Injectors for Insulin Drugs: Distribution by Type of Dose
- Table 35.80 Large Volume Wearable Injectors for Insulin Drugs: Distribution by Mode of Drug Filling
- Table 35.81 Large Volume Wearable Injectors for Insulin Drugs: Distribution by Container Volume (mL)
- Table 35.82 Large Volume Wearable Injectors for Insulin Drugs: Distribution by Type of Diabetes
- Table 35.83 Large Volume Wearable Injectors for Insulin Drugs: Distribution by Type of Combination Insulin
- Table 35.84 Large Volume Wearable Injectors for Insulin Drugs: Distribution by Period of use (Days)
- Table 35.85 Large Volume Wearable Injectors for Insulin Drugs: Distribution by Type of Device Control Feature
- Table 35.86 Large Volume Wearable Injectors for Insulin Drugs: Distribution by Availability of Interoperable Device
- Table 35.87 Large Volume Wearable Injectors for Insulin Drugs: Distribution by Availability of Continuous Glucose Monitoring (CGM) / Blood Glucose Monitoring (BGM) System
- Table 35.88 Large Volume Wearable Injectors for Insulin Drugs: Distribution by Availability of Automatic Insulin Delivery (AID) / Artificial Pancreas
- Table 35.89 Large Volume Wearable Injectors for Insulin Drugs: Distribution by Type of Automated Insulin Delivery
- Table 35.90 Large Volume Wearable Injectors for Insulin Drugs: Distribution by Availability of Connectivity Feature
- Table 35.91 Large Volume Wearable Injectors for Insulin Drugs: Distribution by Waterproof Capabilities
- Table 35.92 Most-Active Players: Large Volume Wearable Injectors for Insulin Drugs
- Table 35.93 Large Volume Drug Device Combinations for Non-Insulin Drugs: Distribution by Status of Development
- Table 35.94 Large Volume Drug Device Combinations for Non-Insulin Drugs: Distribution by Type of Device
- Table 35.95 Large Volume Drug Device Combinations for Non-Insulin Drugs: Distribution by Usability
- Table 35.96 Large Volume Drug Device Combinations for Non-Insulin Drugs: Distribution by Type of Dose
- Table 35.97 Large Volume Drug Device Combinations for Non-Insulin Drugs: Distribution by Type of Drug Container
- Table 35.98 Large Volume Drug Device Combinations for Non-Insulin Drugs: Distribution by Mode of Drug Filling
- Table 35.99 Large Volume Drug Device Combinations for Non-Insulin Drugs: Distribution by Container Volume (mL)
- Table 35.100 Large Volume Drug Device Combinations for Non-Insulin Drugs: Distribution by Route of Administration
- Table 35.101 Large Volume Drug Device Combinations for Non-Insulin Drugs: Distribution by Mode of Injection
- Table 35.102 Large Volume Drug Device Combinations for Non-Insulin Drugs: Distribution by Type of Compatible Drug
- Table 35.103 Large Volume Drug Device Combinations for Non-Insulin Drugs: Distribution by Mechanism of Action / Driving Force
- Table 35.104 Large Volume Drug Device Combinations for Non-Insulin Drugs: Distribution by Type of Technology
- Table 35.105 Large Volume Drug Device Combinations for Non-Insulin Drugs: Distribution by Therapeutic Area
- Table 35.106 Most-Active Players: Distribution by Number of Drug Device Combinations for Non-Insulin Drugs
- Table 35.107 Autoinjectors: Distribution by Stage of Development
- Table 35.108 Autoinjectors: Distribution by Usability
- Table 35.109 Autoinjectors: Distribution by Type of Primary Drug Container
- Table 35.110 Autoinjectors: Distribution by Requirement of Needle
- Table 35.111 Autoinjectors: Distribution by Volume of Container
- Table 35.112 Autoinjectors: Distribution by Type of Dose Delivered
- Table 35.113 Autoinjectors: Distribution by Route of Administration
- Table 35.114 Autoinjectors: Distribution by Type of Actuation Mechanism
- Table 35.115 Autoinjectors: Distribution by Type of Feedback Mechanism
- Table 35.116 Autoinjectors: Distribution by Availability of Connectivity Feature
- Table 35.117 Autoinjectors: Distribution by Target Indication
- Table 35.118 Autoinjectors: Distribution by Type of Molecule Delivered
- Table 35.119 Autoinjectors: Distribution by End User
- Table 35.120 Most Active Players: Distribution by Number of Autoinjectors
- Table 35.121 Pen Injectors: Distribution by Type of Dose
- Table 35.122 Pen Injectors: Distribution by Volume Storage / Capacity
- Table 35.123 Pen Injectors: Distribution by Usability
- Table 35.124 Most Active Players: Distribution by Number of Pen Injectors
- Table 35.125 Needle-free Injection Systems: Distribution by Type of Actuation Mechanism
- Table 35.126 Needle-free Injection Systems: Distribution by Route of Administration
- Table 35.127 Needle-free Injection Systems: Distribution by Type of Formulation Administered
- Table 35.128 Needle-free Injection Systems: Distribution by Type of Drug Delivered
- Table 35.129 Needle-free Injection Systems: Distribution by Therapeutic Area
- Table 35.130 Needle-free Injection Systems: Distribution by Usability
- Table 35.131 Needle-free Injection Systems: Distribution by Type of Formulation Administered and Actuation Mechanism
- Table 35.132 Novel Drug Reconstitution Systems: Distribution by Type of Device
- Table 35.133 Novel Drug Reconstitution Systems: Distribution by Type of Chamber
- Table 35.134 Novel Drug Reconstitution Systems: Distribution by Type of Device and Type of Chamber
- Table 35.135 Novel Drug Reconstitution Systems: Distribution by Physical State of Drug
- Table 35.136 Novel Drug Reconstitution Systems: Distribution by Container Fabrication Material
- Table 35.137 Novel Drug Reconstitution Systems: Distribution by Volume of Container (mL)
- Table 35.138 Novel Drug Reconstitution Systems: Distribution by Drug Class
- Table 35.139 Novel Drug Reconstitution Systems: Distribution by Device Usability
- Table 35.140 Novel Drug Reconstitution Systems: Distribution by Container Fabrication Material and Device Usability
- Table 35.141 Novel Drug Reconstitution Systems: Distribution by Type of Pre-sterilized Devices
- Table 35.142 Novel Drug Reconstitution Systems: Distribution by Type of User-sterilized Devices
- Table 35.143 Novel Drug Reconstitution Systems: Distribution by Type of Sterilization Equipment Used
- Table 35.144 Most-Active Players: Distribution by Number of Novel Drug Reconstitution Systems Manufactured
- Table 35.145 Prefilled Syringes: Distribution by Type of Barrel Fabrication Material
- Table 35.146 Prefilled Syringes: Distribution by Number of Barrel Chambers
- Table 35.147 Prefilled Syringes: Distribution by Type of Needle System
- Table 35.148 Prefilled Syringes: Distribution by Volume of Syringe
- Table 35.149 Most Active Players: Distribution by Number of Prefilled Syringes
- Table 35.150 Implants: Distribution by Phase of Development
- Table 35.151 Implants: Distribution by Therapeutic Area
- Table 35.152 Implants: Distribution by Implant Material
- Table 35.153 Implants: Distribution by Treatment Duration
- Table 35.154 Implants: Distribution by Type of Delivery System
- Table 35.155 Most Active Players: Distribution By Number of Implants
- Table 35.156 Global Approved Subcutaneous Biologics Market, till 2035: Base Scenario (USD Billion)
- Table 35.157 Global Approved Subcutaneous Biologics Market, till 2035: Conservative Scenario (USD Billion)
- Table 35.158 Global Approved Subcutaneous Biologics Market, till 2035: Optimistic Scenario (USD Billion)
- Table 35.159 Approved Subcutaneous Biologics Market: Distribution by Type of Biologic, Current year and 2035
- Table 35.160 Approved Subcutaneous Biologics Market for Antibodies, till 2035, Conservative, Base and Optimistic Scenarios (USD Billion)
- Table 35.161 Approved Subcutaneous Biologics Market for Proteins, till 2035, Conservative, Base and Optimistic Scenarios (USD Billion)
- Table 35.162 Approved Subcutaneous Biologics Market for Nucleotides, till 2035, Conservative, Base and Optimistic Scenarios (USD Billion)
- Table 35.163 Approved Subcutaneous Biologics Market: Distribution by Type of Therapy, Current year and 2035
- Table 35.164 Approved Subcutaneous Biologics Market for Monotherapy, till 2035, Conservative, Base and Optimistic Scenarios (USD Billion)
- Table 35.165 Approved Subcutaneous Biologics Market for Combination Therapy, till 2035, Conservative, Base and Optimistic Scenarios (USD Billion)
- Table 35.166 Approved Subcutaneous Biologics Market for Both Monotherapy and Combination Therapy, till 2035, Conservative, Base and Optimistic Scenarios (USD Billion)
- Table 35.167 Approved Subcutaneous Biologics Market: Distribution by Method of Administration, Current year and 2035
- Table 35.168 Approved Subcutaneous Biologics Market for Administration via Injection, till 2035, Conservative, Base and Optimistic Scenarios (USD Billion)
- Table 35.169 Approved Subcutaneous Biologics Market for Administration via Infusion till 2035, Conservative, Base and Optimistic Scenarios (USD Billion)
- Table 35.170 Approved Subcutaneous Biologics Market for both Injection and Infusion, till 2035, Conservative, Base and Optimistic Scenarios (USD Billion)
- Table 35.171 Approved Subcutaneous Biologics Market: Distribution by Therapeutic Area, Current year and 2035
- Table 35.172 Approved Subcutaneous Biologics Market for Autoimmune Disorders, till 2035, Conservative, Base and Optimistic Scenarios (USD Billion)
- Table 35.173 Approved Subcutaneous Biologics Market for Metabolic Disorders, till 2035, Conservative, Base and Optimistic Scenarios (USD Billion)
- Table 35.174 Approved Subcutaneous Biologics Market for Oncological Disorders, till 2035, Conservative, Base and Optimistic Scenarios (USD Billion)
- Table 35.175 Approved Subcutaneous Biologics Market for Hematological Disorders, till 2035, Conservative, Base and Optimistic Scenarios (USD Billion)
- Table 35.176 Approved Subcutaneous Biologics Market for Inflammatory Disorders, till 2035, Conservative, Base and Optimistic Scenarios (USD Billion)
- Table 35.177 Approved Subcutaneous Biologics Market for Neurological Disorders, till 2035, Conservative, Base and Optimistic Scenarios (USD Billion)
- Table 35.178 Approved Subcutaneous Biologics Market for Bone Disorders, till 2035, Conservative, Base and Optimistic Scenarios (USD Billion)
- Table 35.179 Approved Subcutaneous Biologics Market for Other Disorders, till 2035, Conservative, Base and Optimistic Scenarios (USD Billion)
- Table 35.180 Approved Subcutaneous Biologics Market: Distribution by Geographical Regions, Current year and 2035
- Table 35.181 Approved Subcutaneous Biologics Market in North America, till 2035, Conservative, Base and Optimistic Scenarios (USD Billion)
- Table 35.182 Approved Subcutaneous Biologics Market in Europe, till 2035, Conservative, Base and Optimistic Scenarios (USD Billion)
- Table 35.183 Approved Subcutaneous Biologics Market in Asia-Pacific, till 2035, Conservative, Base and Optimistic Scenarios (USD Billion)
- Table 35.184 Approved Subcutaneous Biologics Market in Middle East and North Africa, till 2035, Conservative, Base and Optimistic Scenarios (USD Billion)
- Table 35.185 Approved Subcutaneous Biologics Market in Latin America, till 2035, Conservative, Base and Optimistic Scenarios (USD Billion)
- Table 35.186 Actemra / RoActemra Sales Forecast, till 2035, Conservative, Base and Optimistic Scenarios (USD Billion)
- Table 35.187 Acthar Gel / ACTHar Sales Forecast, till 2035, Conservative, Base and Optimistic Scenarios (USD Billion)
- Table 35.188 AIMOVIG Sales Forecast, till 2035, Conservative, Base and Optimistic Scenarios (USD Billion)
- Table 35.189 AJOVY Sales Forecast, till 2035, Conservative, Base and Optimistic Scenarios (USD Billion)
- Table 35.190 AMVUTTRA Sales Forecast, till 2035, Conservative, Base and Optimistic Scenarios (USD Billion)
- Table 35.191 ARANESP / NESP Sales Forecast, till 2035, Conservative, Base and Optimistic Scenarios (USD Billion)
- Table 35.192 Basaglar / Abasaglar Sales Forecast, till 2035, Conservative, Base and Optimistic Scenarios (USD Billion)
- Table 35.193 BENLYSTA Sales Forecast, till 2035, Conservative, Base and Optimistic Scenarios (USD Billion)
- Table 35.194 Betaseron / Betaferon / EXTAVIA Sales Forecast, till 2035, Conservative, Base and Optimistic Scenarios (USD Billion)
- Table 35.195 CABLIVI Sales Forecast, till 2035, Conservative, Base and Optimistic Scenarios (USD Billion)
- Table 35.196 CIMZIA Sales Forecast, till 2035, Conservative, Base and Optimistic Scenarios (USD Billion)
- Table 35.197 COSENTYX Sales Forecast, till 2035, Conservative, Base and Optimistic Scenarios (USD Billion)
- Table 35.198 CRYSVITA Sales Forecast, till 2035, Conservative, Base and Optimistic Scenarios (USD Billion)
- Table 35.199 DARZALEX FASPRO / DARZALEX SC Sales Forecast, till 2035, Conservative, Base and Optimistic Scenarios (USD Billion)
- Table 35.200 DUPIXENT Sales Forecast, till 2035, Conservative, Base and Optimistic Scenarios (USD Billion)
- Table 35.201 EMGALITY Sales Forecast, till 2035, Conservative, Base and Optimistic Scenarios (USD Billion)
- Table 35.202 Enbrel Sales Forecast, till 2035, Conservative, Base and Optimistic Scenarios (USD Billion)
- Table 35.203 ENSPRYNG Sales Forecast, till 2035, Conservative, Base and Optimistic Scenarios (USD Billion)
- Table 35.204 ENTYVIO Sales Forecast, till 2035, Conservative, Base and Optimistic Scenarios (USD Billion)
- Table 35.205 Epogen / Procrit / Eprex Sales Forecast, till 2035, Conservative, Base and Optimistic Scenarios (USD Billion)
- Table 35.206 EVENITY Sales Forecast, till 2035, Conservative, Base and Optimistic Scenarios (USD Billion)
- Table 35.207 FASENRA Sales Forecast, till 2035, Conservative, Base and Optimistic Scenarios (USD Billion)
- Table 35.208 FIASP Sales Forecast, till 2035, Conservative, Base and Optimistic Scenarios (USD Billion)
- Table 35.209 Forteo / Forsteo Sales Forecast, till 2035, Conservative, Base and Optimistic Scenarios (USD Billion)
- Table 35.210 GATTEX / Revestive Sales Forecast till 2035, Conservative, Base and Optimistic Scenarios (USD Billion)
- Table 35.211 Genotropin Sales Forecast, till 2035, Conservative, Base and Optimistic Scenarios (USD Billion)
- Table 35.212 GIVLAARI Sales Forecast, till 2035, Conservative, Base and Optimistic Scenarios (USD Billion)
- Table 35.213 G-LASTA / Peglasta / Neulasta / GRAN Sales Forecast, till 2035, Conservative, Base and Optimistic Scenarios (USD Billion)
- Table 35.214 Gonal-F Sales Forecast, till 2035, Conservative, Base and Optimistic Scenarios (USD Billion)
- Table 35.215 HAEGARDA Sales Forecast, till 2035, Conservative, Base and Optimistic Scenarios (USD Billion)
- Table 35.216 HEMLIBRA Sales Forecast, till 2035, Conservative, Base and Optimistic Scenarios (USD Billion)
- Table 35.217 Herceptin SC / HERCEPTIN HYLECTA Sales Forecast, till 2035, Conservative, Base and Optimistic Scenarios (USD Billion)
- Table 35.218 Hizentra Sales Forecast, till 2035, Conservative, Base and Optimistic Scenarios (USD Billion)
- Table 35.219 Humalog Sales Forecast, till 2035, Conservative, Base and Optimistic Scenarios (USD Billion)
- Table 35.220 HUMIRA Sales Forecast, till 2035, Conservative, Base and Optimistic Scenarios (USD Billion)
- Table 35.221 Humulin Sales Forecast, till 2035, Conservative, Base and Optimistic Scenarios (USD Billion)
- Table 35.222 ILARIS Sales Forecast, till 2035, Conservative, Base and Optimistic Scenarios (USD Billion)
- Table 35.223 Kesimpta Sales Forecast, till 2035, Conservative, Base and Optimistic Scenarios (USD Billion)
- Table 35.224 KEVZARA Sales Forecast, till 2035, Conservative, Base and Optimistic Scenarios (USD Billion)
- Table 35.225 KINERET Sales Forecast, till 2035, Conservative, Base and Optimistic Scenarios (USD Billion)
- Table 35.226 LANTUS Sales Forecast, till 2035, Conservative, Base and Optimistic Scenarios (USD Billion)
- Table 35.227 LEQVIO Sales Forecast, till 2035, Conservative, Base and Optimistic Scenarios (USD Billion)
- Table 35.228 Mircera Sales Forecast, till 2035, Conservative, Base and Optimistic Scenarios (USD Billion)
- Table 35.229 MOUNJARO Sales Forecast, till 2035, Conservative, Base and Optimistic Scenarios (USD Billion)
- Table 35.230 NPLATE Sales Forecast, till 2035, Conservative, Base and Optimistic Scenarios (USD Billion)
- Table 35.231 Nucala Sales Forecast, till 2035, Conservative, Base and Optimistic Scenarios (USD Billion)
- Table 35.232 ORENCIA Sales Forecast, till 2035, Conservative, Base and Optimistic Scenarios (USD Billion)
- Table 35.233 OXLUMO Sales Forecast, till 2035, Conservative, Base and Optimistic Scenarios (USD Billion)
- Table 35.234 PALYNZIQ Sales Forecast, till 2035, Conservative, Base and Optimistic Scenarios (USD Billion)
- Table 35.235 Phesgo Sales Forecast, till 2035, Conservative, Base and Optimistic Scenarios (USD Billion)
- Table 35.236 PLEGRIDY Sales Forecast, till 2035, Conservative, Base and Optimistic Scenarios (USD Billion)
- Table 35.237 PRALUENT Sales Forecast, till 2035, Conservative, Base and Optimistic Scenarios (USD Billion)
- Table 35.238 Prolia / Pralia Sales Forecast, till 2035, Conservative, Base and Optimistic Scenarios (USD Billion)
- Table 35.239 Rebif Sales Forecast, till 2035, Conservative, Base and Optimistic Scenarios (USD Billion)
- Table 35.240 REBLOZYL Sales Forecast, till 2035, Conservative, Base and Optimistic Scenarios (USD Billion)
- Table 35.241 REKOVELLE Sales Forecast, till 2035, Conservative, Base and Optimistic Scenarios (USD Billion)
- Table 35.242 Repatha Sales Forecast, till 2035, Conservative, Base and Optimistic Scenarios (USD Billion)
- Table 35.243 RITUXAN HYCELA / MabThera SC Sales Forecast, till 2035, Conservative, Base and Optimistic Scenarios (USD Billion)
- Table 35.244 RYZODEG 70/30 Sales Forecast, till 2035, Conservative, Base and Optimistic Scenarios (USD Billion)
- Table 35.245 Saizen Sales Forecast, till 2035, Conservative, Base and Optimistic Scenarios (USD Billion)
- Table 35.246 Saxenda Sales Forecast, till 2035, Conservative, Base and Optimistic Scenarios (USD Billion)
- Table 35.247 SIMPONI Sales Forecast, till 2035, Conservative, Base and Optimistic Scenarios (USD Billion)
- Table 35.248 Skyrizi Sales Forecast, till 2035, Conservative, Base and Optimistic Scenarios (USD Billion)
- Table 35.249 SOLIQUA 100/33 Sales Forecast, till 2035, Conservative, Base and Optimistic Scenarios (USD Billion)
- Table 35.250 STELARA Sales Forecast, till 2035, Conservative, Base and Optimistic Scenarios (USD Billion)
- Table 35.251 Strensiq Sales Forecast, till 2035, Conservative, Base and Optimistic Scenarios (USD Billion)
- Table 35.252 TAKHZYRO Sales Forecast, till 2035, Conservative, Base and Optimistic Scenarios (USD Billion)
- Table 35.253 Taltz Sales Forecast, till 2035, Conservative, Base and Optimistic Scenarios (USD Billion)
- Table 35.254 Tecentriq Sales Forecast, till 2035, Conservative, Base and Optimistic Scenarios (USD Billion)
- Table 35.255 TEGSEDI Sales Forecast, till 2035, Conservative, Base and Optimistic Scenarios (USD Billion)
- Table 35.256 TEZSPIRE Sales Forecast, till 2035, Conservative, Base and Optimistic Scenarios (USD Billion)
- Table 35.257 Toujeo Sales Forecast, till 2035, Conservative, Base and Optimistic Scenarios (USD Billion)
- Table 35.258 TREMFYA Sales Forecast, till 2035, Conservative, Base and Optimistic Scenarios (USD Billion)
- Table 35.259 TRESIBA Sales Forecast, till 2035, Conservative, Base and Optimistic Scenarios (USD Billion)
- Table 35.260 Trulicity Sales Forecast, till 2035, Conservative, Base and Optimistic Scenarios (USD Billion)
- Table 35.261 Tysabri Sales Forecast, till 2035, Conservative, Base and Optimistic Scenarios (USD Billion)
- Table 35.262 Ultomiris Sales Forecast, till 2035, Conservative, Base and Optimistic Scenarios (USD Billion)
- Table 35.263 Victoza Sales Forecast, till 2035, Conservative, Base and Optimistic Scenarios (USD Billion)
- Table 35.264 Voxzogo Sales Forecast, till 2035, Conservative, Base and Optimistic Scenarios (USD Billion)
- Table 35.265 VYVGART Hytrulo Sales Forecast, till 2035, Conservative, Base and Optimistic Scenarios (USD Billion)
- Table 35.266 WAINUA Sales Forecast, till 2035, Conservative, Base and Optimistic Scenarios (USD Billion)
- Table 35.267 Xgeva / RANMARK Sales Forecast, till 2035, Conservative, Base and Optimistic Scenarios (USD Billion)
- Table 35.268 XOLAIR Sales Forecast, till 2035, Conservative, Base and Optimistic Scenarios (USD Billion)
- Table 35.269 XULTOPHY Sales Forecast, till 2035, Conservative, Base and Optimistic Scenarios (USD Billion)
- Table 35.270 ZEPBOUND Sales Forecast, till 2035, Conservative, Base and Optimistic Scenarios (USD Billion)
- Table 35.271 Approved Subcutaneous Biologics Market: Distribution by Leading Drug Developers (based on sales of subcutaneous biologics in the current year (USD Billion))
- Table 35.272 Approved Subcutaneous Biologics Market: Distribution by Leading Drug Developers (based on the forecasted sales of subcutaneous biologics in the year 2030 (USD Billion))
- Table 35.273 Approved Subcutaneous Biologics Market: Distribution by Leading Drug Developers (based on the forecasted sales of subcutaneous biologics in the year 2035 (USD Billion))
- Table 35.274 Global Subcutaneous Biologics Formulation Technologies Market, till 2035: Base Scenario (USD Million)
- Table 35.275 Global Subcutaneous Biologics Formulation Technologies Market, till 2035: Conservative Scenario (USD Million)
- Table 35.276 Global Subcutaneous Biologics Formulation Technologies Market, till 2035: Optimistic Scenario (USD Million)
- Table 35.277 Global Subcutaneous Formulation Technologies Market: Distribution by Fundamental Principle, Current year and 2035
- Table 35.278 Subcutaneous Formulation Technologies Market for Encapsulation Principle, till 2035, Conservative, Base and Optimistic Scenarios (USD Million)
- Table 35.279 Subcutaneous Formulation Technologies Market for Complex Formation Principle, till 2035, Conservative, Base and Optimistic Scenarios (USD Million)
- Table 35.280 Subcutaneous Formulation Technologies Market for Conjugation Principle, till 2035, Conservative, Base and Optimistic Scenarios (USD Million)
- Table 35.281 Subcutaneous Formulation Technologies Market for Amino-Acid Interaction Principle, till 2035, Conservative, Base and Optimistic Scenarios (USD Million)
- Table 35.282 Subcutaneous Formulation Technologies Market for Other Principles, till 2035, Conservative, Base and Optimistic Scenarios (USD Million)
- Table 35.283 Global Subcutaneous Formulation Technologies Market: Distribution by End User, Current year and 2035
- Table 35.284 Subcutaneous Formulation Technologies Market for Pharmaceutical and Biopharmaceutical Companies, till 2035, Conservative, Base and Optimistic Scenarios (USD Million)
- Table 35.285 Subcutaneous Formulation Technologies Market for Biotechnology Companies, till 2035, Conservative, Base and Optimistic Scenarios (USD Million)
- Table 35.286 Subcutaneous Formulation Technologies Market for MedTech Companies, till 2035, Conservative, Base and Optimistic Scenarios (USD Million)
- Table 35.287 Subcutaneous Formulation Technologies Market for Educational Institutes, till 2035, Conservative, Base and Optimistic Scenarios (USD Million)
- Table 35.288 Subcutaneous Formulation Technologies Market for Medical Equipment Manufacturers, till 2035, Conservative, Base and Optimistic Scenarios (USD Million)
- Table 35.289 Subcutaneous Formulation Technologies Market for Contract Drug Manufacturing Organizations, till 2035, Conservative, Base and Optimistic Scenarios (USD Million)
- Table 35.290 Subcutaneous Formulation Technologies Market for Other End Users, till 2035, Conservative, Base and Optimistic Scenarios (USD Million)
- Table 35.291 Global Subcutaneous Formulation Technologies Market: Distribution by Therapeutic Area, Current year and 2035
- Table 35.292 Subcutaneous Formulation Technologies Market for Oncological Disorders, till 2035, Conservative, Base and Optimistic Scenarios (USD Million)
- Table 35.293 Subcutaneous Formulation Technologies Market for Metabolic Disorders, till 2035, Conservative, Base and Optimistic Scenarios (USD Million)
- Table 35.294 Subcutaneous Formulation Technologies Market for Infectious Diseases, till 2035, Conservative, Base and Optimistic Scenarios (USD Million)
- Table 35.295 Subcutaneous Formulation Technologies Market for Ocular Disorders, till 2035, Conservative, Base and Optimistic Scenarios (USD Million)
- Table 35.296 Subcutaneous Formulation Technologies Market for Autoimmune Disorders, till 2035, Conservative, Base and Optimistic Scenarios (USD Million)
- Table 35.297 Subcutaneous Formulation Technologies Market for Neurological Disorders, till 2035, Conservative, Base and Optimistic Scenarios (USD Million)
- Table 35.298 Subcutaneous Formulation Technologies Market for Immunological Disorders, till 2035, Conservative, Base and Optimistic Scenarios (USD Million)
- Table 35.299 Subcutaneous Formulation Technologies Market for Other Disorders, till 2035, Conservative, Base and Optimistic Scenarios (USD Million)
- Table 35.300 Global Subcutaneous Formulation Technologies Market: Distribution by Key Geographical Regions, Current year and 2035
- Table 35.301 Subcutaneous Formulation Technologies Market in North America, till 2035, Conservative, Base and Optimistic Scenarios (USD Million)
- Table 35.302 Subcutaneous Formulation Technologies Market in Europe, till 2035, Conservative, Base and Optimistic Scenarios (USD Million)
- Table 35.303 Subcutaneous Formulation Technologies Market in Asia-Pacific, till 2035, Conservative, Base and Optimistic Scenario (USD Million)
- Table 35.304 Global Subcutaneous Formulation Technologies Market: Distribution by Payment Method Employed, Current year and 2035
- Table 35.305 Subcutaneous Formulation Technologies Market based on Milestone Payments, till 2035, Conservative, Base and Optimistic Scenarios (USD Million)
- Table 35.306 Subcutaneous Formulation Technologies Market based on Upfront Payments, till 2035, Conservative, Base and Optimistic Scenarios (USD Million)
- Table 35.307 Global Large Volume Wearable Injectors Market for Non-Insulin Drugs, till 2035: Base Scenario (USD Million) (By Value)
- Table 35.308 Global Large Volume Wearable Injectors Market for Non-Insulin Drugs, till 2035: Base Scenario (USD Million) (By Volume)
- Table 35.309 Global Large Volume Wearable Injectors Market for Insulin Drugs, till 2035: Base Scenario (USD Million) (By Value)
- Table 35.310 Global Large Volume Wearable Injectors Market for Insulin Drugs, till 2035: Base Scenario (USD Million) (By Volume)
- Table 35.311 Global Autoinjectors Market, till 2035: Base Scenario (USD Billion)
- Table 35.312 Global Needle-free Injection Systems Market, till 2035: Base Scenario (USD Million)
- Table 35.313 Global Novel Drug Reconstitution Systems Market, till 2035: Base Scenario (USD Million)
- Table 35.314 Global Prefilled Syringes Market, till 2035: Base Scenario (USD Million)
List of Figures
- Figure 2.1 Research Methodology: Project Methodology
- Figure 2.2 Research Methodology: Data Sources for Secondary Research
- Figure 3.1 Market Dynamics: Forecast Methodology
- Figure 3.2 Market Dynamics: Key Market Segmentation
- Figure 3.3 Market Dynamics: Robust Quality Control
- Figure 4.1 Lessons Learnt from Past Recessions
- Figure 5.1 Executive Summary: Approved Subcutaneous Biologics Landscape
- Figure 5.2 Executive Summary: Clinical-stage Subcutaneous Biologics Landscape
- Figure 5.3 Executive Summary: Subcutaneous Formulation Technology Landscape
- Figure 5.4 Executive Summary: Partnerships and Collaborations (Subcutaneous Formulation Technology)
- Figure 5.5 Executive Summary: Approved Subcutaneous Biologics Market Forecast and Opportunity Analysis
- Figure 5.6 Executive Summary: Subcutaneous Biologics Formulation Technologies Market Forecast and Opportunity Analysis
- Figure 6.1 Types of Biologically Derived Therapeutics
- Figure 6.2 Conversion from Intravenous to Subcutaneous Formulation: Key Points for Pharma Companies
- Figure 6.3 Process of Developing a Subcutaneous Formulation from Intravenous Product
- Figure 6.4 Subcutaneous Drug Delivery: Possible Routes of Administration for Large-Dose Biologics
- Figure 6.5 Landscape of Large Volume Subcutaneous Drug Delivery Devices
- Figure 6.6 Steps Involved in Subcutaneous Drug Delivery
- Figure 7.1 Approved Subcutaneous Biologics: Distribution by Initial Approval Year
- Figure 7.2 Approved Subcutaneous Biologics: Distribution by Type of Biologic
- Figure 7.3 Approved Subcutaneous Biologics: Distribution by Initial Approval Year and Type of Biologic
- Figure 7.4 Approved Subcutaneous Biologics: Distribution by Type of Therapy
- Figure 7.5 Approved Subcutaneous Biologics: Distribution by Route of Administration
- Figure 7.6 Approved Subcutaneous Biologics: Distribution by Method of Administration
- Figure 7.7 Approved Subcutaneous Biologics: Distribution by Dosing Frequency
- Figure 7.8 Approved Subcutaneous Biologics: Distribution by Concentration of Dose
- Figure 7.9 Approved Subcutaneous Biologics: Distribution by Target Disease Indication
- Figure 7.10 Approved Subcutaneous Biologics: Distribution by Therapeutic Area
- Figure 7.11 Approved Subcutaneous Biologics: Distribution by Type of Drug Delivery Device
- Figure 7.12 Approved Subcutaneous Biologics: Distribution by Year of Establishment
- Figure 7.13 Approved Subcutaneous Biologics: Distribution by Company Size
- Figure 7.14 Approved Subcutaneous Biologics: Distribution by Location of Headquarters (Region)
- Figure 7.15 Approved Subcutaneous Biologics: Distribution by Location of Headquarters (Country)
- Figure 7.16 Approved Subcutaneous Biologics: Distribution by Company Size and Location of Headquarters (Region)
- Figure 7.17 Most Active Developers: Distribution by Number of Approved Drugs
- Figure 8.1 BENLYSTA (Roche): Development History
- Figure 8.2 BENLYSTA (Roche): Success Protocol Analysis
- Figure 8.3 BESREMi (PharmaEssentia): Development History
- Figure 8.4 BESREMi (PharmaEssentia): Success Protocol Analysis
- Figure 8.5 COSENTYX (Novartis): Development History
- Figure 8.6 COSENTYX (Novartis): Success Protocol Analysis
- Figure 8.7 DARZALEX FASPRO (Halozyme): Development History
- Figure 8.8 DARZALEX FASPRO (Halozyme): Success Protocol Analysis
- Figure 8.9 DUPIXENT (Regeneron Pharmaceuticals): Development History
- Figure 8.10 DUPIXENT (Regeneron Pharmaceuticals): Success Protocol Analysis
- Figure 8.11 Enbrel (Amgen): Development History
- Figure 8.12 Enbrel (Amgen): Success Protocol Analysis
- Figure 8.13 HEMLIBRA (Roche): Development History
- Figure 8.14 HEMLIBRA (Roche): Success Protocol Analysis
- Figure 8.15 Prolia / Pralia (Amgen): Development History
- Figure 8.16 Prolia / Pralia (Amgen): Success Protocol Analysis
- Figure 8.17 STELARA (Janssen Biotech): Development History
- Figure 8.18 STELARA (Janssen Biotech): Success Protocol Analysis
- Figure 8.19 Trulicity (Eli Lilly): Development History
- Figure 8.20 Trulicity (Eli Lilly): Success Protocol Analysis
- Figure 8.21 Success Protocol Analysis: Conclusion
- Figure 9.1 Clinical-stage Subcutaneous Biologics: Distribution by Status of Development
- Figure 9.2 Clinical-stage Subcutaneous Biologics: Distribution by Type of Biologic
- Figure 9.3 Clinical-stage Subcutaneous Biologics: Distribution by Stage of Development and Type of Biologic
- Figure 9.4 Clinical-stage Subcutaneous Biologics: Distribution by Type of Therapy
- Figure 9.5 Clinical-stage Subcutaneous Biologics: Distribution by Mechanism of Action
- Figure 9.6 Clinical-stage Subcutaneous Biologics: Distribution by Dosing Frequency
- Figure 9.7 Clinical-stage Subcutaneous Biologics: Distribution by Drug Designation
- Figure 9.8 Clinical-stage Subcutaneous Biologics: Distribution by Target Disease Indication
- Figure 9.9 Clinical-stage Subcutaneous Biologics: Distribution by Therapeutic Area
- Figure 9.10 Clinical-stage Subcutaneous Biologics: Distribution by Stage of Development and Therapeutic Area
- Figure 9.11 Clinical-stage Subcutaneous Biologics: Distribution by Therapeutic Area and Type of Biologic
- Figure 9.12 Clinical-stage Subcutaneous Biologics: Distribution by Year of Establishment
- Figure 9.13 Clinical-stage Subcutaneous Biologics: Distribution by Company Size
- Figure 9.14 Clinical-stage Subcutaneous Biologics: Distribution by Location of Headquarters (Region)
- Figure 9.15 Clinical-stage Subcutaneous Biologics: Distribution by Company Size and Location of Headquarters (Region)
- Figure 9.16 Most Active Developers: Distribution by Number of Clinical-stage Drugs
- Figure 10.1 Subcutaneous Formulation Technologies: Distribution by Fundamental Principle
- Figure 10.2 Subcutaneous Formulation Technologies: Distribution by Type of Molecule
- Figure 10.3 Subcutaneous Formulation Technologies: Distribution by Route of Administration
- Figure 10.4 Subcutaneous Formulation Technologies: Distribution by Type of Molecule and Route of Administration
- Figure 10.5 Subcutaneous Formulation Technologies: Distribution by Therapeutic Area
- Figure 10.6 Subcutaneous Formulation Technologies: Distribution by Key Characteristics
- Figure 10.7 Subcutaneous Formulation Technology Developers: Distribution by Year of Establishment
- Figure 10.8 Subcutaneous Formulation Technology Developers: Distribution by Company Size
- Figure 10.9 Subcutaneous Formulation Technology Developers: Distribution by Location of Headquarters (Region)
- Figure 10.10 Subcutaneous Formulation Technology Developers: Distribution by Company Size and Location of Headquarters (Region)
- Figure 11.1 Technology Competitiveness Analysis: Subcutaneous Formulation Technology Developed by Companies based in North America (Peer Group I)
- Figure 11.2 Technology Competitiveness Analysis: Subcutaneous Formulation Technology Developed by Companies based in Europe (Peer Group II)
- Figure 11.3 Technology Competitiveness Analysis: Subcutaneous Formulation Technology Developed by Companies based in Asia-Pacific (Peer Group III)
- Figure 12.1 Pacira BioSciences: Annual Revenues, since 2020 (USD Million)
- Figure 12.2 Xeris Biopharma: Annual Revenues, since 2020 (USD Million)
- Figure 12.3 Adocia: Annual Revenues, since 2019 (EUR Million)
- Figure 12.4 Ascendis Pharma: Annual Revenues, since 2020 (EUR Million)
- Figure 12.5 Foresee Pharmaceuticals: Annual Revenues, since 2020 (TWD Million)
- Figure 13.1 Partnerships and Collaborations: Distribution by Year of Partnership
- Figure 13.2 Partnerships and Collaborations: Distribution by Type of Partnership
- Figure 13.3 Partnerships and Collaborations: Distribution by Year and Type of Partnership
- Figure 13.4 Partnerships and Collaborations: Distribution by Type of Partner
- Figure 13.5 Partnerships and Collaborations: Distribution by Location of Headquarters of Partner
- Figure 13.6 Partnerships and Collaborations: Distribution by Therapeutic Area
- Figure 13.7 Most Active Players: Distribution by Number of Partnerships
- Figure 13.8 Partnerships and Collaborations: Distribution by Region
- Figure 13.9 Partnerships and Collaborations: Distribution by International and Local Agreements
- Figure 13.10 Partnerships and Collaborations: Intracontinental and Intercontinental Agreements
- Figure 14.1 Different Types of Subcutaneous Drug Delivery Systems
- Figure 14.2 Large Volume Wearable Injectors: Distribution by Type of Device (By Drug Administered)
- Figure 14.3 Large Volume Wearable Injectors for Non-Insulin Drugs: Distribution by Status of Development
- Figure 14.4 Large Volume Wearable Injectors for Non-Insulin Drugs: Distribution by Type of Device
- Figure 14.5 Large Volume Wearable Injectors for Non-Insulin Drugs: Distribution by Usability
- Figure 14.6 Large Volume Wearable Injectors for Non-Insulin Drugs: Distribution by Type of Dose
- Figure 14.7 Large Volume Wearable Injectors for Non-Insulin Drugs: Distribution by Type of Drug Container
- Figure 14.8 Large Volume Wearable Injectors for Non-Insulin Drugs: Distribution by Mode of Drug Filling
- Figure 14.9 Large Volume Wearable Injectors for Non-Insulin Drugs: Distribution by Container Volume (mL)
- Figure 14.10 Large Volume Wearable Injectors for Non-Insulin Drugs: Distribution by Route of Administration
- Figure 14.11 Large Volume Wearable Injectors for Non-Insulin Drugs: Distribution by Mode of Injection
- Figure 14.12 Large Volume Wearable Injectors for Non-Insulin Drugs: Distribution by Mechanism of Action / Driving Force
- Figure 14.13 Large Volume Wearable Injectors for Non-Insulin Drugs: Distribution by Type of Technology
- Figure 14.14 Large Volume Wearable Injectors for Non-Insulin Drugs: Distribution by Availability of Connectivity Feature
- Figure 14.15 Large Volume Wearable Injectors for Non-Insulin Drugs: Distribution by Type of Compatible Drug
- Figure 14.16 Large Volume Wearable Injectors for Non-Insulin Drugs: Distribution by Compatibility with High Viscosity Drugs
- Figure 14.17 Large Volume Wearable Injectors for Non-Insulin Drugs: Distribution by Therapeutic Area
- Figure 14.18 Most Active Players: Distribution by Number of Large Volume Wearable Injectors for Non-Insulin Drugs
- Figure 14.19 Large Volume Wearable Injectors for Insulin Drugs: Distribution by Status of Development
- Figure 14.20 Large Volume Wearable Injectors for Insulin Drugs: Distribution by Type of Device
- Figure 14.21 Large Volume Wearable Injectors for Insulin Drugs: Distribution by Usability
- Figure 14.22 Large Volume Wearable Injectors for Insulin Drugs: Distribution by Type of Dose
- Figure 14.23 Large Volume Wearable Injectors for Insulin Drugs: Distribution by Mode of Drug Filling
- Figure 14.24 Large Volume Wearable Injectors for Insulin Drugs: Distribution by Container Volume (mL)
- Figure 14.25 Large Volume Wearable Injectors for Insulin Drugs: Distribution by Type of Diabetes
- Figure 14.26 Large Volume Wearable Injectors for Insulin Drugs: Distribution by Type of Combination Insulin
- Figure 14.27 Large Volume Wearable Injectors for Insulin Drugs: Distribution by Period of use (Days)
- Figure 14.28 Large Volume Wearable Injectors for Insulin Drugs: Distribution by Type of Device Control Feature
- Figure 14.29 Large Volume Wearable Injectors for Insulin Drugs: Distribution by Availability of Interoperable Device
- Figure 14.30 Large Volume Wearable Injectors for Insulin Drugs: Distribution by Availability of Continuous Glucose Monitoring (CGM) / Blood Glucose Meters (BGM) System
- Figure 14.31 Large Volume Wearable Injectors for Insulin Drugs: Distribution by Availability of Automatic Insulin Delivery (AID) / Artificial Pancreas
- Figure 14.32 Large Volume Wearable Injectors for Insulin Drugs: Distribution by Type of Automated Insulin Delivery (AID) Feature
- Figure 14.33 Large Volume Wearable Injectors for Insulin Drugs: Distribution by Availability of Connectivity Feature
- Figure 14.34 Large Volume Wearable Injectors for Insulin Drugs: Distribution by Waterproof Capabilities
- Figure 14.35 Leading Players: Analysis by Number of Large Volume Wearable Injectors for Insulin
- Figure 14.36 Large Volume Drug Device Combinations for Non-Insulin Drugs: Distribution by Status of Development
- Figure 14.37 Large Volume Drug Device Combinations for Non-Insulin Drugs: Distribution by Type of Device
- Figure 14.38 Large Volume Drug Device Combinations for Non-Insulin Drugs: Distribution by Usability
- Figure 14.39 Large Volume Drug Device Combinations for Non-Insulin Drugs: Distribution by Type of Dose
- Figure 14.40 Large Volume Drug Device Combinations for Non-Insulin Drugs: Distribution by Type of Drug Container
- Figure 14.41 Large Volume Drug Device Combinations for Non-Insulin Drugs: Distribution by Mode of Drug Filling
- Figure 14.42 Large Volume Drug Device Combinations for Non-Insulin Drugs: Distribution by Container Volume (mL)
- Figure 14.43 Large Volume Drug Device Combinations for Non-Insulin Drugs: Distribution by Route of Administration
- Figure 14.44 Large Volume Drug Device Combinations for Non-Insulin Drugs: Distribution by Mode of Injection
- Figure 14.45 Large Volume Drug Device Combinations for Non-Insulin Drugs: Distribution by Type of Compatible Drug
- Figure 14.46 Large Volume Drug Device Combinations for Non-Insulin Drugs: Distribution by Mechanism of Action / Driving Force
- Figure 14.47 Large Volume Drug Device Combinations for Non-Insulin Drugs: Distribution by Type of Technology
- Figure 14.48 Large Volume Drug Device Combinations for Non-Insulin Drugs: Distribution by Therapeutic Area
- Figure 14.49 Most Active Players: Distribution by Number of Drug Device Combinations for Non-Insulin Drugs
- Figure 14.50 Autoinjectors: Distribution by Stage of Development
- Figure 14.51 Autoinjectors: Distribution by Usability
- Figure 14.52 Autoinjectors: Distribution by Type of Primary Drug Container
- Figure 14.53 Autoinjectors: Distribution by Requirement of Needle
- Figure 14.54 Autoinjectors: Distribution by Volume of Container
- Figure 14.55 Autoinjectors: Distribution by Type of Dose Delivered
- Figure 14.56 Autoinjectors: Distribution by Route of Administration
- Figure 14.57 Autoinjectors: Distribution by Type of Actuation Mechanism
- Figure 14.58 Autoinjectors: Distribution by Type of Feedback Mechanism
- Figure 14.59 Autoinjectors: Distribution by Availability of Connectivity Feature
- Figure 14.60 Autoinjectors: Distribution by Target Indication
- Figure 14.61 Autoinjectors: Distribution by Type of Molecule Delivered
- Figure 14.62 Autoinjectors: Distribution by End User
- Figure 14.63 Most Active Players: Distribution by Number of Autoinjectors
- Figure 14.64 Pen Injectors: Distribution by Type of Dose
- Figure 14.65 Pen Injectors: Distribution by Storage Volume / Capacity (in ml)
- Figure 14.66 Pen Injectors: Distribution by Usability
- Figure 14.67 Most Active Players: Distribution by Number of Pen Injectors
- Figure 14.68 Needle-free Injection Systems: Distribution by Type of Actuation Mechanism
- Figure 14.69 Needle-free Injection Systems: Distribution by Route of Administration
- Figure 14.70 Needle-free Injection Systems: Distribution by Type of Formulation Administered
- Figure 14.71 Needle-free Injection Systems: Distribution by Type of Drug Delivered
- Figure 14.72 Needle-free Injection Systems: Distribution by Therapeutic Area
- Figure 14.73 Needle-free Injection Systems: Distribution by Usability
- Figure 14.74 Needle-free Injection Systems: Distribution by Type of Formulation Administered and Actuation Mechanism
- Figure 14.75 Novel Drug Reconstitution Systems: Distribution by Type of Device
- Figure 14.76 Novel Drug Reconstitution Systems: Distribution by Type of Chamber
- Figure 14.77 Novel Drug Reconstitution Systems: Distribution by Type of Device and Type of Chamber
- Figure 14.78 Novel Drug Reconstitution Systems: Distribution by Physical State of Drug
- Figure 14.79 Novel Drug Reconstitution Systems: Distribution by Container Fabrication Material
- Figure 14.80 Novel Drug Reconstitution Systems: Distribution by Volume of Container (mL)
- Figure 14.81 Novel Drug Reconstitution Systems: Distribution by Drug Class
- Figure 14.82 Novel Drug Reconstitution Systems: Distribution by Device Usability
- Figure 14.83 Novel Drug Reconstitution Systems: Distribution by Container Fabrication Material and Device Usability
- Figure 14.84 Novel Drug Reconstitution Systems: Distribution by Type of Pre-sterilized Device
- Figure 14.85 Novel Drug Reconstitution Systems: Distribution by Type of User-sterilized Device
- Figure 14.86 Novel Drug Reconstitution Systems: Distribution by Type of Type of Sterilization Equipment Used
- Figure 14.87 Most Active Players: Distribution by Number of Novel Drug Reconstitution Systems Manufactured
- Figure 14.88 Prefilled Syringes: Distribution by Type of Barrel Fabrication Material
- Figure 14.89 Prefilled Syringes: Distribution by Number of Barrel Chambers
- Figure 14.90 Prefilled Syringes: Distribution by Type of Needle System
- Figure 14.91 Prefilled Syringes: Distribution by Volume of Syringe
- Figure 14.92 Most Active Players: Distribution by Number of Prefilled Syringes
- Figure 14.93 Implants: Distribution by Phase of Development
- Figure 14.94 Implants: Distribution by Therapeutic Area
- Figure 14.95 Implants: Distribution by Implant Material
- Figure 14.96 Implants: Distribution by Treatment Duration
- Figure 14.97 Implants: Distribution by Type of Delivery System
- Figure 14.98 Most Active Players: Distribution by Number of Implants
- Figure 15.1 Product Competitiveness Analysis: Large Volume Wearable Injectors Developed by Players in North America for Non-Insulin Drugs
- Figure 15.2 Product Competitiveness Analysis: Large Volume Wearable Injectors Developed by Players in Europe for Non-Insulin Drugs
- Figure 15.3 Product Competitiveness Analysis: Large Volume Wearable Injectors Developed by Players in Asia and MENA for Non-Insulin Drugs
- Figure 15.4 Product Competitiveness Analysis: Large Volume Wearable Injectors Developed by Players in North America for Insulin Drugs
- Figure 15.5 Product Competitiveness Analysis: Large Volume Wearable Injectors Developed by Players in Europe for Insulin Drugs
- Figure 15.6 Product Competitiveness Analysis: Large Volume Wearable Injectors Developed by Players in Asia and MENA for Insulin Drugs
- Figure 15.7 Product Competitiveness Analysis: Large Volume Wearable Injectors Developed by Players in North America for Combination Products
- Figure 15.8 Product Competitiveness Analysis: Large Volume Wearable Injectors Developed by Players in Europe for Combination Product
- Figure 15.9 Product Competitiveness Analysis: Large Volume Wearable Injectors Developed by Players in MENA for Combination Products
- Figure 15.10 Product Competitiveness Analysis: Disposable Autoinjectors
- Figure 15.11 Product Competitiveness Analysis: Reusable Autoinjectors
- Figure 15.12 Product Competitiveness Analysis: Spring-based Needle-free Injection Systems
- Figure 15.13 Product Competitiveness Analysis: Gas-powered Needle-free Injection Systems
- Figure 15.14 Product Competitiveness Analysis: Other Needle-free Injection Systems
- Figure 15.15 Product Competitiveness Analysis: Glass Barrel Prefilled Syringes
- Figure 15.16 Product Competitiveness Analysis: Plastic Barrel Prefilled Syringes
- Figure 16.1 Subcutaneous Biologics SWOT Analysis: Overview
- Figure 16.2 SWOT Analysis: Harvey Ball Analysis
- Figure 16.3 Number of Biologics Approved by the USFDA, 2001-2021
- Figure 17.1 Global Approved Subcutaneous Biologics Market, till 2035 (USD Billion)
- Figure 17.2 Global Approved Subcutaneous Biologics Market, till 2035: Conservative Scenario (USD Billion)
- Figure 17.3 Global Approved Subcutaneous Biologics Market, till 2035: Optimistic Scenario (USD Billion)
- Figure 18.1 Approved Subcutaneous Biologics Market: Distribution by Type of Biologic, Current year and 2035
- Figure 18.2 Approved Subcutaneous Biologics Market for Antibodies, till 2035 (USD Billion)
- Figure 18.3 Approved Subcutaneous Biologics Market for Proteins, till 2035 (USD Billion)
- Figure 18.4 Approved Subcutaneous Biologics Market for Nucleotides, till 2035 (USD Billion)
- Figure 19.1 Approved Subcutaneous Biologics Market: Distribution by Type of Therapy, Current year and 2035
- Figure 19.2 Approved Subcutaneous Biologics Market for Monotherapy, till 2035 (USD Billion)
- Figure 19.3 Approved Subcutaneous Biologics Market for Combination Therapy, till 2035 (USD Billion)
- Figure 19.4 Approved Subcutaneous Biologics Market for Both Monotherapy and Combination Therapy, till 2035 (USD Billion)
- Figure 20.1 Approved Subcutaneous Biologics Market: Distribution by Method of Administration, Current year and 2035
- Figure 20.2 Approved Subcutaneous Biologics Market for Administration via Injection, till 2035 (USD Billion)
- Figure 20.3 Approved Subcutaneous Biologics Market for Administration via Infusion, till 2035 (USD Billion)
- Figure 20.4 Approved Subcutaneous Biologics Market for Administration via Both Injection and Infusion, till 2035 (USD Billion)
- Figure 21.1 Approved Subcutaneous Biologics Market: Distribution by Therapeutic Area, Current year and 2035
- Figure 21.2 Approved Subcutaneous Biologics Market for Autoimmune Disorders, till 2035 (USD Billion)
- Figure 21.3 Approved Subcutaneous Biologics Market for Metabolic Disorders, till 2035 (USD Billion)
- Figure 21.4 Approved Subcutaneous Biologics Market for Oncological Disorders, till 2035 (USD Billion)
- Figure 21.5 Approved Subcutaneous Biologics Market for Hematological Disorders, till 2035 (USD Billion)
- Figure 21.6 Approved Subcutaneous Biologics Market for Inflammatory Disorders, till 2035 (USD Billion)
- Figure 21.7 Approved Subcutaneous Biologics Market for Neurological Disorders, till 2035 (USD Billion)
- Figure 21.8 Approved Subcutaneous Biologics Market for Bone Disorders, till 2035 (USD Billion)
- Figure 21.9 Approved Subcutaneous Biologics Market for Other Disorders, till 2035 (USD Billion)
- Figure 22.1 Approved Subcutaneous Biologics Market: Distribution by Geographical Regions, Current year and 2035
- Figure 22.2 Approved Subcutaneous Biologics Market in North America, till 2035 (USD Billion)
- Figure 22.3 Approved Subcutaneous Biologics Market in Europe, till 2035 (USD Billion)
- Figure 22.4 Approved Subcutaneous Biologics Market in Asia-Pacific, till 2035 (USD Billion)
- Figure 22.5 Approved Subcutaneous Biologics Market in Middle East and North Africa, till 2035 (USD Billion)
- Figure 22.6 Approved Subcutaneous Biologics Market in Latin America, till 2035 (USD Billion)
- Figure 22.7 Penetration-Growth (P-G) Matrix: Geographical Regions
- Figure 23.1 Approved Subcutaneous Biologics Market: Actemra / RoActemra Sales Forecast, till 2035 (USD Billion)
- Figure 23.2 Approved Subcutaneous Biologics Market: Acthar Gel / ACTHar Sales Forecast, till 2035 (USD Billion)
- Figure 23.3 Approved Subcutaneous Biologics Market: AIMOVIG Sales Forecast, till 2035 (USD Billion)
- Figure 23.4 Approved Subcutaneous Biologics Market: AJOVY Sales Forecast, till 2035 (USD Billion)
- Figure 23.5 Approved Subcutaneous Biologics Market: AMVUTTRA Sales Forecast, till 2035 (USD Billion)
- Figure 23.6 Approved Subcutaneous Biologics Market: ARANESP / NESP Sales Forecast, till 2035 (USD Billion)
- Figure 23.7 Approved Subcutaneous Biologics Market: Basaglar / Abasaglar Sales Forecast, till 2035 (USD Billion)
- Figure 23.8 Approved Subcutaneous Biologics Market: BENLYSTA Sales Forecast, till 2035 (USD Billion)
- Figure 23.9 Approved Subcutaneous Biologics Market: Betaseron / Betaferon / EXTAVIA Sales Forecast, till 2035 (USD Billion)
- Figure 23.10 Approved Subcutaneous Biologics Market: CABLIVI Sales Forecast, till 2035 (USD Billion)
- Figure 23.11 Approved Subcutaneous Biologics Market: CIMZIA Sales Forecast, till 2035 (USD Billion)
- Figure 23.12 Approved Subcutaneous Biologics Market: COSENTYX Sales Forecast, till 2035 (USD Billion)
- Figure 23.13 Approved Subcutaneous Biologics Market: CRYSVITA Sales Forecast, till 2035 (USD Billion)
- Figure 23.14 Approved Subcutaneous Biologics Market: DARZALEX FASPRO / DARZALEX SC Sales Forecast, till 2035 (USD Billion)
- Figure 23.15 Approved Subcutaneous Biologics Market: DUPIXENT Sales Forecast, till 2035 (USD Billion)
- Figure 23.16 Approved Subcutaneous Biologics Market: EMGALITY Sales Forecast, till 2035 (USD Billion)
- Figure 23.17 Approved Subcutaneous Biologics Market: Enbrel Sales Forecast, till 2035 (USD Billion)
- Figure 23.18 Approved Subcutaneous Biologics Market: ENSPRYNG Sales Forecast, till 2035 (USD Billion)
- Figure 23.19 Approved Subcutaneous Biologics Market: ENTYVIO Sales Forecast, till 2035 (USD Billion)
- Figure 23.20 Approved Subcutaneous Biologics Market: Epogen / Procrit / Eprex Sales Forecast, till 2035 (USD Billion)
- Figure 23.21 Approved Subcutaneous Biologics Market: EVENITY Sales Forecast, till 2035 (USD Billion)
- Figure 23.22 Approved Subcutaneous Biologics Market: FASENRA Sales Forecast, till 2035 (USD Billion)
- Figure 23.23 Approved Subcutaneous Biologics Market: FIASP Sales Forecast, till 2035 (USD Billion)
- Figure 23.24 Approved Subcutaneous Biologics Market: Forteo / Forsteo Sales Forecast, till 2035 (USD Billion)
- Figure 23.25 Approved Subcutaneous Biologics Market: GATTEX / Revestive Sales Forecast, till 2035 (USD Billion)
- Figure 23.26 Approved Subcutaneous Biologics Market: Genotropin Sales Forecast, till 2035 (USD Billion)
- Figure 23.27 Approved Subcutaneous Biologics Market: GIVLAARI Sales Forecast, till 2035 (USD Billion)
- Figure 23.28 Approved Subcutaneous Biologics Market: G-LASTA / Peglasta / Neulasta / GRAN Sales Forecast, till 2035 (USD Billion)
- Figure 23.29 Approved Subcutaneous Biologics Market: Gonal-F Sales Forecast, till 2035 (USD Billion)
- Figure 23.30 Approved Subcutaneous Biologics Market: HAEGARDA Sales Forecast, till 2035 (USD Billion)
- Figure 23.31 Approved Subcutaneous Biologics Market: HEMLIBRA Sales Forecast, till 2035 (USD Billion)
- Figure 23.32 Approved Subcutaneous Biologics Market: Herceptin SC / HERCEPTIN HYLECTA Sales Forecast, till 2035 (USD Billion)
- Figure 23.33 Approved Subcutaneous Biologics Market: Hizentra Sales Forecast, till 2035 (USD Billion)
- Figure 23.34 Approved Subcutaneous Biologics Market: Humalog Sales Forecast, till 2035 (USD Billion)
- Figure 23.35 Approved Subcutaneous Biologics Market: HUMIRA Sales Forecast, till 2035 (USD Billion)
- Figure 23.36 Approved Subcutaneous Biologics Market: Humulin Sales Forecast, till 2035 (USD Billion)
- Figure 23.37 Approved Subcutaneous Biologics Market: ILARIS Sales Forecast, till 2035 (USD Billion)
- Figure 23.38 Approved Subcutaneous Biologics Market: Kesimpta Sales Forecast, till 2035 (USD Billion)
- Figure 23.39 Approved Subcutaneous Biologics Market: KEVZARA Sales Forecast, till 2035 (USD Billion)
- Figure 23.40 Approved Subcutaneous Biologics Market: KINERET Sales Forecast, till 2035 (USD Billion)
- Figure 23.41 Approved Subcutaneous Biologics Market: LANTUS Sales Forecast, till 2035 (USD Billion)
- Figure 23.42 Approved Subcutaneous Biologics Market: LEQVIO Sales Forecast, till 2035 (USD Billion)
- Figure 23.43 Approved Subcutaneous Biologics Market: Mircera Sales Forecast, till 2035 (USD Billion)
- Figure 23.44 Approved Subcutaneous Biologics Market: MOUNJARO Sales Forecast, till 2035 (USD Billion)
- Figure 23.45 Approved Subcutaneous Biologics Market: NPLATE Sales Forecast, till 2035 (USD Billion)
- Figure 23.46 Approved Subcutaneous Biologics Market: Nucala Sales Forecast, till 2035 (USD Billion)
- Figure 23.47 Approved Subcutaneous Biologics Market: ORENCIA Sales Forecast, till 2035 (USD Billion)
- Figure 23.48 Approved Subcutaneous Biologics Market: OXLUMO Sales Forecast, till 2035 (USD Billion)
- Figure 23.49 Approved Subcutaneous Biologics Market: PALYNZIQ Sales Forecast, till 2035 (USD Billion)
- Figure 23.50 Approved Subcutaneous Biologics Market: Phesgo Sales Forecast, till 2035 (USD Billion)
- Figure 23.51 Approved Subcutaneous Biologics Market: PLEGRIDY Sales Forecast, till 2035 (USD Billion)
- Figure 23.52 Approved Subcutaneous Biologics Market: PRALUENT Sales Forecast, till 2035 (USD Billion)
- Figure 23.53 Approved Subcutaneous Biologics Market: Prolia / Pralia Sales Forecast, till 2035 (USD Billion)
- Figure 23.54 Approved Subcutaneous Biologics Market: Rebif Sales Forecast, till 2035 (USD Billion)
- Figure 23.55 Approved Subcutaneous Biologics Market: REBLOZYL Sales Forecast, till 2035 (USD Billion)
- Figure 23.56 Approved Subcutaneous Biologics Market: REKOVELLE Sales Forecast, till 2035 (USD Billion)
- Figure 23.57 Approved Subcutaneous Biologics Market: Repatha Sales Forecast, till 2035 (USD Billion)
- Figure 23.58 Approved Subcutaneous Biologics Market: RITUXAN HYCELA / MabThera SC Sales Forecast, till 2035 (USD Billion)
- Figure 23.59 Approved Subcutaneous Biologics Market: RYZODEG 70/30 Sales Forecast, till 2035 (USD Billion)
- Figure 23.60 Approved Subcutaneous Biologics Market: Saizen Sales Forecast, till 2035 (USD Billion)
- Figure 23.61 Approved Subcutaneous Biologics Market: Saxenda Sales Forecast, till 2035 (USD Billion)
- Figure 23.62 Approved Subcutaneous Biologics Market: SIMPONI Sales Forecast, till 2035 (USD Billion)
- Figure 23.63 Approved Subcutaneous Biologics Market: Skyrizi Sales Forecast, till 2035 (USD Billion)
- Figure 23.64 Approved Subcutaneous Biologics Market: SOLIQUA 100/33 Sales Forecast, till 2035 (USD Billion)
- Figure 23.65 Approved Subcutaneous Biologics Market: STELARA Sales Forecast, till 2035 (USD Billion)
- Figure 23.66 Approved Subcutaneous Biologics Market: Strensiq Sales Forecast, till 2035 (USD Billion)
- Figure 23.67 Approved Subcutaneous Biologics Market: TAKHZYRO Sales Forecast, till 2035 (USD Billion)
- Figure 23.68 Approved Subcutaneous Biologics Market: Taltz Sales Forecast, till 2035 (USD Billion)
- Figure 23.69 Approved Subcutaneous Biologics Market: Tecentriq Sales Forecast, till 2035 (USD Billion)
- Figure 23.70 Approved Subcutaneous Biologics Market: TEGSEDI Sales Forecast, till 2035 (USD Billion)
- Figure 23.71 Approved Subcutaneous Biologics Market: TEZSPIRE Sales Forecast, till 2035 (USD Billion)
- Figure 23.72 Approved Subcutaneous Biologics Market: Toujeo Sales Forecast, till 2035 (USD Billion)
- Figure 23.73 Approved Subcutaneous Biologics Market: TREMFYA Sales Forecast, till 2035 (USD Billion)
- Figure 23.74 Approved Subcutaneous Biologics Market: TRESIBA Sales Forecast, till 2035 (USD Billion)
- Figure 23.75 Approved Subcutaneous Biologics Market: Trulicity Sales Forecast, till 2035 (USD Billion)
- Figure 23.76 Approved Subcutaneous Biologics Market: Tysabri Sales Forecast, till 2035 (USD Billion)
- Figure 23.77 Approved Subcutaneous Biologics Market: Ultomiris Sales Forecast, till 2035 (USD Billion)
- Figure 23.78 Approved Subcutaneous Biologics Market: Victoza Sales Forecast, till 2035 (USD Billion)
- Figure 23.79 Approved Subcutaneous Biologics Market: Voxzogo Sales Forecast, till 2035 (USD Billion)
- Figure 23.80 Approved Subcutaneous Biologics Market: VYVGART Hytrulo Sales Forecast, till 2035 (USD Billion)
- Figure 23.81 Approved Subcutaneous Biologics Market: WAINUA Sales Forecast, till 2035 (USD Billion)
- Figure 23.82 Approved Subcutaneous Biologics Market: Xgeva / RANMARK Sales Forecast, till 2035 (USD Billion)
- Figure 23.83 Approved Subcutaneous Biologics Market: XOLAIR Sales Forecast, till 2035 (USD Billion)
- Figure 23.84 Approved Subcutaneous Biologics Market: XULTOPHY Sales Forecast, till 2035 (USD Billion)
- Figure 23.85 Approved Subcutaneous Biologics Market: ZEPBOUND Sales Forecast, till 2035 (USD Billion)
- Figure 24.1 Approved Subcutaneous Biologics Market: Distribution by Leading Drug Developers (based on the forecasted sales of subcutaneous biologics in the current year (USD Billion))
- Figure 24.2 Approved Subcutaneous Biologics Market: Distribution by Leading Drug Developers (based on the forecasted sales of subcutaneous biologics in the year 2030 (USD Billion))
- Figure 24.3 Approved Subcutaneous Biologics Market: Distribution by Leading Drug Developers (based on the forecasted sales of subcutaneous biologics in the year 2035 (USD Billion))
- Figure 25.1 Licensing Agreements: Distribution of Financial Components
- Figure 25.2 Licensing Agreements: Illustrative Scenario based Opportunity Estimation
- Figure 25.3 Global Subcutaneous Biologics Formulation Technologies Market, till 2035 (USD Million)
- Figure 25.4 Global Subcutaneous Biologics Formulation Technologies Market, till 2035: Conservative Scenario (USD Million)
- Figure 25.5 Global Subcutaneous Biologics Formulation Technologies Market, till 2035: Optimistic Scenario (USD Million)
- Figure 26.1 Subcutaneous Biologics Formulation Technologies Market: Distribution by Fundamental Principle, Current year and 2035
- Figure 26.2 Subcutaneous Biologics Formulation Technologies Market for Encapsulation Principle, till 2035 (USD Million)
- Figure 26.3 Subcutaneous Biologics Formulation Technologies Market for Complex Formation Principle, till 2035 (USD Million)
- Figure 26.4 Subcutaneous Biologics Formulation Technologies Market for Conjugation Principle, till 2035 (USD Million)
- Figure 26.5 Subcutaneous Biologics Formulation Technologies Market for Amino-acid Interaction Principle, till 2035 (USD Million)
- Figure 26.6 Subcutaneous Biologics Formulation Technologies Market for Other Principles, till 2035 (USD Million)
- Figure 27.1 Subcutaneous Biologics Formulation Technologies Market: Distribution by End-user, Current year and 2035
- Figure 27.2 Subcutaneous Biologics Formulation Technologies Market for Pharmaceutical and Biopharmaceutical Companies, till 2035 (USD Million)
- Figure 27.3 Subcutaneous Biologics Formulation Technologies Market for Biotechnology Companies, till 2035 (USD Million)
- Figure 27.4 Subcutaneous Biologics Formulation Technologies Market for MedTech Companies, till 2035 (USD Million)
- Figure 27.5 Subcutaneous Biologics Formulation Technologies Market for Educational Institutes, till 2035 (USD Million)
- Figure 27.6 Subcutaneous Biologics Formulation Technologies Market for Medical Equipment Manufacturers, till 2035 (USD Million)
- Figure 27.7 Subcutaneous Biologics Formulation Technologies Market for Contract Drug Manufacturing Organizations, till 2035 (USD Million)
- Figure 27.8 Subcutaneous Biologics Formulation Technologies Market for Other End-users, till 2035 (USD Million)
- Figure 28.1 Subcutaneous Biologics Formulation Technologies Market: Distribution by Therapeutic Area, Current year and 2035
- Figure 28.2 Subcutaneous Biologics Formulation Technologies Market for Oncological Disorders, till 2035 (USD Million)
- Figure 28.3 Subcutaneous Biologics Formulation Technologies Market for Metabolic Disorders, till 2035 (USD Million)
- Figure 28.4 Subcutaneous Biologics Formulation Technologies Market for Infectious Diseases, till 2035 (USD Million)
- Figure 28.5 Subcutaneous Biologics Formulation Technologies Market for Ocular Disorders, till 2035 (USD Million)
- Figure 28.6 Subcutaneous Biologics Formulation Technologies Market for Autoimmune Disorders, till 2035 (USD Million)
- Figure 28.7 Subcutaneous Biologics Formulation Technologies Market for Neurological Disorders, till 2035 (USD Million)
- Figure 28.8 Subcutaneous Biologics Formulation Technologies Market for Immunological Disorders, till 2035 (USD Million)
- Figure 28.9 Subcutaneous Biologics Formulation Technologies Market for Other Disorders, till 2035 (USD Million)
- Figure 29.1 Subcutaneous Biologics Formulation Technologies Market: Distribution by Key Geographical Regions, Current year and 2035
- Figure 29.2 Subcutaneous Biologics Formulation Technologies Market in North America, till 2035 (USD Million)
- Figure 29.3 Subcutaneous Biologics Formulation Technologies Market in Europe, till 2035 (USD Million)
- Figure 29.4 Subcutaneous Biologics Formulation Technologies Market in Asia-Pacific, till 2035 (USD Million)
- Figure 29.5 Penetration-Growth (P-G) Matrix: Key Geographical Regions
- Figure 30.1 Subcutaneous Biologics Formulation Technologies Market: Distribution by Payment Method Employed, Current year and 2035
- Figure 30.2 Subcutaneous Biologics Formulation Technologies Market based on Milestone Payments, till 2035 (USD Million)
- Figure 30.3 Subcutaneous Biologics Formulation Technologies Market based on Upfront Payments, till 2035 (USD Million)
- Figure 32.1 Global Large Volume Wearable Injectors Market for Non-Insulin Drugs, till 2035 (USD Million)
- Figure 32.2 Global Large Volume Wearable Injectors Market for Non-Insulin Drugs, till 2035 (Million Units)
- Figure 32.3 Global Large Volume Wearable Injectors Market for Insulin Drugs, till 2035 (USD Million)
- Figure 32.4 Global Large Volume Wearable Injectors Market for Insulin Drugs, till 2035 (Million Units)
- Figure 32.5 Global Autoinjectors Market, till 2035 (USD Billion)
- Figure 32.6 Global Needle-free Injection Systems Market, till 2035 (USD Million)
- Figure 32.7 Global Novel Drug Reconstitution Systems Market, till 2035 (USD Billion)
- Figure 32.8 Global Prefilled Syringes Market, till 2035 (USD Million)
- Figure 33.1 Concluding Remarks: Approved Subcutaneous Biologics Landscape
- Figure 33.2 Concluding Remarks: Clinical-stage Subcutaneous Biologics Landscape
- Figure 33.3 Concluding Remarks: Technology Landscape
- Figure 33.4 Concluding Remarks: Partnerships and Collaborations (Subcutaneous Formulation Technology)
- Figure 33.5 Concluding Remarks: Approved Subcutaneous Biologics Market Forecast and Opportunity Analysis
- Figure 33.6 Concluding Remarks: Subcutaneous Biologics Formulation Technologies Market Forecast and Opportunity Analysis
 全球生物除臭設備市場(按設備類型、氣味類型、空氣流量、應用和終端用戶產業分類)預測(2026-2032)
 先進生物製品製造市場分析及預測(至2035年):類型、產品類型、服務、技術、應用、最終用戶、製程、組件及實施方案生物製藥市場分析及預測(至2035年):依類型、產品類型、服務、技術、應用、最終用戶、製程、設備、材料類型及部署模式分類
 全球下一代邏輯擴展技術市場:預測(至2034年)-按材料、節點尺寸、技術、應用、最終用戶和地區分類的分析生技藥品CXO服務市場按服務模式、治療領域、臨床階段、應用和最終用戶分類,全球預測(2026-2032年)生物製藥和生物相似藥高階主管服務市場(按服務、治療領域、實施模式、合作模式和最終用戶分類),全球預測,2026-2032年
 日本生物製藥市場報告:按原料、產品、疾病、產量和地區分類(2026-2034年)
 癌症生物療法:科技與全球市場
 生物製劑灌裝及包裝製造市場:產業趨勢及全球預測(至 2035 年)-依初級包裝類型、生物製劑類型、企業規模、治療領域、最終用戶、公司類型、公司規模及地區劃分生技藥品外包市場按服務類型、治療領域、製程步驟、外包模式和最終用戶分類-2025-2032年全球預測