


 |
市場調查報告書
商品編碼
1830065
緩衝液製作市場:2035年前的產業趨勢和全球預測 - 各業務規模,各系統配置要素類型,各緩衝液製劑,各分子,適合生技藥品,緩衝液包裝,各地區,各主要企業Buffer Preparation Market: Industry Trends and Global Forecasts, Till 2035 - Distribution by Scale of Operation, Type of System Component, Buffer Formulation, Molecule, Compatible Biologic, Buffer Packaging, Geographical Regions and Leading Players |
||||||
緩衝液製備市場:概覽
緩衝液製備市場目前估價85.8億美元,預估至2035年將達179.6億美元,預測期間內複合年增長率為7.8%。
市場區隔包括基於以下參數的市場規模和機會分析:
事業規模
- 前臨床/臨床
- 商業
系統配置要素類型
- 一次性緩衝液混合/製備設備
- 可重複使用緩衝液混合/製備設備
緩衝液製劑類型
- 液體
- 粉末
分子類型
- 低分子
- 生技藥品
適合生技藥品
- 抗體
- 疫苗
- 蛋白質/肽
- 細胞·基因治療藥
- 其他的生技藥品
緩衝液包裝類型
- 抗體
- 疫苗
- 蛋白質/肽
- 細胞·基因治療藥
- 其他的生技藥品
地區
- 北美
- 歐洲
- 亞太地區
- 南美
- 中東·北非
緩衝液製造市場成長與趨勢
緩衝液是用於在製藥過程中調節pH值的水溶液,對於維持小分子和生物製劑的穩定性至關重要。此外,緩衝液在許多上游和下游生物過程中發揮各種作用,包括提高產品產量、確保一致的純化條件以及在保持最終產品功能特性的同時保持其穩定性。
傳統的藥物緩衝液製造面臨許多影響製造過程的課題,導致生產成本增加以及最終產品批次間不一致。這需要在製造工廠中實施創新的緩衝液製造系統,而這些系統通常需要複雜的製程、有限的資源,或將藥物緩衝液的生產外包給外部服務提供者。此外,外包藥物緩衝液生產可以最大限度地減少對大型設施和大量資本投資的需求,並簡化與緩衝液生產和儲存相關的複雜物流。近年來,緩衝液製造和緩衝液管理系統迅速發展。這些系統積極融入尖端技術,以在整個下游加工過程中保持緩衝液的生理狀態。此外,緩衝液需求的不斷增長以及傳統緩衝液生產面臨的課題預計將在未來幾年推動緩衝液生產市場的擴張。
緩衝液製備市場的關鍵洞見
本報告深入探討了緩衝液製備市場的現狀,並識別了產業內的潛在成長機會。報告的主要發現包括:
- 目前,市面上約有 60 種緩衝液生產系統可用於穩定生物製藥中的藥物成分。
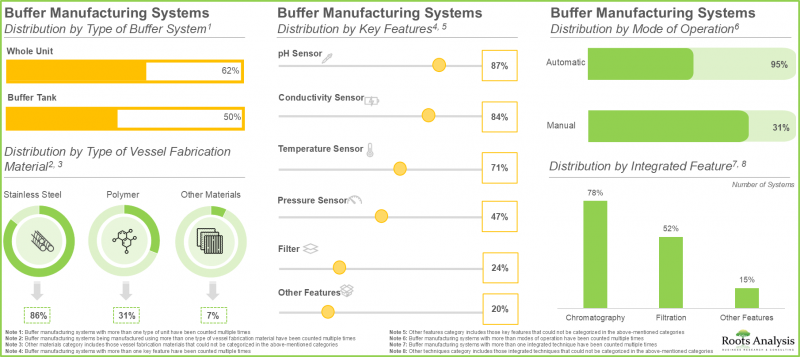
- 值得注意的是,95% 的緩衝液製備系統都是自動運作的,可以控制 pH、電導率、溫度和壓力等各種參數。
- 為了獲得競爭優勢並遵守不斷發展的行業標準,利害關係人正在積極提升現有能力並強化產品組合。
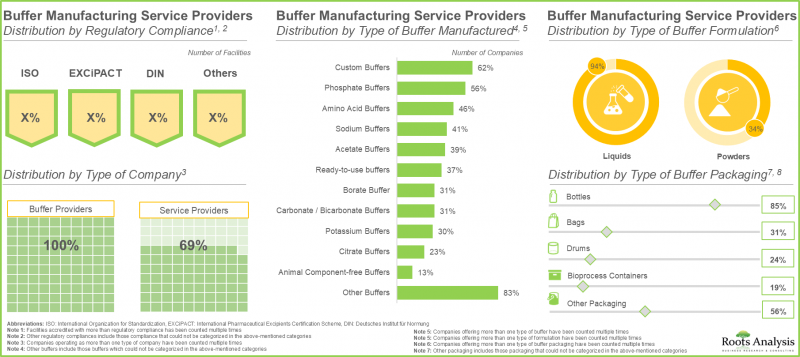
- 超過 70 家公司提供各種包裝形式的緩衝液製劑生產服務,其中近 55% 的緩衝液製劑服務供應商位於北美。
- 該領域超過 60% 的公司生產客製化緩衝液,其中大多數緩衝液採用液體瓶裝。
- 為了獲得競爭優勢並滿足不斷發展的產業需求,利害關係人正在積極提升現有的緩衝液製劑生產能力,同時改善其服務組合。
- 從近期的合作活動可以看出,利害關係人對緩衝液製劑生產的興趣。事實上,近 20% 的交易是在過去兩年內簽署的。
- 預計未來幾年全球緩衝液生產系統市場將穩定成長,其中商業規模的緩衝液生產系統將佔大部分市場佔有率。
- 緩衝液生產服務市場以具有廣泛治療應用的小分子化合物為主。
緩衝液製備市場的主要細分市場
商業規模佔整個緩衝液製備市場的最大佔有率
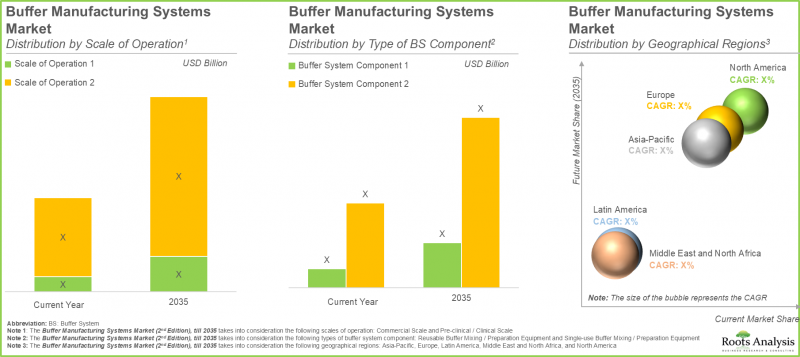
全球市場分為各種規模,包括臨床前/臨床和商業規模。預計今年商業規模細分市場將佔緩衝液生產系統市場的最大佔有率(85%),這一趨勢預計在未來幾年將保持不變。這得益於生物製藥產品線的不斷擴大、研發投入的大幅增加以及技術的不斷發展,這些因素推動了製藥業對先進緩衝液製備解決方案的需求。
可重複使用緩衝液混合/製備設備引領緩衝液製備市場
依系統組件類型,全球緩衝液生產系統市場分為一次性緩衝液混合/製備設備和可重複使用緩衝液混合/製備設備。根據估計和預測,可重複使用緩衝液混合/製備設備市場目前佔整體市場的大部分佔有率(80%),並且在預測期內可能保持相對較快的成長速度。
液體製劑佔最大佔有率
本部分涵蓋了全球各種緩衝液製劑(包括液體和粉末製劑)服務市場的分佈。目前,液體製劑領域佔最大佔有率(約70%),預計未來這一趨勢將保持不變。這是因為液體緩衝液具有批次間一致性,最終最大限度地降低了緩衝液生產中人為錯誤的可能性。
小分子製劑今年將佔最大佔有率
本部分揭示了全球不同類型分子(包括小分子和生物製劑)服務市場的分佈。目前,小分子製劑領域佔最大佔有率(約75%),預計這一趨勢將持續下去。這是由小分子廣泛的治療潛力和慢性病發病率的上升所推動的,這推動了對更多藥品生產的需求,從而增加了生產過程中對緩衝液的需求。
目前,抗體領域佔了緩衝液市場的大部分佔有率。
本部分揭示了全球緩衝液製造服務市場按適用生物製劑類型(包括抗體、疫苗、蛋白質/勝肽、細胞/基因療法和其他生物製劑)的分佈。今年,抗體領域預計將佔整體市場的最大佔有率(約55%),預計這一趨勢將持續下去。預計細胞和基因治療領域在整個預測期內的複合年增長率將顯著提高(19.5%)。
瓶裝佔大部分市場佔有率
全球服務市場細分為各種類型的包裝,例如瓶裝、袋裝、生物加工容器、桶裝和其他包裝。瓶裝目前佔了整體市場佔有率的大部分(約40%),未來很可能會繼續佔主導地位。
北美佔大部分市佔率
本部分將聚焦在緩衝材料製造業在北美、歐洲、亞太、中東和北非以及拉丁美洲等不同地區的規模分佈。根據我們的預測,北美目前佔整體市場佔有率的大部分(約40%),而這一趨勢在未來不太可能改變。值得注意的是,北美公司正在逐步採用緩衝材料製造系統,以降低生產成本、提高效率並確保高品質的批量產品。此外,一些公司正在為實驗室和工業客戶提供客製化緩衝材料製備服務。此外,預計亞太市場在預測期內將以較高的複合年增長率(8%)成長。
緩衝液製作市場參與企業案例
- Asahi Kasei
- Avantor
- Canvax
- Danaher
- GE Healthcare
- HOPAX
- Merck
- Prepared Biologics
- Sartorius
- Sepragen
- Thermo Fisher Scientific
- ZETA
緩衝液製備市場研究報告
- 市場規模和機會分析:本報告對緩衝液製備市場進行了詳細分析,重點關注關鍵細分市場,例如[A] 企業規模、[B] 緩衝系統組件類型、[C] 緩衝劑配方類型、[D] 分子類型、[E] 兼容生物製劑類型、[F] 緩衝劑配方類型和[G] 地區。
- 緩衝液製造系統市場格局:基於多項參數對緩衝液製造系統當前市場格局進行深入評估,例如 A] 緩衝液系統類型、[B] 操作模式、[C] 容器製造材料類型、[D] 系統多功能性、[E] 主要特性、[F] 整合技術、[G] 緩衝液製造製程、[H] 生物加工方法。
- 產品競爭力分析:基於多項相關參數對緩衝液製造系統進行全面的競爭力分析,例如 A] 公司實力、[B] 產品競爭力。
- 公司簡介:北美、歐洲和亞太地區知名緩衝液製造系統和服務供應商的詳細簡介,包括 A] 公司概況、[B] 財務資訊(如有)、[C] 緩衝液製造系統產品組合、[D] 最新發展和 [E] 未來展望。
- 緩衝液製造服務供應商的市場格局:基於多項參數對緩衝液製造服務供應商的當前市場格局進行詳細評估,包括:[A] 成立年份、[A] 公司規模、[B] 總部位置、[C] 工廠位置、[D] 監管狀態、[E] 公司類型、[F] 總部位置、[C] 工廠位置、[D] 監管狀態、[E] 公司類型、[F] 生產的緩衝液類型、[G] 液型配方[應用領域以及 [K] 提供的附加服務。
- 競爭分析:A] 公司優勢、[B]基於多項相關參數,對緩衝材料製造服務提供者進行詳細的競爭分析,包括[A]服務組合實力和[C]應用領域。
- 合作關係與合作:基於多項參數,對緩衝材料製造業利害關係人之間達成的合作關係與合作進行深入分析,包括[A]合作年份、[B]合作類型和[C]最活躍的參與者。
目錄
第1章 序文
第2章 調查手法
第3章 市場動態
- 章概要
- 預測調查手法
- 市場評估組成架構
- 預測工具和技巧
- 重要的考慮事項
- 限制事項
第4章 宏觀經濟指標
- 章概要
- 市場動態
- 結論
第5章 摘要整理
第6章 簡介
- 章概要
- 緩衝液製造概要
- 緩衝液製造伴隨的課題
- 緩衝液製造的外包的優點
- 外包合作夥伴選擇時應該考慮的重點
- 未來展望
第7章 市場形勢製造系統
- 章概要
- 緩衝液製造系統:市場形勢
- 緩衝液製造系統供應商的形勢
第8章 產品競爭力分析
- 章概要
- 前提主要的參數
- 調查手法
- 緩衝液製造系統:產品競爭力分析
- 北美公司提供的緩衝器製造系統
- 歐洲公司提供的緩衝器製造系統
- 亞太公司提供的緩衝器製造系統
第9章 企業簡介緩衝液製造系統供應商
- 章概要
- Asahi Kasei
- Danaher
- Merck
- Sepragen
- Thermo Fisher Scientific
- ZETA
第10章 市場形勢:緩衝液製造服務供應商
- 章概要
- 緩衝液製造服務供應商:市場形勢
第11章 企業競爭力分析
- 章概要
- 前提主要的參數
- 調查手法
- 企業競爭力分析
- 北美的緩衝液製造服務供應商
- 歐洲的緩衝液製造服務供應商
- 亞太地區上的緩衝液製造服務供應商
第12章 企業簡介緩衝液製造服務供應商
- 章概要
- Avantor
- Canvax
- GE Healthcare
- HOPAX
- Prepared Biologics
- Sartorius
第13章 夥伴關係和合作
- 章概要
- 夥伴關係模式
- 緩衝液製造解決方案:夥伴關係和合作
第14章 全球緩衝液製造系統市場
- 章概要
- 主要的前提與調查手法
- 全球緩衝液製造系統市場,歷史的趨勢(2021年以後)及預測(到2035年)
- 主要的市場區隔
第15章 緩衝液製造系統市場(各產業規模)
第16章 緩衝液製造系統市場(各緩衝液系統配置要素類型)
第17章 緩衝液製造系統市場(各地區)
第18章 市場機會分析:北美
第19章 市場機會分析:歐洲
第20章 市場機會分析:亞太地區
第21章 市場機會分析:中東·北非
第22章 市場機會分析:南美
第23章 全球緩衝液製造服務市場
- 章概要
- 主要的前提與調查手法
- 全球緩衝液製造服務市場,歷史的趨勢(2022年以後)及預測(到2035年)
- 主要的市場區隔
第24章 緩衝液製造系統市場(各產業規模)
第25章 緩衝液製造系統市場(緩衝液製劑各類型)
第26章 緩衝液製造系統市場(各分子類型)
第27章 緩衝液製造系統市場(適合生技藥品各類型)
第28章 緩衝液製造系統市場(各緩衝液包裝形式)
第29章 緩衝液製造系統市場(各地區)
第30章 結論
第31章 附錄1:表格形式資料
第32章 附錄2:企業·團體一覽
Buffer Preparation Market: Overview
As per Roots Analysis, the buffer preparation market size is currently valued at USD 8.58 billion and is projected to reach 17.96 billion by 2035, growing at a CAGR of 7.8% during the forecast period.
The market sizing and opportunity analysis has been segmented across the following parameters:
Scale of Operation
- Preclinical / Clinical
- Commercial
Type of System Component
- Single-use Buffer Mixing / Preparation Equipment
- Reusable Buffer Mixing / Preparation Equipment
Type of Buffer Formulation
- Liquid
- Powder
Type of Molecule
- Small Molecules
- Biologics
Type of Compatible Biologic
- Antibodies
- Vaccines
- Proteins / Peptides
- Cell and Gene Therapies
- Other Biologics
Type of Buffer Packaging
- Antibodies
- Vaccines
- Proteins / Peptides
- Cell and Gene Therapies
- Other Biologics
Geographical Regions
- North America
- Europe
- Asia-Pacific
- Latin America
- Middle East and North Africa
Buffer Manufacturing Market: Growth and Trends
Buffers are water-based solutions utilized to regulate pH during the drug production process and are essential for preserving the stability of both small molecules and biologics. Additionally, buffers play a role in numerous upstream and downstream bioprocesses for different purposes, including improving the yield of target products, ensuring consistent purification conditions, and stabilizing the end product while preserving its functional properties.
Traditional pharmaceutical buffer production face numerous challenges that affect their manufacturing processes, leading to elevated production expenses and inconsistencies between batches of final products. Thus, the incorporation of an innovative buffer production system in their manufacturing plants is necessary, owing to intricate processes and limited resources or the need to contract pharmaceutical buffer production to external service providers. Moreover, outsourcing the production of pharmaceutical buffers minimizes the requirement for large facilities and significant capital investment, while also simplifying the intricate logistics associated with buffer production and storage. In the past few years, the production of buffers and buffer management systems has quickly become popular. These systems actively incorporate cutting-edge technologies to preserve the physiological conditions of buffers throughout downstream processes. Additionally, the increasing need for buffers and the difficulties related to conventional buffer production are expected to propel market expansion in buffer manufacturing in the years to come.
Buffer Preparation Market: Key Insights
The report delves into the current state of the buffer preparation market and identifies potential growth opportunities within the industry. Some key findings from the report include:
- Around 60 buffer manufacturing systems are currently available in the market for stabilizing drug components in biopharmaceuticals; notably, most of these buffer systems are offered by players based in the US.
- 86% of the buffer manufacturing systems are fabricated using stainless steel; interestingly, 95% of the buffer systems work automatically with various controls for pH, conductivity, temperature and pressure.
- Stakeholders are actively enhancing their existing capabilities and strengthening their product portfolios in order to gain a competitive edge in the industry and comply with evolving industry standards.
- More than 70 companies are offering buffer manufacturing services for different packaging formats; further, close to 55% of the buffer manufacturing service providers are based in North America.
- Over 60% of the firms engaged in this domain manufacture custom buffers; notably, most of these buffers have been formulated as liquid bottles.
- In pursuit of gaining a competitive edge and to meet the evolving industry requirements, stakeholders are actively enhancing their existing buffer manufacturing capabilities by improving their respective service portfolios.
- The growing interest of stakeholders in buffer manufacturing is evident from the partnership activity in the recent past; in fact, close to 20% of the total deals have been signed in the last two years.
- The global buffer manufacturing systems market is anticipated to grow at a steady pace in coming years; majority of the share is captured by buffer manufacturing systems intended for commercial scale manufacturing.
- Most of the buffer manufacturing services market is captured by small molecules owing to their broad therapeutic applicability; cell and gene therapies segment is likely to grow at a CAGR of 19.5%.
Buffer Preparation Market: Key Segments
Commercial Scale Holds the Largest Share in the Overall Buffer Preparation Market
The global market is segmented across different scales of operation, such as preclinical / clinical and commercial. Within the buffer manufacturing systems market in the current year, the commercial scale segment is likely to capture the maximum share (~85%) and this trend is likely to remain the same in the coming years. This results from the expanding pipeline of biopharmaceutical products, significant investment in research and development, and technological developments, which creates a demand for advanced buffer preparation solutions in pharmaceutical production.
Reusable Buffer Mixing / Preparation Equipment Leads the Buffer Preparation Market
Based on types of system components, the global buffer manufacturing system market size is segmented across single-use buffer mixing / preparation equipment and reusable buffer mixing / preparation equipment. Our estimates suggest that the reusable buffer mixing / preparation equipment market segment is likely to capture the majority share (~80%) in the overall market in the current year and is likely to grow at a relatively faster rate during the forecast period.
Liquid Formulation Captures the Largest Share
This segment highlights the distribution of the global services market across different buffer formulations, such as liquid formulations and powder formulations. Currently, the liquid formulations segment is likely to capture the maximum share (~70%); further, this trend is likely to remain the same in the future as well. This is due to liquid buffers providing consistency between batches and ultimately minimizing the chance of human mistakes in buffer production.
Small Molecules Holds the Largest Share in the Current Year
This segment highlights the distribution of the global services market across different types of molecules, such as small molecules and biologics. Currently, the small molecules segment is likely to capture the maximum share (~75%); further, this trend is likely to remain the same in the future as well. This is due to the extensive therapeutic potential of small molecules and the rising occurrence of chronic illnesses, which is boosting the demand for greater drug production, consequently heightening the need for buffers in manufacturing.
Currently, Antibodies Segment Captures Majority of the Buffer Preparation Market Share
This segment highlights the distribution of the global buffer manufacturing services market across different types of compatible biologics, such as antibodies, vaccines, proteins / peptides, cell and gene therapies and other biologics. In the current year, the antibodies segment is likely to capture the maximum share (~55%) of the overall market; further, this trend is likely to remain the same in the future as well. The cell and gene therapies segment will grow at a significantly higher CAGR (19.5%) throughout the forecast period.
Bottles Segment Captures the Majority of the Market Share
The global services market is segmented into different types of packaging formats, such as bottles, bags, bioprocess containers, drums and other packaging. The bottles segment captures the majority share (~40%) in the overall market in the current year and is likely to dominate the market in the future as well.
North America is Likely to Capture the Majority Share
This segment highlights the distribution of the buffer manufacturing industry size across various geographies, namely North America, Europe, Asia-Pacific, Middle East and North Africa and Latin America. According to our projections, North America is likely to capture the majority share (~40%) in the overall market currently, and this trend is unlikely to change in the future. It is important to note that companies based in North America are progressively implementing buffer production systems to lower manufacturing expenses, enhance efficiency, and ensure high-quality batch products. Additionally, the companies provide tailored buffer preparation services for research laboratories and industries. Further, the market in Asia-Pacific is likely to grow at a high CAGR (8%), during the forecast period.
Example Players in the Buffer Preparation Market
- Asahi Kasei
- Avantor
- Canvax
- Danaher
- GE Healthcare
- HOPAX
- Merck
- Prepared Biologics
- Sartorius
- Sepragen
- Thermo Fisher Scientific
- ZETA
Buffer preparation market: Research Coverage
- Market Sizing and Opportunity Analysis: The report features an in-depth analysis of the buffer preparation market, focusing on key market segments, including [A] scale of operation, [B] type of buffer system component, [C] type of buffer formulation, [D] type of molecule, [E] type of compatible biologic and [F] type of buffer packaging, [G] geographical regions.
- Buffer Manufacturing Systems Market Landscape: A detailed assessment of current market landscape of buffer manufacturing systems, based on several parameters, such as [A] type of buffer system, [B] mode of operation, [C] type of vessel fabrication material, [D] system mobility, [E] key features, [F] integrated technique, [G] buffer manufacturing process, [H] and bioprocessing method.
- Product Competitiveness Analysis: A comprehensive competitive analysis of the buffer manufacturing systems, based on several relevant parameters, such as [A] company strength and [B] product competitiveness.
- Company Profiles: In-depth profiles of prominent players based in North America, Europe and Asia-Pacific that are engaged in providing buffer manufacturing systems and services featuring information on [A] company overviews, [B] financial information (if available), [C] buffer manufacturing system portfolio, [D] recent developments, [E] and an informed future outlook.
- Buffer Manufacturing Service Providers Market Landscape: a detailed assessment of the current market landscape of buffer manufacturing service providers based on several parameters, such as [A] year of establishment, [A] company size, [B] location of headquarters, [C] location of facilities, [D] regulatory compliance, [E] type of company, [F] type of buffer manufactured, [G] type of buffer formulation, [H] type of buffer packaging, [I] type of compatible biologics, [J] application area, and [K] additional service offered.
- Company Competitiveness Analysis: An in-depth company competitiveness analysis of the buffer manufacturing service providers, based on several relevant parameters, such as the [A] company strength, [B] service portfolio strength and [C] application area.
- Partnerships and Collaborations: detailed analysis of the partnerships and collaborations inked between stakeholders engaged in the buffer manufacturing industry, based on several parameters such as [A] year of partnership, [B] type of partnership and [C] most active players.
Key Questions Answered in this Report
- How many companies are currently engaged in this market?
- Which are the leading companies in this market?
- What factors are likely to influence the evolution of this market?
- What is the current and future market size?
- What is the CAGR of this market?
- How is the current and future market opportunity likely to be distributed across key market segments?
Reasons to Buy this Report
- The report provides a comprehensive market analysis, offering detailed revenue projections of the overall market and its specific sub-segments. This information is valuable to both established market leaders and emerging entrants.
- Stakeholders can leverage the report to gain a deeper understanding of the competitive dynamics within the market. By analyzing the competitive landscape, businesses can make informed decisions to optimize their market positioning and develop effective go-to-market strategies.
- The report offers stakeholders a comprehensive overview of the market, including key drivers, barriers, opportunities, and challenges. This information empowers stakeholders to stay abreast of market trends and make data-driven decisions to capitalize on growth prospects.
Additional Benefits
- Complimentary PPT Insights Packs
- Complimentary Excel Data Packs for all Analytical Modules in the Report
- 15% Free Content Customization
- Detailed Report Walkthrough Session with Research Team
- Free Updated report if the report is 6-12 months old or older
TABLE OF CONTENTS
1. PREFACE
- 1.1. Introduction
- 1.2. Market Share Insights
- 1.3. Key Market Insights
- 1.4. Report Coverage
- 1.5. Key Questions Answered
- 1.6. Chapter Outlines
2. RESEARCH METHODOLOGY
- 2.1. Chapter Overview
- 2.2. Research Assumptions
- 2.2.1. Market Landscape and Market Trends
- 2.2.2. Market Forecast and Opportunity Analysis
- 2.2.3. Comparative Analysis
- 2.3. Database Building
- 2.3.1. Data Collection
- 2.3.2. Data Validation
- 2.3.3. Data Analysis
- 2.4. Project Methodology
- 2.4.1. Secondary Research
- 2.4.1.1. Annual Reports
- 2.4.1.2. Academic Research Papers
- 2.4.1.3. Company Websites
- 2.4.1.4. Investor Presentations
- 2.4.1.5. Regulatory Filings
- 2.4.1.6. White Papers
- 2.4.1.7. Industry Publications
- 2.4.1.8. Conferences and Seminars
- 2.4.1.9. Government Portals
- 2.4.1.10. Media and Press Releases
- 2.4.1.11. Newsletters
- 2.4.1.12. Industry Databases
- 2.4.1.13. Roots Proprietary Databases
- 2.4.1.14. Paid Databases and Sources
- 2.4.1.15. Social Media Portals
- 2.4.1.16. Other Secondary Sources
- 2.4.2. Primary Research
- 2.4.2.1. Types of Primary Research
- 2.4.2.1.1. Qualitative Research
- 2.4.2.1.2. Quantitative Research
- 2.4.2.1.3. Hybrid Approach
- 2.4.2.2. Advantages of Primary Research
- 2.4.2.3. Techniques for Primary Research
- 2.4.2.3.1. Interviews
- 2.4.2.3.2. Surveys
- 2.4.2.3.3. Focus Groups
- 2.4.2.3.4. Observational Research
- 2.4.2.3.5. Social Media Interactions
- 2.4.2.4. Key Opinion Leaders Considered in Primary Research
- 2.4.2.4.1. Company Executives (CXOs)
- 2.4.2.4.2. Board of Directors
- 2.4.2.4.3. Company Presidents and Vice Presidents
- 2.4.2.4.4. Research and Development Heads
- 2.4.2.4.5. Technical Experts
- 2.4.2.4.6. Subject Matter Experts
- 2.4.2.4.7. Scientists
- 2.4.2.4.8. Doctors and Other Healthcare Providers
- 2.4.2.5. Ethics and Integrity
- 2.4.2.5.1. Research Ethics
- 2.4.2.5.2. Data Integrity
- 2.4.2.1. Types of Primary Research
- 2.4.3. Analytical Tools and Databases
- 2.4.1. Secondary Research
- 2.5. Robust Quality Control
3. MARKET DYNAMICS
- 3.1. Chapter Overview
- 3.2. Forecast Methodology
- 3.2.1. Top-down Approach
- 3.2.2. Bottom-up Approach
- 3.2.3. Hybrid Approach
- 3.3. Market Assessment Framework
- 3.3.1. Total Addressable Market (TAM)
- 3.3.2. Serviceable Addressable Market (SAM)
- 3.3.3. Serviceable Obtainable Market (SOM)
- 3.3.4. Currently Acquired Market (CAM)
- 3.4. Forecasting Tools and Techniques
- 3.4.1. Qualitative Forecasting
- 3.4.2. Correlation
- 3.4.3. Regression
- 3.4.4. Extrapolation
- 3.4.5. Convergence
- 3.4.6. Sensitivity Analysis
- 3.4.7. Scenario Planning
- 3.4.8. Data Visualization
- 3.4.9. Time Series Analysis
- 3.4.10. Forecast Error Analysis
- 3.5. Key Considerations
- 3.5.1. Demographics
- 3.5.2. Government Regulations
- 3.5.3. Reimbursement Scenarios
- 3.5.4. Market Access
- 3.5.5. Supply Chain
- 3.5.6. Industry Consolidation
- 3.5.7. Pandemic / Unforeseen Disruptions Impact
- 3.6. Limitations
4. MACRO-ECONOMIC INDICATORS
- 4.1. Chapter Overview
- 4.2. Market Dynamics
- 4.2.1. Time Period
- 4.2.1.1. Historical Trends
- 4.2.1.2. Current and Forecasted Estimates
- 4.2.2. Currency Coverage
- 4.2.2.1. Major Currencies Affecting the Market
- 4.2.2.2. Factors Affecting Currency Fluctuations
- 4.2.2.3. Impact of Currency Fluctuations on the Industry
- 4.2.3. Foreign Currency Exchange Rate
- 4.2.3.1. Impact of Foreign Exchange Rate Volatility on the Market
- 4.2.3.2. Strategies for Mitigating Foreign Exchange Risk
- 4.2.4. Recession
- 4.2.4.1. Assessment of Current Economic Conditions and Potential Impact on the Market
- 4.2.4.2. Historical Analysis of Past Recessions and Lessons Learnt
- 4.2.5. Inflation
- 4.2.5.1. Measurement and Analysis of Inflationary Pressures in the Economy
- 4.2.5.2. Potential Impact of Inflation on the Market Evolution
- 4.2.6. Interest Rates
- 4.2.6.1. Interest Rates and Their Impact on the Market
- 4.2.6.2. Strategies for Managing Interest Rate Risk
- 4.2.7. Commodity Flow Analysis
- 4.2.7.1. Type of Commodity
- 4.2.7.2. Origins and Destinations
- 4.2.7.3. Value and Weights
- 4.2.7.4. Modes of Transportation
- 4.2.8. Global Trade Dynamics
- 4.2.8.1. Import Scenario
- 4.2.8.2. Export Scenario
- 4.2.8.3. Trade Policies
- 4.2.8.4. Strategies for Mitigating the Risks Associated with Trade Barriers
- 4.2.8.5. Impact of Trade Barriers on the Market
- 4.2.9. War Impact Analysis
- 4.2.9.1. Russian-Ukraine War
- 4.2.9.2. Israel-Hamas War
- 4.2.10. COVID Impact / Related Factors
- 4.2.10.1. Global Economic Impact
- 4.2.10.2. Industry-specific Impact
- 4.2.10.3. Government Response and Stimulus Measures
- 4.2.10.4. Future Outlook and Adaptation Strategies
- 4.2.11. Other Indicators
- 4.2.11.1. Fiscal Policy
- 4.2.11.2. Consumer Spending
- 4.2.11.3. Gross Domestic Product (GDP)
- 4.2.11.4. Employment
- 4.2.11.5. Taxes
- 4.2.11.6. Stock Market Performance
- 4.2.11.7. Cross-Border Dynamics
- 4.2.1. Time Period
- 4.3. Conclusion
5. EXECUTIVE SUMMARY
6. INTRODUCTION
- 6.1. Chapter Overview
- 6.2. Overview of Buffer Manufacturing
- 6.2.1. Conventional Methods of Buffer Manufacturing
- 6.2.2. Novel Methods of Buffer Manufacturing
- 6.3. Challenges Associated with Buffer Manufacturing
- 6.4. Advantages of Outsourcing Buffer Manufacturing
- 6.5. Key Considerations While Selecting an Outsourcing Partner
- 6.6. Future Perspective
7. MARKET LANDSCAPE: BUFFER MANUFACTURING SYSTEMS
- 7.1. Chapter Overview
- 7.2. Buffer Manufacturing Systems: Overall Market Landscape
- 7.2.1. Analysis by Type of Buffer System
- 7.2.2. Analysis by Mode of Operation
- 7.2.3. Analysis by Type of Vessel Fabrication Material
- 7.2.4. Analysis by Type of System Mobility
- 7.2.5. Analysis by Key Features
- 7.2.6. Analysis by Integrated Technique
- 7.2.7. Analysis by Buffer Manufacturing Process
- 7.2.8. Analysis by Bioprocessing Method
- 7.3. Buffer Manufacturing System Providers Landscape
- 7.3.1. Analysis by Year of Establishment
- 7.3.2. Analysis by Company Size
- 7.3.3. Analysis by Location of Headquarters
8. PRODUCT COMPETITIVENESS ANALYSIS
- 8.1. Chapter Overview
- 8.2. Assumptions and Key Parameters
- 8.3. Methodology
- 8.4. Buffer Manufacturing Systems: Product Competitiveness Analysis
- 8.4.1. Buffer Manufacturing Systems Offered by Companies based in North America
- 8.4.2. Buffer Manufacturing Systems Offered by Companies based in Europe
- 8.4.3. Buffer Manufacturing Systems Offered by Companies based in Asia-Pacific
9. COMPANY PROFILES: BUFFER MANUFACTURING SYSTEM PROVIDERS
- 9.1. Chapter Overview
- 9.2. Asahi Kasei
- 9.2.1. Company Overview
- 9.2.2. Financial Information
- 9.2.3. Buffer Manufacturing System Portfolio
- 9.2.4. Recent Developments and Future Outlook
- 9.3. Danaher
- 9.4. Merck
- 9.5. Sepragen
- 9.6. Thermo Fisher Scientific
- 9.7. ZETA
10. MARKET LANDSCAPE: BUFFER MANUFACTURING SERVICE PROVIDERS
- 10.1. Chapter Overview
- 10.2. Buffer Manufacturing Service Providers: Overall Market Landscape
- 10.2.1. Analysis by Year of Establishment
- 10.2.2. Analysis by Company Size
- 10.2.3. Analysis by Location of Headquarters
- 10.2.4. Analysis by Location of Facilities
- 10.2.5. Analysis by Regulatory Compliance
- 10.2.6. Analysis by Type of Company
- 10.2.7. Analysis by Buffer Manufactured
- 10.2.8. Analysis by Buffer Formulation
- 10.2.9. Analysis by Buffer Packaging Format
- 10.2.10. Analysis by Compatible Biologics
- 10.2.11. Analysis by Application Area
- 10.2.12. Analysis by Additional Service Offered
11. COMPANY COMPETITIVENESS ANALYSIS
- 11.1. Chapter Overview
- 11.2. Assumptions and Key Parameters
- 11.3. Methodology
- 11.4. Company Competitiveness Analysis
- 11.4.1. Buffer Manufacturing Service Providers based in North America
- 11.4.2. Buffer Manufacturing Service Providers based in Europe
- 11.4.3. Buffer Manufacturing Service Providers based in Asia-Pacific
12. COMPANY PROFILES: BUFFER MANUFACTURING SERVICE PROVIDERS
- 12.1. Chapter Overview
- 12.2. Avantor
- 12.2.1. Company Overview
- 12.2.2. Financial Information
- 12.2.3. Buffer Manufacturing Service Portfolio
- 12.2.4. Recent Developments and Future Outlook
- 12.3. Canvax
- 12.4. GE Healthcare
- 12.5. HOPAX
- 12.6. Prepared Biologics
- 12.7. Sartorius
13. PARTNERSHIPS AND COLLABORATIONS
- 13.1. Chapter Overview
- 13.2. Partnership Models
- 13.3. Buffer Manufacturing Solutions: Partnerships and Collaborations
- 13.3.1. Analysis by Year of Partnership
- 13.3.2. Analysis by Type of Partnership
- 13.3.3. Analysis by Year and Type of Partnership
- 13.3.4. Analysis by Type of Partner
- 13.3.5. Most Active Players: Analysis by Number of Partnerships
- 13.3.6. Analysis by Geography
- 13.3.6.1. Local and International Agreements
- 13.3.6.2. Intercontinental and Intracontinental Agreements
14. GLOBAL BUFFER MANUFACTURING SYSTEMS MARKET
- 14.1. Chapter Overview
- 14.2. Key Assumptions and Methodology
- 14.3. Global Buffer Manufacturing Systems Market, Historical Trends (Since 2021) and Forecasted Estimates (Till 2035)
- 14.3.1. Multivariate Scenario Analysis
- 14.3.1.1. Conservative Scenario
- 14.3.1.2. Optimistic Scenario
- 14.3.1. Multivariate Scenario Analysis
- 14.4. Key Market Segmentations
15. BUFFER MANUFACTURING SYSTEMS MARKET, BY SCALE OF OPERATION
- 15.1. Chapter Overview
- 15.2. Key Assumptions and Methodology
- 15.3. Buffer Manufacturing Systems Market: Distribution by Scale of Operation
- 15.3.1. Buffer Manufacturing Systems Market for Preclinical / Clinical Scale, Historical Trends (Since 2021) and Forecasted Estimates (Till 2035)
- 15.3.2. Buffer Manufacturing Systems Market for Commercial Scale, Historical Trends (Since 2021) and Forecasted Estimates (Till 2035)
- 15.4. Data Triangulation and Validation
16. BUFFER MANUFACTURING SYSTEMS MARKET, BY TYPE OF BUFFER SYSTEM COMPONENT
- 16.1. Chapter Overview
- 16.2. Key Assumptions and Methodology
- 16.3. Buffer Manufacturing Systems Market: Distribution by Type of Buffer System Component
- 16.3.1. Buffer Manufacturing Systems Market for Single-use Buffer Mixing / Preparation Equipment, Historical Trends (Since 2021) and Forecasted Estimates (Till 2035)
- 16.3.2. Buffer Manufacturing Systems Market for Reusable Buffer Mixing / Preparation Equipment, Historical Trends (Since 2021) and Forecasted Estimates (Till 2035)
- 16.4. Data Triangulation and Validation
17. BUFFER MANUFACTURING SYSTEMS MARKET, BY GEOGRAPHICAL REGIONS
- 17.1. Chapter Overview
- 17.2. Key Assumptions and Methodology
- 17.3. Buffer Manufacturing Systems Market: Distribution by Geographical Regions
- 17.3.1. Buffer Manufacturing Systems Market in North America, Historical Trends (Since 2021) and Forecasted Estimates (Till 2035)
- 17.3.1.1. Buffer Manufacturing Systems Market in the US, Historical Trends (Since 2021) and Forecasted Estimates (Till 2035)
- 17.3.1.2. Buffer Manufacturing Systems Market in Canada, Historical Trends (Since 2021) and Forecasted Estimates (Till 2035)
- 17.3.2. Buffer Manufacturing Systems Market in Europe, Historical Trends (Since 2021) and Forecasted Estimates (Till 2035)
- 17.3.2.1. Buffer Manufacturing Systems Market in Germany, Historical Trends (Since 2021) and Forecasted Estimates (Till 2035)
- 17.3.2.2. Buffer Manufacturing Systems Market in France, Historical Trends (Since 2021) and Forecasted Estimates (Till 2035)
- 17.3.2.3. Buffer Manufacturing Systems Market in Italy, Historical Trends (Since 2021) and Forecasted Estimates (Till 2035)
- 17.3.2.4. Buffer Manufacturing Systems Market in Spain, Historical Trends (Since 2021) and Forecasted Estimates (Till 2035)
- 17.3.2.5. Buffer Manufacturing Systems Market in the UK, Historical Trends (Since 2021) and Forecasted Estimates (Till 2035)
- 17.3.2.6. Buffer Manufacturing Systems Market for Rest of Europe, Historical Trends (Since 2021) and Forecasted Estimates (Till 2035)
- 17.3.3. Buffer Manufacturing Systems Market in Asia-Pacific, Historical Trends (Since 2021) and Forecasted Estimates (Till 2035)
- 17.3.3.1. Buffer Manufacturing Systems Market in China, Historical Trends (Since 2021) and Forecasted Estimates (Till 2035)
- 17.3.3.2. Buffer Manufacturing Systems Market in South Korea, Historical Trends (Since 2021) and Forecasted Estimates (Till 2035)
- 17.3.3.3. Buffer Manufacturing Systems Market in India, Historical Trends (Since 2021) and Forecasted Estimates (Till 2035)
- 17.3.3.4. Buffer Manufacturing Systems Market in Japan, Historical Trends (Since 2021) and Forecasted Estimates (Till 2035)
- 17.3.3.5. Buffer Manufacturing Systems Market for Rest of Asia-Pacific, Historical Trends (Since 2021) and Forecasted Estimates (Till 2035)
- 17.3.4. Buffer Manufacturing Systems Market in Middle East and North Africa, Historical Trends (Since 2021) and Forecasted Estimates (Till 2035)
- 17.3.4.1. Buffer Manufacturing Systems Market in Israel, Historical Trends (Since 2021) and Forecasted Estimates (Till 2035)
- 17.3.4.2. Buffer Manufacturing Systems Market in Saudi Arabia, Historical Trends (Since 2021) and Forecasted Estimates (Till 2035)
- 17.3.4.3. Buffer Manufacturing Systems Market in Iran, Historical Trends (Since 2021) and Forecasted Estimates (Till 2035)
- 17.3.4.4. Buffer Manufacturing Systems Market in Rest of Middle East and North Africa, Historical Trends (Since 2021) and Forecasted Estimates (Till 2035)
- 17.3.5. Buffer Manufacturing Systems Market in Latin America, Historical Trends (Since 2021) and Forecasted Estimates (Till 2035)
- 17.3.5.1. Buffer Manufacturing Systems Market in Brazil, Historical Trends (Since 2021) and Forecasted Estimates (Till 2035)
- 17.3.5.2. Buffer Manufacturing Systems Market in Argentina, Historical Trends (Since 2021) and Forecasted Estimates (Till 2035)
- 17.3.1. Buffer Manufacturing Systems Market in North America, Historical Trends (Since 2021) and Forecasted Estimates (Till 2035)
- 17.4. Data Triangulation and Validation
18. MARKET OPPORTUNITY ANALYSIS: NORTH AMERICA
- 18.1. Buffer Manufacturing Systems Market in North America: Distribution by Scale of Operation
- 18.1.1. Buffer Manufacturing Systems Market in North America for Preclinical / Clinical Scale, Historical Trends (Since 2022) and Forecasted Estimates (Till 2035)
- 18.1.2. Buffer Manufacturing Systems Market in North America for Commercial Scale, Historical Trends (Since 2022) and Forecasted Estimates (Till 2035)
- 18.2. Buffer Manufacturing Systems Market in North America: Distribution by Type of Buffer System Component
- 18.2.1. Buffer Manufacturing Systems Market in North America for Single-use Buffer Mixing / Preparation Equipment, Historical Trends (Since 2022) and Forecasted Estimates (Till 2035)
- 18.2.2. Buffer Manufacturing Systems Market in North America for Reusable Buffer Mixing / Preparation Equipment, Historical Trends (Since 2022) and Forecasted Estimates (Till 2035)
19. MARKET OPPORTUNITY ANALYSIS: EUROPE
- 19.1. Buffer Manufacturing Systems Market in Europe: Distribution by Scale of Operation
- 19.1.1. Buffer Manufacturing Systems Market in Europe for Preclinical / Clinical Scale, Historical Trends (Since 2022) and Forecasted Estimates (Till 2035)
- 19.1.2. Buffer Manufacturing Systems Market in Europe for Commercial Scale, Historical Trends (Since 2022) and Forecasted Estimates (Till 2035)
- 19.2. Buffer Manufacturing Systems Market in Europe: Distribution by Type of Buffer System Component
- 19.2.1. Buffer Manufacturing Systems Market in Europe for Single-use Buffer Mixing / Preparation Equipment, Historical Trends (Since 2022) and Forecasted Estimates (Till 2035)
- 19.2.2. Buffer Manufacturing Systems Market in Europe for Reusable Buffer Mixing / Preparation Equipment, Historical Trends (Since 2022) and Forecasted Estimates (Till 2035)
20. MARKET OPPORTUNITY ANALYSIS: ASIA-PACIFIC
- 20.1. Buffer Manufacturing Systems Market in Asia-Pacific: Distribution by Scale of Operation
- 20.1.1. Buffer Manufacturing Systems Market in Asia-Pacific for Preclinical / Clinical Scale, Historical Trends (Since 2022) and Forecasted Estimates (Till 2035)
- 20.1.2. Buffer Manufacturing Systems Market in Asia-Pacific for Commercial Scale, Historical Trends (Since 2022) and Forecasted Estimates (Till 2035)
- 20.2. Buffer Manufacturing Systems Market in Asia-Pacific: Distribution by Type of Buffer System Component
- 20.2.1. Buffer Manufacturing Systems Market in Asia-Pacific for Single-use Buffer Mixing / Preparation Equipment, Historical Trends (Since 2022) and Forecasted Estimates (Till 2035)
- 20.2.2. Buffer Manufacturing Systems Market in Asia-Pacific for Reusable Buffer Mixing / Preparation Equipment, Historical Trends (Since 2022) and Forecasted Estimates (Till 2035)
21. MARKET OPPORTUNITY ANALYSIS: MIDDLE EAST AND NORTH AFRICA
- 21.1. Buffer Manufacturing Systems Market in Middle East and North Africa: Distribution by Scale of Operation
- 21.1.1. Buffer Manufacturing Systems Market in Middle East and North Africa for Preclinical / Clinical Scale, Historical Trends (Since 2022) and Forecasted Estimates (Till 2035)
- 21.1.2. Buffer Manufacturing Systems Market in Middle East and North Africa for Commercial Scale, Historical Trends (Since 2022) and Forecasted Estimates (Till 2035)
- 21.2. Buffer Manufacturing Systems Market in Middle East and North Africa: Distribution by Type of Buffer System Component
- 21.2.1. Buffer Manufacturing Systems Market in Middle East and North Africa for Single-use Buffer Mixing / Preparation Equipment, Historical Trends (Since 2022) and Forecasted Estimates (Till 2035)
- 21.2.2. Buffer Manufacturing Systems Market in Middle East and North Africa for Reusable Buffer Mixing / Preparation Equipment, Historical Trends (Since 2022) and Forecasted Estimates (Till 2035)
22. MARKET OPPORTUNITY ANALYSIS: LATIN AMERICA
- 22.1. Buffer Manufacturing Systems Market in Latin America: Distribution by Scale of Operation
- 22.1.1. Buffer Manufacturing Systems Market in Latin America for Preclinical / Clinical Scale, Historical Trends (Since 2022) and Forecasted Estimates (Till 2035)
- 22.1.2. Buffer Manufacturing Systems Market in Latin America for Commercial Scale, Historical Trends (Since 2022) and Forecasted Estimates (Till 2035)
- 22.2. Buffer Manufacturing Systems Market in Latin America: Distribution by Type of Buffer System Component
- 22.2.1. Buffer Manufacturing Systems Market in Latin America for Single-use Buffer Mixing / Preparation Equipment, Historical Trends (Since 2022) and Forecasted Estimates (Till 2035)
- 22.2.2. Buffer Manufacturing Systems Market in Latin America for Reusable Buffer Mixing / Preparation Equipment, Historical Trends (Since 2022) and Forecasted Estimates (Till 2035)
23. GLOBAL BUFFER MANUFACTURING SERVICES MARKET
- 23.1. Chapter Overview
- 23.2. Key Assumptions and Methodology
- 23.3. Global Buffer Manufacturing Services Market, Historical Trends (Since 2022) and Forecasted Estimates (Till 2035)
- 23.3.1. Multivariate Scenario Analysis
- 23.3.1.1. Conservative Scenario
- 23.3.1.2. Optimistic Scenario
- 23.3.1. Multivariate Scenario Analysis
- 23.4. Key Market Segmentations
24. BUFFER MANUFACTURING SYSTEMS MARKET, BY SCALE OF OPERATION
- 24.1. Chapter Overview
- 24.2. Key Assumptions and Methodology
- 24.3. Buffer Manufacturing Systems Market: Distribution by Scale of Operation
- 24.3.1. Buffer Manufacturing Systems Market for Preclinical / Clinical Scale, Historical Trends (Since 2022) and Forecasted Estimates (Till 2035)
- 24.3.2. Buffer Manufacturing Systems Market for Commercial Scale, Historical Trends (Since 2022) and Forecasted Estimates (Till 2035)
- 24.4. Data Triangulation and Validation
25. BUFFER MANUFACTURING SYSTEMS MARKET, BY TYPE OF BUFFER FORMULATION
- 25.1. Chapter Overview
- 25.2. Key Assumptions and Methodology
- 25.3. Buffer Manufacturing Systems Market: Distribution by Type of Buffer Formulation
- 25.3.1. Buffer Manufacturing Systems Market for Liquid Formulation, Historical Trends (Since 2022) and Forecasted Estimates (Till 2035)
- 25.3.2. Buffer Manufacturing Systems Market for Powder Formulation, Historical Trends (Since 2022) and Forecasted Estimates (Till 2035)
- 25.4. Data Triangulation and Validation
26. BUFFER MANUFACTURING SYSTEMS MARKET, BY TYPE OF MOLECULE
- 26.1. Chapter Overview
- 26.2. Key Assumptions and Methodology
- 26.3. Buffer Manufacturing Systems Market: Distribution by Type of Molecule
- 26.3.1. Buffer Manufacturing Systems Market for Small Molecules, Historical Trends (Since 2022) and Forecasted Estimates (Till 2035)
- 26.3.2. Buffer Manufacturing Systems Market for Biologics, Historical Trends (Since 2022) and Forecasted Estimates (Till 2035)
- 26.4. Data Triangulation and Validation
27. BUFFER MANUFACTURING SYSTEMS MARKET, BY TYPE OF COMPATIBLE BIOLOGIC
- 27.1. Chapter Overview
- 27.2. Key Assumptions and Methodology
- 27.3. Buffer Manufacturing Systems Market: Distribution by Type of Compatible Biologic
- 27.3.1. Buffer Manufacturing Systems Market for Antibodies, Historical Trends (Since 2022) and Forecasted Estimates (Till 2035)
- 27.3.2. Buffer Manufacturing Systems Market for Vaccines, Historical Trends (Since 2022) and Forecasted Estimates (Till 2035)
- 27.3.3. Buffer Manufacturing Systems Market for Proteins / Peptides, Historical Trends (Since 2022) and Forecasted Estimates (Till 2035)
- 27.3.4. Buffer Manufacturing Systems Market for Cell and Gene Therapies, Historical Trends (Since 2022) and Forecasted Estimates (Till 2035)
- 27.3.5. Buffer Manufacturing Systems Market for Other Biologics, Historical Trends (Since 2022) and Forecasted Estimates (Till 2035)
- 27.4. Data Triangulation and Validation
28. BUFFER MANUFACTURING SYSTEMS MARKET, BY TYPE OF BUFFER PACKAGING
- 28.1. Chapter Overview
- 28.2. Key Assumptions and Methodology
- 28.3. Buffer Manufacturing Systems Market: Distribution by Type of Buffer Packaging
- 28.3.1. Buffer Manufacturing Systems Market for Bottles, Historical Trends (Since 2022) and Forecasted Estimates (Till 2035)
- 28.3.2. Buffer Manufacturing Systems Market for Bags, Historical Trends (Since 2022) and Forecasted Estimates (Till 2035)
- 28.3.3. Buffer Manufacturing Systems Market for Bioprocess Containers, Historical Trends (Since 2022) and Forecasted Estimates (Till 2035)
- 28.3.4. Buffer Manufacturing Systems Market for Drums, Historical Trends (Since 2022) and Forecasted Estimates (Till 2035)
- 28.3.5. Buffer Manufacturing Systems Market for Other Types of Packaging, Historical Trends (Since 2022) and Forecasted Estimates (Till 2035)
- 28.4. Data Triangulation and Validation
29. BUFFER MANUFACTURING SYSTEMS MARKET, BY GEOGRAPHICAL REGIONS
- 29.1. Chapter Overview
- 29.2. Key Assumptions and Methodology
- 29.3. Buffer Manufacturing Systems Market: Distribution by Geographical Regions
- 29.3.1. Buffer Manufacturing Systems Market in North America, Historical Trends (Since 2022) and Forecasted Estimates (Till 2035)
- 29.3.1.1. Buffer Manufacturing Systems Market in the US, Historical Trends (Since 2022) and Forecasted Estimates (Till 2035)
- 29.3.1.2. Buffer Manufacturing Systems Market in Canada, Historical Trends (Since 2022) and Forecasted Estimates (Till 2035)
- 29.3.2. Buffer Manufacturing Systems Market in Europe, Historical Trends (Since 2022) and Forecasted Estimates (Till 2035)
- 29.3.2.1. Buffer Manufacturing Systems Market in Germany, Historical Trends (Since 2022) and Forecasted Estimates (Till 2035)
- 29.3.2.2. Buffer Manufacturing Systems Market in France, Historical Trends (Since 2022) and Forecasted Estimates (Till 2035)
- 29.3.2.3. Buffer Manufacturing Systems Market in Italy, Historical Trends (Since 2022) and Forecasted Estimates (Till 2035)
- 29.3.2.4. Buffer Manufacturing Systems Market in Spain, Historical Trends (Since 2022) and Forecasted Estimates (Till 2035)
- 29.3.2.5. Buffer Manufacturing Systems Market in the UK, Historical Trends (Since 2022) and Forecasted Estimates (Till 2035)
- 29.3.2.6. Buffer Manufacturing Systems Market for Rest of Europe, Historical Trends (Since 2022) and Forecasted Estimates (Till 2035)
- 29.3.3. Buffer Manufacturing Systems Market in Asia-Pacific, Historical Trends (Since 2022) and Forecasted Estimates (Till 2035)
- 29.3.3.1. Buffer Manufacturing Systems Market in China, Historical Trends (Since 2022) and Forecasted Estimates (Till 2035)
- 29.3.3.2. Buffer Manufacturing Systems Market in South Korea, Historical Trends (Since 2022) and Forecasted Estimates (Till 2035)
- 29.3.3.3. Buffer Manufacturing Systems Market in India, Historical Trends (Since 2022) and Forecasted Estimates (Till 2035)
- 29.3.3.4. Buffer Manufacturing Systems Market in Japan, Historical Trends (Since 2022) and Forecasted Estimates (Till 2035)
- 29.3.3.5. Buffer Manufacturing Systems Market for Rest of Asia-Pacific, Historical Trends (Since 2022) and Forecasted Estimates (Till 2035)
- 29.3.4. Buffer Manufacturing Systems Market in Middle East and North Africa, Historical Trends (Since 2022) and Forecasted Estimates (Till 2035)
- 29.3.4.1. Buffer Manufacturing Systems Market in Israel, Historical Trends (Since 2022) and Forecasted Estimates (Till 2035)
- 29.3.4.2. Buffer Manufacturing Systems Market in Saudi Arabia, Historical Trends (Since 2022) and Forecasted Estimates (Till 2035)
- 29.3.4.3. Buffer Manufacturing Systems Market in Iran, Historical Trends (Since 2022) and Forecasted Estimates (Till 2035)
- 29.3.4.4. Buffer Manufacturing Systems Market in Rest of Middle East and North Africa, Historical Trends (Since 2022) and Forecasted Estimates (Till 2035)
- 29.3.5. Buffer Manufacturing Systems Market in Latin America, Historical Trends (Since 2022) and Forecasted Estimates (Till 2035)
- 29.3.5.1. Buffer Manufacturing Systems Market in Brazil, Historical Trends (Since 2022) and Forecasted Estimates (Till 2035)
- 29.3.5.2. Buffer Manufacturing Systems Market in Argentina, Historical Trends (Since 2022) and Forecasted Estimates (Till 2035)
- 29.3.1. Buffer Manufacturing Systems Market in North America, Historical Trends (Since 2022) and Forecasted Estimates (Till 2035)
- 29.4. Data Triangulation and Validation
30. CONCLUDING REMARKS
31. APPENDIX 1: TABULATED DATA
32. APPENDIX 2: LIST OF COMPANIES AND ORGANIZATIONS
List of Tables
- Table 7.1 Buffer Manufacturing Systems: Information on Type of Buffer System and Mode of Operation
- Table 7.2 Buffer Manufacturing Systems: Information on Type of Vessel Fabrication Material and System Mobility
- Table 7.3 Buffer Manufacturing Systems: Information on Key Features and Integrated Technique
- Table 7.4 Buffer Manufacturing Systems: Information on Buffer Manufacturing Process and Bioprocessing Method
- Table 7.5 Buffer Manufacturing System Providers: Information on Year of Establishment, Company Size and Location of Headquarters
- Table 9.1 Buffer Manufacturing System Providers: List of Companies Profiled
- Table 9.2 Asahi Kasei: Company Overview
- Table 9.3 Asahi Kasei: Buffer Manufacturing System Portfolio
- Table 9.4 Asahi Kasei: Recent Developments and Future Outlook
- Table 9.5 Danaher: Company Overview
- Table 9.6 Danaher: Buffer Manufacturing System Portfolio
- Table 9.7 Danaher: Recent Developments and Future Outlook
- Table 9.8 Merck: Company Overview
- Table 9.9 Merck: Buffer Manufacturing System Portfolio
- Table 9.10 Merck: Recent Developments and Future Outlook
- Table 9.11 Sepragen: Company Overview
- Table 9.12 Sepragen: Buffer Manufacturing System Portfolio
- Table 9.13 Thermo Fisher Scientific: Company Overview
- Table 9.14 Thermo Fisher Scientific: Buffer Manufacturing System Portfolio
- Table 9.15 Thermo Fisher Scientific: Recent Developments and Future Outlook
- Table 9.16 ZETA: Company Overview
- Table 9.17 ZETA: Buffer Manufacturing System Portfolio
- Table 9.18 ZETA: Recent Developments and Future Outlook
- Table 10.1 Buffer Manufacturing Service Providers: Information on Year of Establishment, Company Size and Location of Headquarters
- Table 10.2 Buffer Manufacturing Facilities: Information on Number of Facilities, Location of Facilities and Regulatory Certifications
- Table 10.3 Buffer Manufacturing Service Providers: Information on Type of Company and Type of Buffer Manufactured
- Table 10.4 Buffer Manufacturing Service Providers: Information on Buffer Formulation, Type of Buffer Packaging and Compatible Biologics
- Table 10.5 Buffer Manufacturing Service Providers: Information on Application Area and Additional Service Offered
- Table 12.1 Buffer Manufacturing Service Providers: List of Companies Profiled
- Table 12.2 Avantor: Company Overview
- Table 12.3 Avantor: Buffer Manufacturing Services Portfolio
- Table 12.4 Avantor: Recent Developments and Future Outlook
- Table 12.5 Canvax: Company Overview
- Table 12.6 Canvax: Buffer Manufacturing Services Portfolio
- Table 12.7 GE Healthcare: Company Overview
- Table 12.8 GE Healthcare: Buffer Manufacturing Services Portfolio
- Table 12.9 GE Healthcare: Recent Developments and Future Outlook
- Table 12.10 HOPAX: Company Overview
- Table 12.11 HOPAX: Buffer Manufacturing Services Portfolio
- Table 12.12 HOPAX: Recent Developments and Future Outlook
- Table 12.13 Prepared Biologicals: Company Overview
- Table 12.14 Prepared Biologicals: Buffer Manufacturing Services Portfolio
- Table 12.15 Sartorius: Company Overview
- Table 12.16 Sartorius: Buffer Manufacturing Services Portfolio
- Table 12.17 Sartorius: Recent Developments and Future Outlook
- Table 13.1 Buffer Manufacturing Solutions: List of Partnerships and Collaborations, Pre-2020-2025 (till May)
- Table 26.1 Buffer Manufacturing Systems: Distribution by Type of Buffer System
- Table 26.2 Buffer Manufacturing Systems: Distribution by Mode of Operation
- Table 26.3 Buffer Manufacturing Systems: Distribution by System Mobility
- Table 26.4 Buffer Manufacturing Systems: Distribution by Key Features
- Table 26.5 Buffer Manufacturing Systems: Distribution by Integrated Technique
- Table 26.6 Buffer Manufacturing Systems: Distribution by Buffer Manufacturing Process
- Table 26.7 Buffer Manufacturing Systems: Distribution by Bioprocessing Method
- Table 26.8 Buffer Manufacturing System Providers: Distribution by Year of Establishment
- Table 26.9 Buffer Manufacturing System Providers: Distribution by Company Size
- Table 26.10 Buffer Manufacturing System Providers: Distribution by Location of Headquarters
- Table 26.11 Asahi Kasei: Annual Revenues, Since FY 2021 (YEN Billion)
- Table 26.12 Danaher: Annual Revenues, Since FY 2022 (USD Billion)
- Table 26.13 Merck: Annual Revenues, Since FY 2022 (EUR Billion)
- Table 26.14 Thermo Fisher Scientific: Annual Revenues, Since FY 2022 (USD Billion)
- Table 26.15 Buffer Manufacturing Service Providers: Distribution by Year of Establishment
- Table 26.16 Buffer Manufacturing Service Providers: Distribution by Company Size
- Table 26.17 Buffer Manufacturing Service Providers: Distribution by Location of Headquarters
- Table 26.18 Buffer Manufacturing Service Providers: Distribution by Location of Facilities
- Table 26.19 Buffer Manufacturing Service Providers: Distribution by Regulatory Compliance
- Table 26.20 Buffer Manufacturing Service Providers: Distribution by Type of Company
- Table 26.21 Buffer Manufacturing Service Providers: Distribution by Type of Buffer Provided
- Table 26.22 Buffer Manufacturing Service Providers: Distribution by Type of Buffer Formulation
- Table 26.23 Buffer Manufacturing Service Provider: Distribution by Buffer Packaging
- Table 26.24 Buffer Manufacturing Service Providers: Distribution by Compatible Biologics
- Table 26.25 Buffer Manufacturing Service Providers: Distribution by Application Area
- Table 26.26 Buffer Manufacturing Service Providers: Distribution by Additional Service Offered
- Table 26.27 Avantor: Annual Revenues, Since FY 2022 (USD Billion)
- Table 26.28 GE Healthcare: Annual Revenues, Since FY 2022 (USD Billion)
- Table 26.29 HOPAX: Annual Revenues, Since FY 2021(TWD Million)
- Table 26.30 Sartorius: Annual Revenues, Since FY 2022 (EUR Billion)
- Table 26.31 Partnerships and Collaborations: Distribution by Year of Partnership
- Table 26.32 Partnerships and Collaborations: Distribution by Type of Partnership
- Table 26.33 Partnerships and Collaborations: Distribution by Year and Type of Partnership
- Table 26.34 Partnerships and Collaborations: Distribution by Type of Partner
- Table 26.35 Most Active Players: Distribution by Number of Partnerships
- Table 26.36 Partnerships and Collaborations: Distribution by Country
- Table 26.37 Partnerships and Collaborations: Distribution by Region
- Table 26.38 Global Buffer Manufacturing Systems Market: Historical Trends (Since 2021) and Forecasted Estimates (Till 2035) (USD Billion)
- Table 26.39 Global Buffer Manufacturing Systems Market, Forecasted Estimates (Till 2035): Conservative Scenario (USD Billion)
- Table 26.40 Global Buffer Manufacturing Systems Market, Forecasted Estimates (Till 2035): Optimistic Scenario (USD Billion)
- Table 26.41 Global Buffer Manufacturing Systems Market: Distribution by Scale of Operation
- Table 26.42 Buffer Manufacturing Systems Market for Preclinical / Clinical Scale: Historical Trends (Since 2021) and Forecasted Estimates (Till 2035) (USD Billion)
- Table 26.43 Buffer Manufacturing Systems Market for Commercial Scale: Historical Trends (Since 2021) and Forecasted Estimates (Till 2035) (USD Billion)
- Table 26.44 Buffer Manufacturing Systems Market: Distribution by Type of Buffer System Component
- Table 26.45 Buffer Manufacturing Systems Market for Single-use Buffer Mixing / Preparation Equipment: Historical Trends (Since 2021) and Forecasted Estimates (Till 2035) (USD Billion)
- Table 26.46 Buffer Manufacturing Systems Market for Reusable Buffer Mixing / Preparation Equipment: Historical Trends (Since 2021) and Forecasted Estimates (Till 2035) (USD Billion)
- Table 26.47 Buffer Manufacturing Systems Market: Distribution by Geographical Regions
- Table 26.48 Buffer Manufacturing Systems Market in North America: Historical Trends (Since 2021) and Forecasted Estimates (Till 2035) (USD Billion)
- Table 26.49 Buffer Manufacturing Systems Market in the US: Historical Trends (Since 2021) and Forecasted Estimates (Till 2035) (USD Billion)
- Table 26.50 Buffer Manufacturing Systems Market in Canada: Historical Trends (Since 2021) and Forecasted Estimates (Till 2035) (USD Billion)
- Table 26.51 Buffer Manufacturing Systems Market in Europe: Historical Trends (Since 2021) and Forecasted Estimates (Till 2035) (USD Billion)
- Table 26.52 Buffer Manufacturing Systems Market in Germany: Historical Trends (Since 2021) and Forecasted Estimates (Till 2035) (USD Billion)
- Table 26.53 Buffer Manufacturing Systems Market in France: Historical Trends (Since 2021) and Forecasted Estimates (Till 2035) (USD Billion)
- Table 26.54 Buffer Manufacturing Systems Market in Italy: Historical Trends (Since 2021) and Forecasted Estimates (Till 2035) (USD Billion)
- Table 26.55 Buffer Manufacturing Systems Market in Spain: Historical Trends (Since 2021) and Forecasted Estimates (Till 2035) (USD Billion)
- Table 26.56 Buffer Manufacturing Systems Market in the UK: Historical Trends (Since 2021) and Forecasted Estimates (Till 2035) (USD Billion)
- Table 26.57 Buffer Manufacturing Systems Market in Rest of Europe: Historical Trends (Since 2021) and Forecasted Estimates (Till 2035) (USD Billion)
- Table 26.58 Buffer Manufacturing Systems Market in Asia-Pacific: Historical Trends (Since 2021) and Forecasted Estimates (Till 2035) (USD Billion)
- Table 26.59 Buffer Manufacturing Systems Market in China: Historical Trends (Since 2021) and Forecasted Estimates (Till 2035) (USD Billion)
- Table 26.60 Buffer Manufacturing Systems Market in South Korea: Historical Trends (Since 2021) and Forecasted Estimates (Till 2035) (USD Billion)
- Table 26.61 Buffer Manufacturing Systems Market in India: Historical Trends (Since 2021) and Forecasted Estimates (Till 2035) (USD Billion)
- Table 26.62 Buffer Manufacturing Systems Market in Japan: Historical Trends (Since 2021) and Forecasted Estimates (Till 2035) (USD Billion)
- Table 26.63 Buffer Manufacturing Systems Market in Rest of Asia-Pacific: Historical Trends (Since 2021) and Forecasted Estimates (Till 2035) (USD Billion)
- Table 26.64 Buffer Manufacturing Systems Market in Middle East and North Africa: Historical Trends (Since 2021) and Forecasted Estimates (Till 2035) (USD Billion)
- Table 26.65 Buffer Manufacturing Systems Market in Israel: Historical Trends (Since 2021) and Forecasted Estimates (Till 2035) (USD Billion)
- Table 26.66 Buffer Manufacturing Systems Market in Saudi Arabia: Historical Trends (Since 2021) and Forecasted Estimates (Till 2035) (USD Billion)
- Table 26.67 Buffer Manufacturing Systems Market in Iran: Historical Trends (Since 2021) and Forecasted Estimates (Till 2035) (USD Billion)
- Table 26.68 Buffer Manufacturing Systems Market in Rest of Middle East and North Africa: Historical Trends (Since 2021) and Forecasted Estimates (Till 2035) (USD Billion)
- Table 26.69 Buffer Manufacturing Systems Market in Latin America: Historical Trends (Since 2021) and Forecasted Estimates (Till 2035) (USD Billion)
- Table 26.70 Buffer Manufacturing Systems Market in Brazil: Historical Trends (Since 2021) and Forecasted Estimates (Till 2035) (USD Billion)
- Table 26.71 Buffer Manufacturing Systems Market in Argentina: Historical Trends (Since 2021) and Forecasted Estimates (Till 2035) (USD Billion)
- Table 26.72 Global Buffer Manufacturing Services Market: Historical Trends (Since 2022) and Forecasted Estimates (Till 2035) (USD Million)
- Table 26.73 Global Buffer Manufacturing Services Market, Forecasted Estimates (Till 2035): Conservative Scenario (USD Million)
- Table 26.74 Global Buffer Manufacturing Services Market, Forecasted Estimates (Till 2035): Optimistic Scenario (USD Million)
- Table 26.75 Global Buffer Manufacturing Services Market: Distribution by Scale of Operation
- Table 26.76 Buffer Manufacturing Services Market for Preclinical / Clinical Scale: Historical Trends (Since 2022) and Forecasted Estimates (Till 2035) (USD Million)
- Table 26.77 Buffer Manufacturing Services Market for Commercial Scale: Historical Trends (Since 2022) and Forecasted Estimates (Till 2035) (USD Million)
- Table 26.78 Global Buffer Manufacturing Services Market: Distribution by Type of Buffer Formulation
- Table 26.79 Buffer Manufacturing Services Market for Liquid Formulation: Historical Trends (Since 2022) and Forecasted Estimates (Till 2035) (USD Million)
- Table 26.80 Buffer Manufacturing Services Market for Powder Formulation: Historical Trends (Since 2022) and Forecasted Estimates (Till 2035) (USD Million)
- Table 26.81 Global Buffer Manufacturing Services Market: Distribution by Type of Molecule
- Table 26.82 Buffer Manufacturing Services Market for Small Molecules: Historical Trends (Since 2022) and Forecasted Estimates (Till 2035) (USD Million)
- Table 26.83 Buffer Manufacturing Services Market for Biologics: Historical Trends (Since 2022) and Forecasted Estimates (Till 2035) (USD Million)
- Table 26.84 Global Buffer Manufacturing Services Market: Distribution by Type of Compatible Biologic
- Table 26.85 Buffer Manufacturing Services Market for Antibodies: Historical Trends (Since 2022) and Forecasted Estimates (Till 2035) (USD Million)
- Table 26.86 Buffer Manufacturing Services Market for Vaccines: Historical Trends (Since 2022) and Forecasted Estimates (Till 2035) (USD Million)
- Table 26.87 Buffer Manufacturing Services Market for Protein / Peptides: Historical Trends (Since 2022) and Forecasted Estimates (Till 2035) (USD Million)
- Table 26.88 Buffer Manufacturing Services Market for Cell and Gene Therapies: Historical Trends (Since 2022) and Forecasted Estimates (Till 2035) (USD Million)
- Table 26.89 Buffer Manufacturing Services Market for Other Biologics: Historical Trends (Since 2022) and Forecasted Estimates (Till 2035) (USD Million)
- Table 26.90 Global Buffer Manufacturing Services Market: Distribution by Type of Buffer Packaging
- Table 26.91 Buffer Manufacturing Services Market for Bottles: Historical Trends (Since 2022) and Forecasted Estimates (Till 2035) (USD Million)
- Table 26.92 Buffer Manufacturing Services Market for Bags: Historical Trends (Since 2022) and Forecasted Estimates (Till 2035) (USD Million)
- Table 26.93 Buffer Manufacturing Services Market for Bioprocess Containers: Historical Trends (Since 2022) and Forecasted Estimates (Till 2035) (USD Million)
- Table 26.94 Buffer Manufacturing Services Market for Drums: Historical Trends (Since 2022) and Forecasted Estimates (Till 2035) (USD Million)
- Table 26.95 Buffer Manufacturing Services Market for Other Packagings: Historical Trends (Since 2022) and Forecasted Estimates (Till 2035) (USD Million)
- Table 26.96 Buffer Manufacturing Services Market: Distribution by Geographical Regions
- Table 26.97 Buffer Manufacturing Services Market in North America: Historical Trends (Since 2022) and Forecasted Estimates (Till 2035) (USD Million)
- Table 26.98 Buffer Manufacturing Services Market in the US: Historical Trends (Since 2022) and Forecasted Estimates (Till 2035) (USD Million)
- Table 26.99 Buffer Manufacturing Services Market in Canada: Historical Trends (Since 2022) and Forecasted Estimates (Till 2035) (USD Million)
- Table 26.100 Buffer Manufacturing Services Market in Europe: Historical Trends (Since 2022) and Forecasted Estimates (Till 2035) (USD Million)
- Table 26.101 Buffer Manufacturing Services Market in Germany: Historical Trends (Since 2022) and Forecasted Estimates (Till 2035) (USD Million)
- Table 26.102 Buffer Manufacturing Services Market in France: Historical Trends (Since 2022) and Forecasted Estimates (Till 2035) (USD Million)
- Table 26.103 Buffer Manufacturing Services Market in Italy: Historical Trends (Since 2022) and Forecasted Estimates (Till 2035) (USD Million)
- Table 26.104 Buffer Manufacturing Services Market in Spain: Historical Trends (Since 2022) and Forecasted Estimates (Till 2035) (USD Million)
- Table 26.105 Buffer Manufacturing Services Market in the UK: Historical Trends (Since 2022) and Forecasted Estimates (Till 2035) (USD Million)
- Table 26.106 Buffer Manufacturing Services Market in Rest of Europe: Historical Trends (Since 2022) and Forecasted Estimates (Till 2035) (USD Million)
- Table 26.107 Buffer Manufacturing Services Market in Asia-Pacific: Historical Trends (Since 2022) and Forecasted Estimates (Till 2035) (USD Million)
- Table 26.108 Buffer Manufacturing Services Market in China: Historical Trends (Since 2022) and Forecasted Estimates (Till 2035) (USD Million)
- Table 26.109 Buffer Manufacturing Services Market in South Korea: Historical Trends (Since 2022) and Forecasted Estimates (Till 2035) (USD Million)
- Table 26.110 Buffer Manufacturing Services Market in India: Historical Trends (Since 2022) and Forecasted Estimates (Till 2035) (USD Million)
- Table 26.111 Buffer Manufacturing Services Market in Japan: Historical Trends (Since 2022) and Forecasted Estimates (Till 2035) (USD Million)
- Table 26.112 Buffer Manufacturing Services Market in Rest of Asia-Pacific: Historical Trends (Since 2022) and Forecasted Estimates (Till 2035) (USD Million)
- Table 26.113 Buffer Manufacturing Services Market in Middle East and North Africa: Historical Trends (Since 2022) and Forecasted Estimates (Till 2035) (USD Million)
- Table 26.114 Buffer Manufacturing Services Market in Israel: Historical Trends (Since 2022) and Forecasted Estimates (Till 2035) (USD Million)
- Table 26.115 Buffer Manufacturing Services Market in Saudi Arabia: Historical Trends (Since 2022) and Forecasted Estimates (Till 2035) (USD Million)
- Table 26.116 Buffer Manufacturing Services Market in Iran: Historical Trends (Since 2022) and Forecasted Estimates (Till 2035) (USD Million)
- Table 26.117 Buffer Manufacturing Services Market in Rest of Middle East and North Africa: Historical Trends (Since 2022) and Forecasted Estimates (Till 2035) (USD Million)
- Table 26.118 Buffer Manufacturing Services Market in Latin America: Historical Trends (Since 2022) and Forecasted Estimates (Till 2035) (USD Million)
- Table 26.119 Buffer Manufacturing Services Market in Brazil: Historical Trends (Since 2022) and Forecasted Estimates (Till 2035) (USD Million)
- Table 26.120 Buffer Manufacturing Services Market in Argentina: Historical Trends (Since 2022) and Forecasted Estimates (Till 2035) (USD Million)
List of Figures
- Figure 2.1 Research Methodology: Project Methodology
- Figure 2.2 Research Methodology: Data Sources for Secondary Research
- Figure 2.3 Research Methodology: Robust Quality Control
- Figure 3.1 Market Dynamics: Forecast Methodology
- Figure 3.2 Market Dynamics: Market Assessment Framework
- Figure 4.1 Lessons Learnt from Past Recessions
- Figure 5.1 Executive Summary: Market Landscape - Buffer Manufacturing Systems
- Figure 5.2 Executive Summary: Market Landscape - Buffer Manufacturing Service Providers
- Figure 5.3 Executive Summary: Partnerships and Collaborations
- Figure 6.1 Types of Novel Buffer Manufacturing Processes
- Figure 6.2 Challenges Associated with Buffer Manufacturing
- Figure 7.1 Buffer Manufacturing Systems: Distribution by Type of Buffer System
- Figure 7.2 Buffer Manufacturing Systems: Distribution by Mode of Operation
- Figure 7.3 Buffer Manufacturing Systems: Distribution by System Mobility
- Figure 7.4 Buffer Manufacturing Systems: Distribution by Key Features
- Figure 7.5 Buffer Manufacturing Systems: Distribution by Integrated Technique
- Figure 7.6 Buffer Manufacturing Systems: Distribution by Buffer Manufacturing Process
- Figure 7.7 Buffer Manufacturing Systems: Distribution by Bioprocessing Method
- Figure 7.8 Buffer Manufacturing System Providers: Distribution by Year of Establishment
- Figure 7.9 Buffer Manufacturing System Providers: Distribution by Company Size
- Figure 7.10 Buffer Manufacturing System Providers: Distribution by Location of Headquarters
- Figure 8.1 Product Competitiveness Analysis: Overview of Peer Group I
- Figure 8.2 Product Competitiveness Analysis: Overview of Peer Group II
- Figure 8.3 Product Competitiveness Analysis: Overview of Peer Group III
- Figure 8.4 Product Competitiveness Analysis: Buffer Manufacturing Systems Offered by Companies based in North America
- Figure 8.5 Product Competitiveness Analysis: Buffer Manufacturing Systems Offered by Companies based in Europe
- Figure 8.6 Product Competitiveness Analysis: Buffer Manufacturing Systems Offered by Companies based in Asia-Pacific
- Figure 9.1 Asahi Kasei: Annual Revenues, FY 2021 Onwards (YEN Billion)
- Figure 9.2 Danaher: Annual Revenues, FY 2022 Onwards (USD Billion)
- Figure 9.3 Merck: Annual Revenues, FY 2022 Onwards (EUR Billion)
- Figure 9.4 Thermo Fisher Scientific: Annual Revenues, FY 2022 Onwards (USD Billion)
- Figure 10.1 Buffer Manufacturing Service Providers: Distribution by Year of Establishment
- Figure 10.2 Buffer Manufacturing Service Providers: Distribution by Company Size
- Figure 10.3 Buffer Manufacturing Service Providers: Distribution by Location of Headquarters
- Figure 10.4 Buffer Manufacturing Service Providers: Distribution by Location of Facilities
- Figure 10.5 Buffer Manufacturing Service Providers: Distribution by Regulatory Compliance
- Figure 10.6 Buffer Manufacturing Service Providers: Distribution by Type of Company
- Figure 10.7 Buffer Manufacturing Service Providers: Distribution by Type of Buffer Provided
- Figure 10.8 Buffer Manufacturing Service Providers: Distribution by Type of Buffer Formulation
- Figure 10.9 Buffer Manufacturing Service Provider: Distribution by Buffer Packaging
- Figure 10.10 Buffer Manufacturing Service Providers: Distribution by Compatible Biologics
- Figure 10.11 Buffer Manufacturing Service Providers: Distribution by Application Area
- Figure 10.12 Buffer Manufacturing Service Providers: Distribution by Additional Service Offered
- Figure 11.1 Company Competitiveness Analysis: Overview of Peer Group I
- Figure 11.2 Company Competitiveness Analysis: Overview of Peer Group II
- Figure 11.3 Company Competitiveness Analysis: Overview of Peer Group III
- Figure 11.4 Company Competitiveness Analysis: Buffer Manufacturing Service Providers based in North America
- Figure 11.5 Company Competitiveness Analysis: Buffer Manufacturing Service Providers based in Europe
- Figure 11.6 Company Competitiveness Analysis: Buffer Manufacturing Service Providers based in Asia-Pacific
- Figure 12.1 Avantor: Annual Revenues, FY 2022 Onwards (USD Billion)
- Figure 12.2 GE Healthcare: Annual Revenues, FY 2022 Onwards (USD Billion)
- Figure 12.3 HOPAX: Annual Revenues, FY 2021 Onwards (TWD Million)
- Figure 12.4 Sartorius: Annual Revenues, FY 2022 Onwards (EUR Billion)
- Figure 13.1 Partnerships and Collaborations: Distribution by Year of Partnership
- Figure 13.2 Partnerships and Collaborations: Distribution by Type of Partnership
- Figure 13.3 Partnerships and Collaborations: Distribution by Year and Type of Partnership
- Figure 13.4 Partnerships and Collaborations: Distribution by Type of Partner
- Figure 13.5 Most Active Players: Distribution by Number of Partnerships
- Figure 13.6 Partnerships and Collaborations: Distribution by Country
- Figure 13.7 Partnerships and Collaborations: Distribution by Region
- Figure 14.1 Global Buffer Manufacturing Systems Market: Historical Trends (Since 2021) and Forecasted Estimates (Till 2035) (USD Billion)
- Figure 14.2 Global Buffer Manufacturing Systems Market, Forecasted Estimates (Till 2035): Conservative Scenario (USD Billion)
- Figure 14.3 Global Buffer Manufacturing Systems Market, Forecasted Estimates (Till 2035): Optimistic Scenario (USD Billion)
- Figure 15.1 Global Buffer Manufacturing Systems Market: Distribution by Scale of Operation
- Figure 15.2 Buffer Manufacturing Systems Market for Preclinical / Clinical Scale: Historical Trends (Since 2021) and Forecasted Estimates (Till 2035) (USD Billion)
- Figure 15.3 Buffer Manufacturing Systems Market for Commercial Scale: Historical Trends (Since 2021) and Forecasted Estimates (Till 2035) (USD Billion)
- Figure 16.1 Buffer Manufacturing Systems Market: Distribution by Type of Buffer System Component
- Figure 16.2 Buffer Manufacturing Systems Market for Single-use Buffer Mixing / Preparation Equipment: Historical Trends (Since 2021) and Forecasted Estimates (Till 2035) (USD Billion)
- Figure 16.3 Buffer Manufacturing Systems Market for Reusable Buffer Mixing / Preparation Equipment: Historical Trends (Since 2021) and Forecasted Estimates (Till 2035) (USD Billion)
- Figure 17.1 Buffer Manufacturing Systems Market: Distribution by Geographical Regions
- Figure 17.2 Buffer Manufacturing Systems Market in North America: Historical Trends (Since 2021) and Forecasted Estimates (Till 2035) (USD Billion)
- Figure 17.3 Buffer Manufacturing Systems Market in the US: Historical Trends (Since 2021) and Forecasted Estimates (Till 2035) (USD Billion)
- Figure 17.4 Buffer Manufacturing Systems Market in Canada: Historical Trends (Since 2021) and Forecasted Estimates (Till 2035) (USD Billion)
- Figure 17.5 Buffer Manufacturing Systems Market in Europe: Historical Trends (Since 2021) and Forecasted Estimates (Till 2035) (USD Billion)
- Figure 17.6 Buffer Manufacturing Systems Market in Germany: Historical Trends (Since 2021) and Forecasted Estimates (Till 2035) (USD Billion)
- Figure 17.7 Buffer Manufacturing Systems Market in France: Historical Trends (Since 2021) and Forecasted Estimates (Till 2035) (USD Billion)
- Figure 17.8 Buffer Manufacturing Systems Market in Italy: Historical Trends (Since 2021) and Forecasted Estimates (Till 2035) (USD Billion)
- Figure 17.9 Buffer Manufacturing Systems Market in Spain: Historical Trends (Since 2021) and Forecasted Estimates (Till 2035) (USD Billion)
- Figure 17.10 Buffer Manufacturing Systems Market in the UK: Historical Trends (Since 2021) and Forecasted Estimates (Till 2035) (USD Billion)
- Figure 17.11 Buffer Manufacturing Systems Market in Rest of Europe: Historical Trends (Since 2021) and Forecasted Estimates (Till 2035) (USD Billion)
- Figure 17.12 Buffer Manufacturing Systems Market in Asia-Pacific: Historical Trends (Since 2021) and Forecasted Estimates (Till 2035) (USD Billion)
- Figure 17.13 Buffer Manufacturing Systems Market in China: Historical Trends (Since 2021) and Forecasted Estimates (Till 2035) (USD Billion)
- Figure 17.14 Buffer Manufacturing Systems Market in South Korea: Historical Trends (Since 2021) and Forecasted Estimates (Till 2035) (USD Billion)
- Figure 17.15 Buffer Manufacturing Systems Market in India: Historical Trends (Since 2021) and Forecasted Estimates (Till 2035) (USD Billion)
- Figure 17.16 Buffer Manufacturing Systems Market in Japan: Historical Trends (Since 2021) and Forecasted Estimates (Till 2035) (USD Billion)
- Figure 17.17 Buffer Manufacturing Systems Market in Rest of Asia-Pacific: Historical Trends (Since 2021) and Forecasted Estimates (Till 2035) (USD Billion)
- Figure 17.18 Buffer Manufacturing Systems Market in Middle East and North Africa: Historical Trends (Since 2021) and Forecasted Estimates (Till 2035) (USD Billion)
- Figure 17.19 Buffer Manufacturing Systems Market in Israel: Historical Trends (Since 2021) and Forecasted Estimates (Till 2035) (USD Billion)
- Figure 17.20 Buffer Manufacturing Systems Market in Saudi Arabia: Historical Trends (Since 2021) and Forecasted Estimates (Till 2035) (USD Billion)
- Figure 17.21 Buffer Manufacturing Systems Market in Iran: Historical Trends (Since 2021) and Forecasted Estimates (Till 2035) (USD Billion)
- Figure 17.22 Buffer Manufacturing Systems Market in Rest of Middle East and North Africa: Historical Trends (Since 2021) and Forecasted Estimates (Till 2035) (USD Billion)
- Figure 17.23 Buffer Manufacturing Systems Market in Latin America: Historical Trends (Since 2021) and Forecasted Estimates (Till 2035) (USD Billion)
- Figure 17.24 Buffer Manufacturing Systems Market in Brazil: Historical Trends (Since 2021) and Forecasted Estimates (Till 2035) (USD Billion)
- Figure 17.25 Buffer Manufacturing Systems Market in Argentina: Historical Trends (Since 2021) and Forecasted Estimates (Till 2035) (USD Billion)
- Figure 18.1 Global Buffer Manufacturing Services Market: Historical Trends (Since 2022) and Forecasted Estimates (Till 2035) (USD Million)
- Figure 18.2 Global Buffer Manufacturing Services Market, Forecasted Estimates (Till 2035): Conservative Scenario (USD Million)
- Figure 18.3 Global Buffer Manufacturing Services Market, Forecasted Estimates (Till 2035): Optimistic Scenario (USD Million)
- Figure 19.1 Global Buffer Manufacturing Services Market: Distribution by Scale of Operation
- Figure 19.2 Buffer Manufacturing Services Market for Preclinical / Clinical Scale: Historical Trends (Since 2022) and Forecasted Estimates (Till 2035) (USD Million)
- Figure 19.3 Buffer Manufacturing Services Market for Commercial Scale: Historical Trends (Since 2022) and Forecasted Estimates (Till 2035) (USD Million)
- Figure 20.1 Global Buffer Manufacturing Services Market: Distribution by Type of Buffer Formulation
- Figure 20.2 Buffer Manufacturing Services Market for Liquid Formulation: Historical Trends (Since 2022) and Forecasted Estimates (Till 2035) (USD Million)
- Figure 20.3 Buffer Manufacturing Services Market for Powder Formulation: Historical Trends (Since 2022) and Forecasted Estimates (Till 2035) (USD Million)
- Figure 21.1 Global Buffer Manufacturing Services Market: Distribution by Type of Molecule
- Figure 21.2 Buffer Manufacturing Services Market for Small Molecules: Historical Trends (Since 2022) and Forecasted Estimates (Till 2035) (USD Million)
- Figure 21.3 Buffer Manufacturing Services Market for Biologics: Historical Trends (Since 2022) and Forecasted Estimates (Till 2035) (USD Million)
- Figure 22.1 Global Buffer Manufacturing Services Market: Distribution by Type of Compatible Biologic
- Figure 22.2 Buffer Manufacturing Services Market for Antibodies: Historical Trends (Since 2022) and Forecasted Estimates (Till 2035) (USD Million)
- Figure 22.3 Buffer Manufacturing Services Market for Vaccines: Historical Trends (Since 2022) and Forecasted Estimates (Till 2035) (USD Million)
- Figure 22.4 Buffer Manufacturing Services Market for Protein / Peptides: Historical Trends (Since 2022) and Forecasted Estimates (Till 2035) (USD Million)
- Figure 22.5 Buffer Manufacturing Services Market for Cell and Gene Therapies: Historical Trends (Since 2022) and Forecasted Estimates (Till 2035) (USD Million)
- Figure 22.6 Buffer Manufacturing Services Market for Other Biologics: Historical Trends (Since 2022) and Forecasted Estimates (Till 2035) (USD Million)
- Figure 23.1 Global Buffer Manufacturing Services Market: Distribution by Type of Buffer Formulation
- Figure 23.2 Buffer Manufacturing Services Market for Bottles: Historical Trends (Since 2022) and Forecasted Estimates (Till 2035) (USD Million)
- Figure 23.3 Buffer Manufacturing Services Market for Bags: Historical Trends (Since 2022) and Forecasted Estimates (Till 2035) (USD Million)
- Figure 23.4 Buffer Manufacturing Services Market for Bioprocess Containers: Historical Trends (Since 2022) and Forecasted Estimates (Till 2035) (USD Million)
- Figure 23.5 Buffer Manufacturing Services Market for Drums: Historical Trends (Since 2022) and Forecasted Estimates (Till 2035) (USD Million)
- Figure 23.6 Buffer Manufacturing Services Market for Other Packagings: Historical Trends (Since 2022) and Forecasted Estimates (Till 2035) (USD Million)
- Figure 24.1 Buffer Manufacturing Services Market: Distribution by Geographical Regions
- Figure 24.2 Buffer Manufacturing Services Market in North America: Historical Trends (Since 2022) and Forecasted Estimates (Till 2035) (USD Million)
- Figure 24.3 Buffer Manufacturing Services Market in the US: Historical Trends (Since 2022) and Forecasted Estimates (Till 2035) (USD Million)
- Figure 24.4 Buffer Manufacturing Services Market in Canada: Historical Trends (Since 2022) and Forecasted Estimates (Till 2035) (USD Million)
- Figure 24.5 Buffer Manufacturing Services Market in Europe: Historical Trends (Since 2022) and Forecasted Estimates (Till 2035) (USD Million)
- Figure 24.6 Buffer Manufacturing Services Market in Germany: Historical Trends (Since 2022) and Forecasted Estimates (Till 2035) (USD Million)
- Figure 24.7 Buffer Manufacturing Services Market in France: Historical Trends (Since 2022) and Forecasted Estimates (Till 2035) (USD Million)
- Figure 24.8 Buffer Manufacturing Services Market in Italy: Historical Trends (Since 2022) and Forecasted Estimates (Till 2035) (USD Million)
- Figure 24.9 Buffer Manufacturing Services Market in Spain: Historical Trends (Since 2022) and Forecasted Estimates (Till 2035) (USD Million)
- Figure 24.10 Buffer Manufacturing Services Market in the UK: Historical Trends (Since 2022) and Forecasted Estimates (Till 2035) (USD Million)
- Figure 24.11 Buffer Manufacturing Services Market in Rest of Europe: Historical Trends (Since 2022) and Forecasted Estimates (Till 2035) (USD Million)
- Figure 24.12 Buffer Manufacturing Services Market in Asia-Pacific: Historical Trends (Since 2022) and Forecasted Estimates (Till 2035) (USD Million)
- Figure 24.13 Buffer Manufacturing Services Market in China: Historical Trends (Since 2022) and Forecasted Estimates (Till 2035) (USD Million)
- Figure 24.14 Buffer Manufacturing Services Market in South Korea: Historical Trends (Since 2022) and Forecasted Estimates (Till 2035) (USD Million)
- Figure 24.15 Buffer Manufacturing Services Market in India: Historical Trends (Since 2022) and Forecasted Estimates (Till 2035) (USD Million)
- Figure 24.16 Buffer Manufacturing Services Market in Japan: Historical Trends (Since 2022) and Forecasted Estimates (Till 2035) (USD Million)
- Figure 24.17 Buffer Manufacturing Services Market in Rest of Asia-Pacific: Historical Trends (Since 2022) and Forecasted Estimates (Till 2035) (USD Million)
- Figure 24.18 Buffer Manufacturing Services Market in Middle East and North Africa: Historical Trends (Since 2022) and Forecasted Estimates (Till 2035) (USD Million)
- Figure 24.19 Buffer Manufacturing Services Market in Israel: Historical Trends (Since 2022) and Forecasted Estimates (Till 2035) (USD Million)
- Figure 24.20 Buffer Manufacturing Services Market in Saudi Arabia: Historical Trends (Since 2022) and Forecasted Estimates (Till 2035) (USD Million)
- Figure 24.21 Buffer Manufacturing Services Market in Iran: Historical Trends (Since 2022) and Forecasted Estimates (Till 2035) (USD Million)
- Figure 24.22 Buffer Manufacturing Services Market in Rest of Middle East and North Africa: Historical Trends (Since 2022) and Forecasted Estimates (Till 2035) (USD Million)
- Figure 24.23 Buffer Manufacturing Services Market in Latin America: Historical Trends (Since 2022) and Forecasted Estimates (Till 2035) (USD Million)
- Figure 24.24 Buffer Manufacturing Services Market in Brazil: Historical Trends (Since 2022) and Forecasted Estimates (Till 2035) (USD Million)
- Figure 24.25 Buffer Manufacturing Services Market in Argentina: Historical Trends (Since 2022) and Forecasted Estimates (Till 2035) (USD Million)
- Figure 25.1 Concluding Remarks: Buffer Manufacturing System Providers Market Landscape
- Figure 25.2 Concluding Remarks: Buffer Manufacturing Service Providers Market Landscape
- Figure 25.3 Concluding Remarks: Partnerships and Collaborations
- Figure 25.4 Concluding Remarks: Market Forecast and Opportunity Analysis
 日本生物製藥市場報告(按適應症(自體免疫疾病、腫瘤、代謝紊亂及其他)、類別(重組蛋白、單株抗體、純化蛋白)和地區分類,2026-2034 年)日本醫藥第三方物流市場報告(按服務、溫度控制和地區分類,2026-2034年)
 生物製藥第三方物流(3PL) 市場規模、佔有率和成長分析(按供應鏈、服務類型和地區分類)-產業預測 (2026-2033)
 生物製藥市場-全球產業規模、佔有率、趨勢、機會及預測(依產品類型、治療應用、地區及競爭格局分類,2020-2030年預測)
 腫瘤生物製藥市場機會、成長促進因素、產業趨勢分析及預測(2025-2034年)
 生質能發酵市場分析及預測(至2034年):類型、產品、技術、應用、最終用戶、組件、製程、部署與能力緩衝溶液製備市場分析及預測(至2034年):類型、產品、服務、技術、應用、形式、材料類型、最終用戶、流程、設備
 緩衝液製備市場按類型、試劑、配方、應用、最終用戶、通路和地區分類
 一次性耗材市場按產品類型、最終用途、應用、材料類型和分銷管道分類-2025-2032年全球預測按治療領域、技術、分銷管道、產品類型、給藥途徑和分銷管道分類的生物製藥市場 - 2025-2032 年全球預測