


 |
市場調查報告書
商品編碼
1821508
生技藥品受託製造市場:2035年前的產業趨勢全球預測 - 各提供服務形式,製造的生技藥品,各使用表現系統,各產業規模,不同企業規模,各主要地區Biologics Contract Manufacturing Market: Industry Trends and Global Forecasts, Till 2035 - Distribution by Type of Service(s) Offered, Biologic Manufactured, Expression System Used, Scale of Operation, Company Size, and Key Geographical Regions |
||||||
生物製劑合約製造市場:概覽
預計2035年,全球生物製劑合約製造市場規模將從目前的238億美元成長至550億美元,預測期間內複合年增長率為8.8%。
市場區隔包括基於以下參數的市場規模和機會分析:
各提供服務形式
- API製造
- FDF製造
按製造的生技藥品
- 抗體
- 細胞治療藥
- 疫苗
- 其他
各使用表現系統
- 哺乳類
- 微生物
- 其他
各產業規模
- 前臨床/臨床
- 商業
不同企業規模
- 小規模
- 中規模
- 大及超大廠
各地區
- 北美
- 歐洲
- 亞太地區
- 中東·北非
- 南美
生物製劑合約製造市場的成長與趨勢
近年來,由於生物製劑具有特異性、有效性和安全性等多項優勢,生物製劑合約製造業經歷了顯著增長。值得注意的是,生物製劑產業從小分子藥物轉向複雜的生物製劑,例如單株抗體、疫苗、細胞和基因療法以及生物相似藥。事實上,美國食品藥物管理局 (FDA) 在 2024 年批准了 50 多種生物製劑(包括單株抗體和重組蛋白)。不斷增長的新療法管道,加上獲準生物製劑數量的增加,正在推動對外部製造能力的需求。
儘管生物製劑取得了成功,但生物製劑的生產在技術上仍面臨挑戰,需要在專門的設施、設備和專業知識方面投入大量資金,同時還要面臨漫長的開發週期、監管和合規問題以及與最終產品質量屬性相關的不一致性。因此,許多生物製劑開發商正在轉向合約製造商尋求全面的解決方案,包括生物製程開發和最佳化。隨著外包成為該領域可行且有利可圖的商業模式,預計生物製劑合約製造市場將在整個預測期內實現顯著成長。
生物製劑合約生產市場關鍵洞察
本報告深入探討了生物製劑合約生產市場的現狀,並識別了行業內的潛在成長機會。主要發現包括:
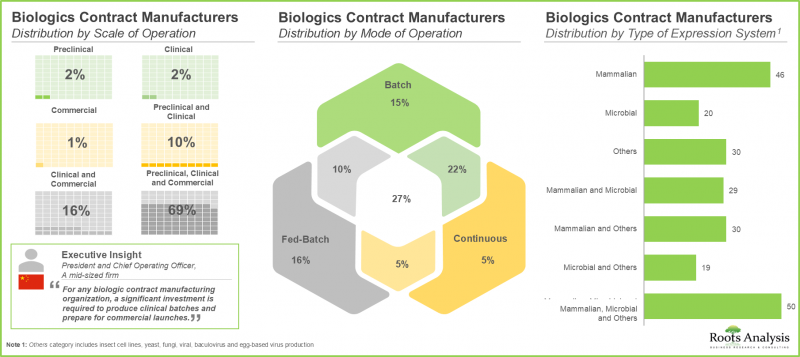
- 目前,超過 305 家合約生產組織 (CMO) 從事生物製劑生產,其中超過 90% 提供 FDF 生產服務。
- 約 70% 的利害關係人經營著各種規模的業務,以滿足客戶的不同需求。尤其是基於哺乳動物細胞的表達系統,已成為 CMO 的熱門選擇。
- 專注於利基藥物類別的服務提供者之間的競爭非常激烈,這主要得益於過去幾種重磅療法的成功。
- 在過去十年中,生物製劑合約製造業發生了動態變化,越來越多的公司在亞太發展中地區建立了生產設施。
- 在過去五年中,生物製劑合約製造已簽署了超過 695 份合同,其中大部分用於生產疫苗、抗體和細胞療法。
- 為了保持競爭力並將自己定位為一站式服務商,新進業者正在擴展其現有的能力和服務組合。
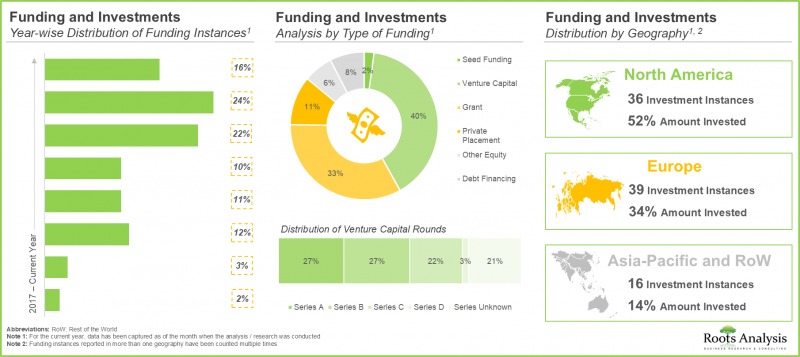
- 鑑於生物製劑合約生產領域蘊藏的巨大機遇,投資者在過去八年中積極參與了超過 90 筆融資交易,累計注入資金 75 億美元。
- 在不斷增長的需求推動下,CMO 積極投資,以擴展其現有產能和能力,主要瞄準利基生物製劑領域。這一趨勢在美國和中國最為明顯。
- 這趨勢在美國和中國最為明顯。大型製藥公司已開展超過 215 項舉措,其中超過 80% 專注於合作和業務擴張。
- 雖然現有產能足以滿足當前生物製劑的年度需求,但CMO可能會投資增加產能以滿足長期需求。
- 全球生物製劑合約生產產能分散在各地區,大型公司佔總產能的80%。
- 由於生物製劑產品線不斷擴大以及外包趨勢日益增強,生物製劑合約生產市場預計將繼續穩定成長。
- 隨著越來越多的研發公司將其製造業務的各個環節外包,預計未來十年生物製劑合約生產市場將以每年8.8%的速度成長。
生物製劑合約生產市場的主要細分市場
依服務類型,市場分為原料藥 (API) 和製劑開發 (FDF)。值得注意的是,原料藥 (API) 目前在生物製劑合約生產市場中佔據主導地位。這是因為生產生物製劑活性藥物成分需要大量的資本投入,包括設備成本(開發和維護)、材料成本、人力成本以及許多其他輔助成本。因此,利害關係人依賴 CMO 在 API 生產方面的專業知識。
依生產的生物製劑類型,市場分為抗體、細胞療法、疫苗和其他生物製劑。值得注意的是,抗體佔據了生物製劑合約生產市場的最大佔有率。這是由於全球已批准 100 多種抗體,且抗體相關臨床試驗的數量不斷增加。
依使用的表達系統,市場分為哺乳動物、微生物和其他。值得注意的是,目前市場很可能由使用哺乳動物表達系統的生物製劑計畫的收入所驅動。這是因為這些系統具有高蛋白質產量、增強的折疊和翻譯後修飾能力以及更高的批次間一致性,因此利用率很高。
依業務規模,市場細分為臨床前/臨床規模及商業規模。預計商業規模生產領域將成為整體市場的主要驅動力。此外,值得注意的是,臨床前/臨床規模生物製劑生產市場可能會以相對較高的複合年增長率成長。
依公司規模,市場細分為小型、中型、大型及超大型公司。雖然大型和超大型公司佔據了相對較高的市場佔有率,但值得注意的是,小型公司的生物製劑合約生產市場在未來幾年可能會經歷顯著的市場成長。
依主要地區劃分,市場分為北美、歐洲、亞太、中東和北非以及拉丁美洲。值得注意的是,預計未來幾年亞太市場將以更高的複合年增長率成長。
生技藥品受託製造市場參與企業案例
- AGC Biologics
- Boehringer Ingelheim
- Catalent
- Cell Therapies
- Charles River Laboratories
- FUJIFILM Diosynth Biotechnologies
- KBI Biopharma
- Kemwell Biopharma
- Lonza
- Miltenyi Biotec
- Minaris Regenerative Medicine
- Samsung Biologics
- Sandoz
- Vetter Pharma
- Wuxi Biologics
1次調查概要
- 本研究中提出的觀點和見解受到與多位利害關係人討論的影響。本研究報告包含對以下產業利害關係人的詳細訪談:
- A公司執行長
- B公司執行長兼聯合創辦人
- C公司細胞與基因治療部門首席技術官
- D公司總裁
- E公司全球策略行銷資深總監
- F公司商業策略與市場洞察資深總監
- G公司全球銷售與行銷主管兼市場開發主管(德國)
- H公司業務發展經理
- I公司行銷與銷售經理
生物製劑合約製造市場研究範圍
- 市場規模和機會分析:本報告按關鍵細分市場對全球生物製劑合約製造市場進行了全面分析:[A] 提供的服務類型,[B] 生產的生物製劑,[C] 使用的表達系統,[D] 企業規模,[E] 公司規模,以及 [F] 主要地區。
- 市場格局:基於若干相關參數對生物製劑合約製造市場相關公司進行深入評估,例如[A] 成立年份、[B] 公司規模、[C] 總部所在地、[D] 提供的服務類型、[E] 生產的生物製劑類型、[F] 運營規模、[G] 使用的表達系統類型、[H] 使用的生物反應器類型、[F] 運營規模、[G] 使用的系統類型、[H] 使用的生物反應器類型、[F] 操作器類型、[G] 使用的生物反應器類型、[H] 使用的生物反應器類型、[G] 使用的生物反應器類型、[H] 使用。
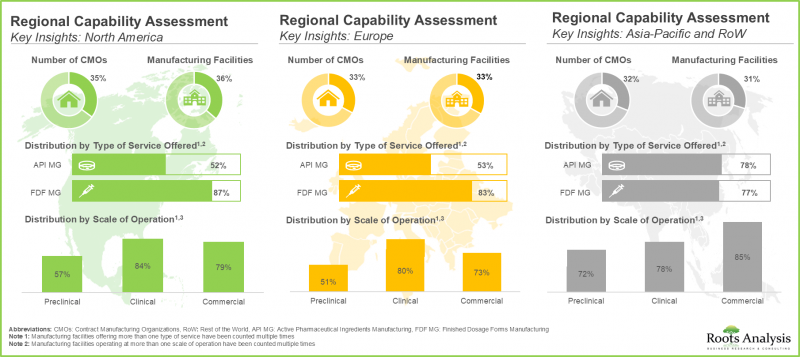
- 區域能力分析:對主要地區(例如[A] 北美、[B] 歐洲、[C] 亞太地區和[D] 亞太其他地區)建立的生物製劑生產設施進行全面分析。
- 公司簡介:北美、歐洲和亞太地區參與生物製劑合約製造市場的主要服務提供者的詳細公司簡介,重點關注[A] 公司概況、[B] 財務資訊(如有)、[C] 服務組合、[D] 生產設施以及[E] 近期發展和未來展望等參數。
- 案例研究 - 利基製藥業:我們專注於特定的利基產品,例如 [A] 抗體藥物偶聯物 (ADC)、[B] 雙特異性抗體、[C] 細胞療法、[D] 基因療法和 [E] 病毒載體,以確定該行業的關鍵推動因素。全面的市場評估。
- 案例研究 - 內部製造:詳細回顧生物製劑開發商在決定是自行生產產品還是利用生物製劑CMO服務時需要考慮的各種因素。
- 自製與外購框架:詳細研究各大製藥公司開展的各種以生物製劑為重點的製造計劃,重點關注各種參數的趨勢,例如:[A] 計劃數量,[B] 計劃年份,[C] 計劃目標,[D] 計劃類型,[E] 運營規模,以及 [F] 生產的生物製劑類型。
- 合作夥伴關係與協作:基於幾個相關參數,詳細分析生物製劑合約製造市場中近期的合作夥伴關係,例如:[A] 合作年份,[B] 合作類型,[C] 生產的生物製劑類型,[D] 治療領域,[E] 最活躍的參與者,以及 [F] 該行業合作活動的區域分佈。
- 併購:基於若干相關參數,對該行業已發生的各類併購進行深入分析,例如[A] 協議年份、[B] 交易類型、[C] 公司區域分析、[D] 收購類型、[E] 生產的生物製劑類型以及[F] 關鍵價值驅動因素。
- 近期擴張:詳細分析生物製劑合約製造商在此期間開展的擴張計劃,並提供若干相關參數信息,例如[A] 擴張年份、[B] 擴張目的、[C] 生產的生物製劑類型以及[D] 擴張設施位置。
- 近期趨勢:分析生物製劑合約製造市場近期趨勢,重點介紹[A] 資本投資資訊和[B] 與生物製劑製造相關的技術進步資訊。
- 產能分析:生物製劑生產總產能的估算,重點在於基於[A]製造商規模、[B]所用表達系統類型和[C]地區劃分的可用產能分佈。
- 需求分析:基於各種相關參數(例如[A]目標患者群體、[B]給藥頻率和[C]劑量強度)對生物製劑年度需求的合理估算。
- 總擁有成本:對生物製劑合約生產總擁有成本的深入分析。
- SWOT分析:詳細的SWOT分析檢視了影響產業發展的相關趨勢、關鍵驅動因素和挑戰。
- 案例研究 - 虛擬製藥:關於虛擬商業模式概念及其在生物製劑產業中的作用的案例研究。
目錄
第1章 序文
第1章 生技藥品受託製造市場概要
第2章 調查手法
第3章 經濟以及其他的計劃特有的考慮事項
第4章 摘要整理
第5章 簡介
- 章概要
- 生技藥品概要
- 用於生物製劑的表現系統
- 生技藥品的製造流程
- 契約製造概要
- 生技藥品製造業務的外包的必要性
- 契約製造合作夥伴選擇時應該考慮的重點
- 未來展望
第6章 市場形勢
- 章概要
- 生技藥品受託製造商:市場形勢
第7章 地區能力分析
- 章概要
- 主要的前提與參數
- 生技藥品受託製造設施概要
- 各地區能力分析:北美的生技藥品受託製造設施
- 各地區能力分析:歐洲的生技藥品受託製造設施
- 各地區能力分析:亞太地區的生技藥品受託製造設施
- 各地區能力分析:其他地區的生技藥品受託製造設施
第8章 北美生技藥品的受託製造
- 章概要
- 美國的生技藥品的契約製造:法規方案
- 北美的大生技藥品CMO
- AGC Biologics
- Catalent
- FUJIFILM Diosynth Biotechnologies
- KBI Biopharma
- Charles River Laboratories
- 北美的其他的主要生技藥品CMO
- Cytiva
- Patheon
- Piramal Pharma Solutions
第9章 歐洲的生技藥品的受託製造
- 章概要
- 歐洲的生技藥品的契約製造:法規方案
- EMA的cGMP法規
- 歐洲的主要生技藥品CMO
- Boehringer Ingelheim (BioXcellence)
- Lonza
- Sandoz
- Vetter Pharma
- Miltenyi Biotec
- 歐洲的其他的主要生技藥品CMO
- Novasep
- Olon
- Rentschler Biopharma
第10章 亞太地區及全球其他地區的生技藥品的受託製造
- 章概要
- 中國的生技藥品的受託製造
- 中國的生技藥品的受託製造:法規方案
- 中國的主要生技藥品CMO
- WuXi Biologics
- 印度的生技藥品的契約製造
- 印度的生技藥品的契約製造:法規方案
- 印度的主要的生技藥品CMO
- Kemwell Biopharma
- 日本的生技藥品的受託製造
- 日本的生技藥品受託製造:法規方案
- 日本的主要的生技藥品CMO
- Minaris Regenerative Medicine
- 韓國的生技藥品的受託製造
- 韓國的生技藥品的受託製造:法規方案
- 韓國的主要的生技藥品CMO
- Samsung Biologics
- 澳洲的生技藥品的契約製造
- 澳洲的生技藥品的契約製造:法規方案
- 澳洲的大生技藥品CMO
- 細胞治療
- 亞太地區及其他地區的主要生技藥品CMO
- AcuraBio(舊稱:Luina Bio)
- Celltrion
- Takara Bio
第11章 最適合的生技藥品部門
- 章概要
- 雙特異性抗體
- 抗體藥物複合體(ADC)
- 細胞治療
- 基因治療
- 病毒載體
- 質體DNA
第12章 案例研究:生物相似藥的外包
- 章概要
- 生物相似藥概要
- 生物相似藥的開發階段
- 生物相似藥的授權相關法規必要條件
- 製造業務的外包的必要性
- 生物相似藥對全球契約製造市場帶來的影響
- 生物相似藥契約製造服務供應商
- 生物相似藥製造業務的外包伴隨的課題
第13章 案例研究:低分子藥和高分子藥/治療方法的比較
- 章概要
- 低分子及高分子醫藥品/治療方法
第14章 案例研究:公司內部製造
第15章 是製造還是購買意思決策架構
第16章 大型製藥公司的配合措施
第17章 夥伴關係和合作
第18章 合併和收購
第19章 最近的擴張
第20章 最近的趨勢
第21章 能力分析
第22章 需求分析
第23章 生技藥品受託製造組織的總持有成本
第24章 全球生技藥品受託製造市場
第25章 生技藥品受託製造市場(各提供服務形式)
第26章 生技藥品受託製造市場(製造的生技藥品)
第27章 生技藥品受託製造市場(各使用表現系統)
第28章 生技藥品受託製造市場(各產業規模)
第29章 生技藥品受託製造市場(不同企業規模)
第30章 生技藥品受託製造市場(各地區)
第31章 生技藥品受託製造市場(各主要企業)
第32章 案例研究:虛擬製藥公司
第33章 SWOT分析
第34章 生技藥品CMO市場未來
第35章 結論
第36章 執行洞察
第37章 附錄I:表資料
第38章 附錄II:企業及組織的一覽
第39章 附錄III:夥伴關係與合作詳情
Biologics Contract Manufacturing Market: Overview
As per Roots Analysis, the global biologics contract manufacturing market is estimated to grow from USD 23.8 billion in the current year to USD 55.0 billion by 2035, at a CAGR of 8.8% during the forecast period, till 2035.
The market sizing and opportunity analysis has been segmented across the following parameters:
Type of Service Offered
- API Manufacturing
- FDF Manufacturing
Type of Biologic Manufactured
- Antibodies
- Cell Therapies
- Vaccines
- Other Biologics
Type of Expression System Used
- Mammalian
- Microbial
- Others
Scale of Operation
- Preclinical / Clincal
- Commercial
Company Size
- Small
- Mid-sized
- Large and Very Large
Geographical Regions
- North America
- Europe
- Asia-Pacific
- Middle East and North Africa
- Latin America
Biologics Contract Manufacturing Market: Growth and Trends
The biologics contract manufacturing sector has seen significant growth in recent years due to the several benefits offered by biological products, such as specificity, efficacy and safety. It is worth mentioning that the biopharmaceutical industry has witnessed a shift from small-molecule drugs to complex biologics like monoclonal antibodies, vaccines, cell and gene therapies, and biosimilars. In fact, the USFDA approved over 50 biological products (including monoclonal antibodies and recombinant proteins) in 2024. This growing pipeline of new therapies, coupled with the increasing number of biologics approvals, drives the demand for external manufacturing capacity.
Despite the success of biopharmaceutical products, producing biologics is technically challenging and requires significant capital investment in specialized facilities, equipment, and expertise, such as long development timelines, regulatory and compliance-related issues, and inconsistencies related to the quality attributes of the final product. As a result, an increasing number of biopharmaceutical drug developers are relying on contract manufacturers for comprehensive solutions, encompassing bioprocess development and optimization. With outsourcing becoming increasingly recognized as a practical and advantageous business model in this sector, substantial market growth for biologics contract manufacturing is expected throughout the forecast period.
Biologics Contract Manufacturing Market: Key Insights
The report delves into the current state of the biologics contract manufacturing market and identifies potential growth opportunities within industry. Some key findings from the report include:
- Currently, more than 305 contract manufacturing organizations (CMOs) are engaged in the production of biologics; over 90% of such players provide FDF manufacturing services.
- Around 70% of the stakeholders operate at all scales of operation to cater to the diverse needs of customers; notably, mammalian cell-based expression systems have emerged as a popular choice among CMOs.
- The competition among service providers that claim to be focused on the niche and upcoming drug classes is fierce; it is primarily influenced by the success of several blockbuster therapies in the recent past.
- In the past decade, a shift in trend has been observed in the biopharmaceutical contract manufacturing industry as more players have set up their manufacturing facilities in developing regions across Asia-Pacific.
- Over the last five years, more than 695 deals have been inked by biologics CMOs; most of the collaborations were inked for the manufacturing of vaccines, antibodies and cell therapies.
- In order to maintain a competitive edge and establish themselves as one-stop-shops, players are expanding their existing capabilities and service portfolios; the domain has witnessed over 135 mergers and acquisitions.
- Considering the enormous opportunities associated with biologics contract manufacturing, investors have actively extended funds, amounting to USD 7.5 billion, across more than 90 funding instances in the past eight years.
- Driven by the growing demand, CMOs have made elaborate investments to expand their existing capacities and capabilities, primarily for niche biologics; this trend is most pronounced in the US and China.
- More than 215 initiatives were undertaken by big pharma players; more than 80% of such initiatives were focused on partnerships and expansions.
- Though the existing installed capacity is sufficient to meet the current annual demand for biologics, we anticipate that CMOs are likely to invest in installing incremental capacity to meet the long-term demand.
- The global installed biopharmaceutical contract manufacturing capacity is spread across various geographies; notably, large players account for 80% of the total capacity.
- With the growing pipeline of biologics and the increased preference for outsourcing, the biopharmaceutical contract manufacturing services market is anticipated to witness steady growth in the foreseen future.
- As more developers outsource various aspects of their respective manufacturing operations, we expect the biologics CMOs market to grow at an annualized rate of 8.8% in the coming decade.
Biologics Contract Manufacturing Market: Key Segments
Contract Manufacturing Market for API is Likely to Dominate the Biologics Contract Manufacturing Market During the Forecast Period
Based on the type of service(s) offered, the market is segmented into API and FDF. It is worth highlighting that majority of the current biologics contract manufacturing market is captured by APIs. This can be attributed to the fact that manufacturing of biopharmaceuticals API demand significant capital investments, which include facility costs (development and maintenance), material costs, labor costs and a number of other ancillary expenses. Therefore, stakeholders rely on the expertise of CMOs for API production.
Cell Therapies is the Fastest Growing Segment of the Biologics Contract Manufacturing Market During the Forecast Period
Based on the type of biologic manufactured, the market is segmented into antibodies, cell therapies, vaccines and other biologics. It is worth highlighting the antibodies capture the maximum share within the biopharmaceutical contract manufacturing market. This can be attributed to the fact that more than 100 antibodies have been approved across the globe and an increasing number of clinical trials related to antibodies are also underway.
Mammalian Expression System is Expected to Capture the Highest Share of the Biologics Contract Manufacturing Market During the Forecast Period
Based on the type of expression system used, the market is segmented into mammalian, microbial and others. It is worth highlighting that currently, the market is likely to be driven by revenues generated through biopharmaceutical projects employing mammalian expression systems. This can be attributed to the higher usage of such systems owing to their high protein yielding ability, enhanced folding and post-translational modifications, and improved batch-to-batch uniformity.
By Scale of Operation, Commercial Scale is Likely to Dominate the Biologics Contract Manufacturing Market During the Forecast Period
Based on the scale of operation, the market is segmented into preclinical / clinical and commercial scale. The commercial scale manufacturing segment is projected to be the primary driver of the overall market. Further, it is worth highlighting that the biologics manufacturing market at preclinical / clinical scale is likely to grow at a relatively higher CAGR.
Large and Very Large Companies Hold Maximum Share within the Biologics Manufacturing Market
Based on company size, the market is segmented into small companies, mid-sized, and large and very large companies. While large and very large companies account for a relatively higher market share, it is worth highlighting that the biologics contract manufacturing market for small companies is likely to witness substantial market growth in the coming years.
North America Accounts for the Largest Share of the Market
Based on key geographical regions, the market is segmented into North America, Europe, Asia-Pacific, Middle East and North Africa, and Latin America. It is worth highlighting that over the years, the market in Asia-Pacific is expected to grow at a higher CAGR.
Example Players in the Biologics Contract Manufacturing Market
- AGC Biologics
- Boehringer Ingelheim
- Catalent
- Cell Therapies
- Charles River Laboratories
- FUJIFILM Diosynth Biotechnologies
- KBI Biopharma
- Kemwell Biopharma
- Lonza
- Miltenyi Biotec
- Minaris Regenerative Medicine
- Samsung Biologics
- Sandoz
- Vetter Pharma
- Wuxi Biologics
Primary Research Overview
- The opinions and insights presented in this study were influenced by discussions conducted with multiple stakeholders. The research report features detailed transcripts of interviews held with the following industry stakeholders:
- Chief Executive Officer, Company A
- Chief Executive Officer and Co-Founder, Company B
- Chief Technical Officer, Cell and Gene Therapy, Company C
- President, Company D
- Senior Director, Global Strategic Marketing, Company E
- Senior Director of Commercial Strategy and Market Insights, Company F
- Global Head of Sales and Marketing and Head of Business Development (Germany), Company G
- Business Development Manager, Company H
- Manager Marketing and Sales, Company I
Biologics Contract Manufacturing Market: Research Coverage
- Market Sizing and Opportunity Analysis: The report features a thorough analysis of the global biologics contract manufacturing market, in terms of the key market segments, including [A] type of service(s) offered, [B] type of biologic manufactured, [C] type of expression system used, [D] scale of operation, [E] company size and [F] key geographical regions.
- Market Landscape: An in-depth assessment of the companies involved in biologics contract manufacturing market, based on several relevant parameters, such as [A] year of establishment, [B] company size, [C] location of headquarters, [D] type of service offered, [E] type of biologic manufactured, [F] scale of operation, [G] type of expression systems used, [H] type of bioreactor used and [I] mode of operation of bioreactor.
- Regional Capability Analysis: A comprehensive analysis of biopharmaceutical manufacturing facilities established across the key geographical regions, such as [A] North America [B] Europe [C] Asia-Pacific, and [D] rest of the world.
- Company Profiles: Detailed profiles of key service providers across North America, Europe and Asia-Pacific engaged in the biologics contract manufacturing market, focused on parameters such as [A] company overview, [B] financial information (if available), [C] service portfolio, [D] manufacturing facilities and [E] recent developments and an informed future outlook.
- Case Study - Niche Pharmaceutical Sectors: A comprehensive evaluation of the primary enablers within this industry, highlighting specific niche products such as [A] antibody-drug conjugates (ADCs), [B] bispecific antibodies, [C] cell therapies, [D] gene therapies, and [E] viral vectors.
- Case Study - In-house Manufacturing: A detailed review of various factors that need to be taken into consideration by biopharmaceutical developers while deciding whether to manufacture their respective products in-house or engage the services of a biologics CMO.
- Make Versus Buy Framework: An elaborate study of the various biopharmaceutical-focused manufacturing initiatives undertaken by top big pharma players, highlighting trends across various parameters, such as [A] number of initiatives, [B] year of initiative, [C] purpose of initiative, [D] type of initiative, [E] scale of operation and [F] type of biologic manufactured.
- Partnerships and Collaborations: An in-depth analysis of the recent collaborations within the biologics contract manufacturing market, based on several relevant parameters, such as [A] year of partnership, [B] type of partnership, [C] type of biologic manufactured, [D] therapeutic area, [E] most active players and [F] regional distribution of partnership activity that have taken place in this industry.
- Mergers and Acquisitions: A detailed analysis of the various mergers and acquisitions that have taken place within this industry, based on several relevant parameters, [A] such as year of agreement, [B] type of deal, [C] geographical location of companies, [D] type of acquisition, [E] type of biologic manufactured and [F] key value drivers.
- Recent Expansions: A detailed analysis of expansion initiatives undertaken by biologics CMO, during the period along with information on several relevant parameters, such as [A] year of expansion, [B] purpose of expansion, [C] type of biologic manufactured and [D] location of expanded facility.
- Recent Developments: An analysis of the recent developments within the biologics contract manufacturing market, highlighting information on the [A] funding investments made and [B] information on the technology advancements related to biomanufacturing.
- Capacity Analysis: An estimate of the overall installed capacity for the manufacturing of biopharmaceuticals, highlighting the distribution of the available capacity, based on [A] size of manufacturer, [B]type of expression system used and [C] geography.
- Demand Analysis: An informed estimate of the annual demand for biologics, based on various relevant parameters, such as [A] target patient population, [B] dosing frequency and [C] dose strength.
- Total Cost of Ownership: A detailed analysis of the total cost of ownership for biologics CMO.
- SWOT Analysis: A discussion on affiliated trends, key drivers and challenges, under an elaborate SWOT analysis, which are likely to impact the industry's evolution.
- Case Study - Virtual Pharmaceutical Companies: A case study on the virtual business model concept, along with its role in the overall biopharmaceutical industry.
Key Questions Answered in this Report
- How many companies are currently engaged in this market?
- Which are the leading companies in this market?
- What factors are likely to influence the evolution of this market?
- What is the current and future market size?
- What is the CAGR of this market?
- How is the current and future market opportunity likely to be distributed across key market segments?
Reasons to Buy this Report
- The report provides a comprehensive market analysis, offering detailed revenue projections of the overall market and its specific sub-segments. This information is valuable to both established market leaders and emerging entrants.
- Stakeholders can leverage the report to gain a deeper understanding of the competitive dynamics within the market. By analyzing the competitive landscape, businesses can make informed decisions to optimize their market positioning and develop effective go-to-market strategies.
- The report offers stakeholders a comprehensive overview of the market, including key drivers, barriers, opportunities, and challenges. This information empowers stakeholders to stay abreast of market trends and make data-driven decisions to capitalize on growth prospects.
Additional Benefits
- Complimentary PPT Insights Packs
- Complimentary Excel Data Packs for all Analytical Modules in the Report
- 15% Free Content Customization
- Detailed Report Walkthrough Session with Research Team
- Free Updated report if the report is 6-12 months old or older
TABLE OF CONTENTS
1. PREFACE
1.1. Biopharmaceutical Contract Manufacturing Market Overview
- 1.2. Key Market Insights
- 1.3. Scope of the Report
- 1.4. Research Methodology
- 1.5. Key Questions Answered
- 1.6. Chapter Outlines
2. RESEARCH METHODOLOGY
- 2.1. Chapter Overview
- 2.2. Research Assumptions
- 2.3. Project Methodology
- 2.4. Forecast Methodology
- 2.5. Robust Quality Control
- 2.6. Key Market Segmentations
- 2.7. Key Considerations
- 2.7.1. Demographics
- 2.7.2. Economic Factors
- 2.7.3. Government Regulations
- 2.7.4. Supply Chain
- 2.7.5. COVID Impact / Related Factors
- 2.7.6. Market Access
- 2.7.7. Healthcare Policies
- 2.7.8. Industry Consolidation
3. ECONOMIC AND OTHER PROJECT SPECIFIC CONSIDERATIONS
- 3.1. Chapter Overview
- 3.2. Market Dynamics
- 3.2.1. Time Period
- 3.2.1.1. Historical Trends
- 3.2.1.2. Current and Forecasted Estimates
- 3.2.2. Currency Coverage
- 3.2.2.1. Overview of Major Currencies Affecting the Market
- 3.2.2.2. Impact of Currency Fluctuations on the Industry
- 3.2.3. Foreign Exchange Impact
- 3.2.3.1. Evaluation of Foreign Exchange Rates and Their Impact on Market
- 3.2.3.2. Strategies for Mitigating Foreign Exchange Risk
- 3.2.4. Recession
- 3.2.4.1. Historical Analysis of Past Recessions and Lessons Learnt
- 3.2.4.2. Assessment of Current Economic Conditions and Potential Impact on the Market
- 3.2.5. Inflation
- 3.2.5.1. Measurement and Analysis of Inflationary Pressures in the Economy
- 3.2.5.2. Potential Impact of Inflation on the Market Evolution
- 3.2.1. Time Period
4. EXECUTIVE SUMMARY
5. INTRODUCTION
- 5.1. Chapter Overview
- 5.2. Overview of Biopharmaceuticals
- 5.3. Expression Systems for Biopharmaceuticals
- 5.3.1. Insect Expression Systems
- 5.3.2. Mammalian Expression Systems
- 5.3.3. Microbial Expression Systems
- 5.3.3.1. Bacterial Expression Systems
- 5.3.3.2. Fungal Expression Systems
- 5.3.3.3. Yeast Expression Systems
- 5.3.4. Plant Expression Systems
- 5.3.5. Mammalian versus Microbial Expression Systems
- 5.4. Manufacturing Process of Biopharmaceuticals
- 5.4.1. Upstream Processing
- 5.4.2. Fermentation
- 5.4.3. Downstream Processing
- 5.5. Overview of Contract Manufacturing
- 5.6. Need for Outsourcing Biopharmaceutical Manufacturing Operations
- 5.6.1. Commonly Outsourced Manufacturing Operations for Biopharmaceuticals
- 5.6.2. Advantages of Outsourcing Biopharmaceutical Manufacturing Operations
- 5.6.3. Risks and Challenges Associated with Outsourcing Biopharmaceutical Manufacturing Operations
- 5.7. Key Considerations While Selecting a Contract Manufacturing Partner
- 5.8. Future Perspectives
6. MARKET LANDSCAPE
- 6.1. Chapter Overview
- 6.2. Biopharmaceutical Contract Manufacturers: Overall Market Landscape
- 6.2.1. Analysis by Year of Establishment
- 6.2.2. Analysis by Company Size
- 6.2.3. Analysis by Location of Headquarters
- 6.2.4. Analysis by Type of Service Offered
- 6.2.5. Analysis by Type of Biologic Manufactured
- 6.2.6. Analysis by Scale of Operation
- 6.2.7. Analysis by Type of Expression System Used
- 6.2.8. Analysis by Type of Bioreactor Used
- 6.2.9. Analysis by Mode of Operation of Bioreactor
7. REGIONAL CAPABILITY ANALYSIS
- 7.1. Chapter Overview
- 7.2. Key Assumptions and Parameter
- 7.3. Overview of Biopharmaceutical Contract Manufacturing Facilities
- 7.3.1. Analysis by Type of Service Offered
- 7.3.2. Analysis by Scale of Operation
- 7.4. Regional Capability Analysis: Biopharmaceutical Contract Manufacturing Facilities in North America
- 7.5. Regional Capability Analysis: Biopharmaceutical Contract Manufacturing Facilities in Europe
- 7.6. Regional Capability Analysis: Biopharmaceutical Contract Manufacturing Facilities in Asia-Pacific
- 7.7. Regional Capability Analysis: Biopharmaceutical Contract Manufacturing Facilities in Rest of the World
8. BIOPHARMACEUTICAL CONTRACT MANUFACTURING IN NORTH AMERICA
- 8.1. Chapter Overview
- 8.2. Biopharmaceutical Contract Manufacturing in the US: Regulatory Scenario
- 8.3. Leading Biopharmaceutical CMOs in North America
- 8.3.1. AGC Biologics
- 8.3.1.1. Company Overview
- 8.3.1.2. Service Portfolio
- 8.3.1.2.1. Process Development
- 8.3.1.2.2. cGMP Manufacturing
- 8.3.1.2.3. Quality and Regulatory Services
- 8.3.1.2.4. Process Validation
- 8.3.1.3. Financial Information
- 8.3.1.4. Manufacturing Facilities
- 8.3.1.5. Recent Developments and Future Outlook
- 8.3.2. Catalent
- 8.3.2.1. Company Overview
- 8.3.2.2. Service Portfolio
- 8.3.2.2.1. Cell Line Development
- 8.3.2.2.2. Biomanufacturing
- 8.3.2.2.3. ADCs and Bioconjugates Manufacturing
- 8.3.2.2.4. Biosimilars Development and Manufacturing
- 8.3.2.2.5. Fill / Finish Solutions and Delivery Services
- 8.3.2.2.6. Analytical Services
- 8.3.2.3. Clinical Supply Services
- 8.3.2.4. Financial Information
- 8.3.2.5. Manufacturing Facilities
- 8.3.2.6. Recent Developments and Future Outlook
- 8.3.3. FUJIFILM Diosynth Biotechnologies
- 8.3.3.1. Company Overview
- 8.3.3.2. Service Portfolio
- 8.3.3.2.1. Strain Development
- 8.3.3.2.2. Process Development
- 8.3.3.2.3. cGMP Manufacturing
- 8.3.3.2.4. Analytical Solutions
- 8.3.3.3. Financial Information
- 8.3.3.4. Manufacturing Facilities
- 8.3.3.5. Recent Developments and Future Outlook
- 8.3.4. KBI Biopharma
- 8.3.4.1. Company Overview
- 8.3.4.2. Service Portfolio
- 8.3.4.2.1. Process Development
- 8.3.4.2.2. Analytical Development
- 8.3.4.2.3. GMP Manufacturing
- 8.3.4.2.4. Clinical Cell Therapy Support
- 8.3.4.3. Manufacturing Facilities
- 8.3.4.4. Recent Developments and Future Outlook
- 8.3.5. Charles River Laboratories
- 8.3.5.1. Company Overview
- 8.3.5.2. Service Portfolio
- 8.3.5.2.1. Cell Sourcing
- 8.3.5.2.2. Cell and Gene Therapy Solutions
- 8.3.5.2.3. Biologics Testing Solutions
- 8.3.5.2.4. Avian Vaccine Services
- 8.3.5.2.5. QC Microbial Solutions
- 8.3.5.2.6. Scientific and Regulatory Advisory Services
- 8.3.5.3. Financial Information
- 8.3.5.4. Manufacturing Facilities
- 8.3.5.5. Recent Developments and Future Outlook
- 8.3.1. AGC Biologics
- 8.4. Other Leading Biopharmaceutical CMOs in North America
- 8.4.1. Cytiva
- 8.4.1.1. Company Overview
- 8.4.2. Patheon
- 8.4.2.1. Company Overview
- 8.4.3. Piramal Pharma Solutions
- 8.4.3.1. Company Overview
- 8.4.1. Cytiva
9. BIOPHARMACEUTICAL CONTRACT MANUFACTURING IN EUROPE
- 9.1. Chapter Overview
- 9.2. Biopharmaceutical Contract Manufacturing in Europe: Regulatory Scenario
- 9.2.1. EMA's cGMP Regulations
- 9.3. Leading Biopharmaceutical CMOs in Europe
- 9.3.1. Boehringer Ingelheim (BioXcellence)
- 9.3.1.1. Company Overview
- 9.3.1.2. Service Portfolio
- 9.3.1.2.1. Process Development
- 9.3.1.2.1.1. Expression Systems
- 9.3.1.2.1.2. Upstream Technology
- 9.3.1.2.1.3. Downstream Technology
- 9.3.1.2.1.4. Other Process Development Services
- 9.3.1.2.2. Quality Assurance
- 9.3.1.2.3. Fill / Finish Services
- 9.3.1.2.1. Process Development
- 9.3.1.3. Financial Information
- 9.3.1.4. Manufacturing Facilities
- 9.3.1.5. Recent Developments and Future Outlook
- 9.3.2. Lonza
- 9.3.2.1. Company Overview
- 9.3.2.2. Service Portfolio
- 9.3.2.3. Manufacturing Services
- 9.3.2.4. Financial Information
- 9.3.2.5. Manufacturing Facilities
- 9.3.2.6. Recent Developments and Future Outlook
- 9.3.3. Sandoz
- 9.3.3.1. Company Overview
- 9.3.3.2. Service Portfolio
- 9.3.3.3. Financial Information
- 9.3.3.4. Manufacturing Facilities
- 9.3.3.5. Recent Developments and Future Outlook
- 9.3.4. Vetter Pharma
- 9.3.4.1. Company Overview
- 9.3.4.2. Service Portfolio
- 9.3.4.3. Manufacturing Facilities
- 9.3.4.4. Recent Developments and Future Outlook
- 9.3.5. Miltenyi Biotec
- 9.3.5.1. Company Overview
- 9.3.5.2. Service Portfolio
- 9.3.5.3. Manufacturing Facilities
- 9.3.5.4. Recent Developments and Future Outlook
- 9.3.1. Boehringer Ingelheim (BioXcellence)
- 9.4. Other Leading Biopharmaceutical CMOs in Europe
- 9.4.1. Novasep
- 9.4.1.1. Company Overview
- 9.4.2. Olon
- 9.4.2.1. Company Overview
- 9.4.3. Rentschler Biopharma
- 9.4.3.1. Company Overview
- 9.4.1. Novasep
10. BIOPHARMACEUTICAL CONTRACT MANUFACTURING IN ASIA-PACIFIC AND REST OF THE WORLD
- 10.1. Chapter Overview
- 10.2. Biopharmaceutical Contract Manufacturing in China
- 10.2.1. Biopharmaceutical Contract Manufacturing in China: Regulatory Scenario
- 10.3. Leading Biopharmaceutical CMOs in China
- 10.3.1. WuXi Biologics
- 10.3.1.1. Company Overview
- 10.3.1.2. Service Portfolio
- 10.3.1.2.1. Discovery Services
- 10.3.1.2.2. Development Services
- 10.3.1.2.3. Testing Services
- 10.3.1.2.4. Clinical Manufacturing Services
- 10.3.1.3. Financial Information
- 10.3.1.4. Manufacturing Facilities
- 10.3.1.5. Recent Developments and Future Outlook
- 10.3.1. WuXi Biologics
- 10.4. Biopharmaceutical Contract Manufacturing in India
- 10.4.1. Biopharmaceutical Contract Manufacturing in India: Regulatory Scenario
- 10.5. Leading Biopharmaceutical CMOs in India
- 10.5.1. Kemwell Biopharma
- 10.5.1.1. Company Overview
- 10.5.1.2. Service Portfolio
- 10.5.1.2.1. Development Services for Biopharmaceuticals
- 10.5.1.2.2. Manufacturing Services for Biopharmaceuticals
- 10.5.1.3. Manufacturing Facilities
- 10.5.1.4. Recent Developments and Future Outlook
- 10.5.1. Kemwell Biopharma
- 10.6. Biopharmaceutical Contract Manufacturing in Japan
- 10.6.1. Biopharmaceutical Contract Manufacturing in Japan: Regulatory Scenario
- 10.7. Leading Biopharmaceutical CMOs in Japan
- 10.7.1. Minaris Regenerative Medicine
- 10.7.1.1. Company Overview
- 10.7.1.2. Service Portfolio
- 10.7.1.2.1. Manufacturing Development Services
- 10.7.1.2.2. GMP Manufacturing
- 10.7.1.3. Manufacturing Facilities
- 10.7.1.4. Recent Developments and Future Outlook
- 10.7.1. Minaris Regenerative Medicine
- 10.8. Biopharmaceutical Contract Manufacturing in South Korea
- 10.8.1. Biopharmaceutical Contract Manufacturing in South Korea: Regulatory Scenario
- 10.9. Leading Biopharmaceutical CMOs in South Korea
- 10.9.1. Samsung Biologics
- 10.9.1.1. Company Overview
- 10.9.1.2. Service Portfolio
- 10.9.1.2.1. Process Development
- 10.9.1.2.2. Analytical Services
- 10.9.1.2.3. cGMP Manufacturing Services
- 10.9.1.2.4. Aseptic Fill / Finish Services
- 10.9.1.2.5. Quality Services
- 10.9.1.3. Financial Information
- 10.9.1.4. Manufacturing Facilities
- 10.9.1.5. Recent Developments and Future Outlook
- 10.9.1. Samsung Biologics
- 10.10. Biopharmaceutical Contract Manufacturing in Australia
- 10.10.1. Biopharmaceutical Contract Manufacturing in Australia: Regulatory Scenario
- 10.11. Leading Biopharmaceutical CMOs in Australia
- 10.11.1. Cell Therapies
- 10.11.1.1. Company Overview
- 10.11.1.2. Service Portfolio
- 10.11.1.3. Manufacturing Facilities
- 10.11.1.4. Recent Developments and Future Outlook
- 10.11.1. Cell Therapies
- 10.12. Other Leading Biopharmaceutical CMOs in Asia-Pacific and Rest of the World
- 10.12.1. AcuraBio (Formerly Known as Luina Bio)
- 10.12.1.1. Company Overview
- 10.12.2. Celltrion
- 10.12.2.1. Company Overview
- 10.12.3. Takara Bio
- 10.12.3.1. Company Overview
- 10.12.1. AcuraBio (Formerly Known as Luina Bio)
11. NICHE BIOPHARMACEUTICAL SECTORS
- 11.1. Chapter Overview
- 11.2. Bispecific Antibodies
- 11.2.1. Approved and Clinical Bispecific Antibody Therapeutics: Overall Market Landscape
- 11.2.2. Bispecific Antibodies: Pipeline Analysis
- 11.2.2.1. Analysis by Phase of Development
- 11.2.2.2. Analysis by Target Indication
- 11.2.3. Bispecific Antibody Therapeutics: Technology Platforms
- 11.2.4. Key Considerations for Manufacturing and Associated Challenges
- 11.2.5. Role of CMOs in Offering Services for Bispecific Antibodies
- 11.2.5.1. CMOs Offering Services for Bispecific Antibodies
- 11.3. Antibody Drug Conjugates (ADCs)
- 11.3.1. Components of ADCs
- 11.3.1.1. Antibody
- 11.3.1.2. Cytotoxin
- 11.3.1.3. Linker
- 11.3.2. Antibody Drug Conjugates (ADCs): Pipeline Analysis
- 11.3.2.1. Analysis by Status of Development
- 11.3.2.2. Analysis by Target Disease Indication
- 11.3.2.3. Most Active Players: Analysis by Number of Therapies
- 11.3.3. Antibody Drug Conjugate Developers
- 11.3.4. Manufacturing Process
- 11.3.1. Components of ADCs
- 11.4. Cell Therapies
- 11.4.1. Cell Therapies: Overall Market Landscape
- 11.4.2. Overview of Cell Therapy Manufacturing
- 11.4.2.1. Cell Therapy Manufacturing Models
- 11.4.2.1.1. Centralized Manufacturing
- 11.4.2.1.2. Decentralized Manufacturing
- 11.4.2.1. Cell Therapy Manufacturing Models
- 11.4.3. Key Challenges for Manufacturing Cell Therapies
- 11.4.4. Key Factors Impacting Cell Therapy Manufacturing
- 11.4.4.1. Characterization
- 11.4.4.2. Cost of Goods
- 11.4.4.3. Automation of Cell Therapy Manufacturing
- 11.4.5. Cell Therapies: Pipeline Analysis
- 11.4.5.1. Analysis by Type of Cell Manufactured
- 11.4.6. Stem Cell Therapies: Analysis by Phase of Development
- 11.4.7. T-Cell Therapies: Analysis by Phase of Development
- 11.4.8. Role of CMOs in Offering Services for Cell Therapies
- 11.4.8.1. CMOs Offering Services for Cell Therapies
- 11.5. Gene Therapies
- 11.5.1. Gene Therapies: Pipeline Analysis
- 11.5.1.1. Analysis by Stage of Development
- 11.5.1.2. Analysis by Phase of Development
- 11.5.1.3. Analysis by Type of Vector Used
- 11.5.1.3.1. Clinical Pipeline
- 11.5.1.3.2. Preclinical Pipeline
- 11.5.1.4. Analysis by Therapeutic Area
- 11.5.1.4.1. Clinical and Commercial Pipeline
- 11.5.1.4.2. Preclinical Pipeline
- 11.5.2. Role of CMOs in Offering Services for Gene Therapies
- 11.5.2.1. CMOs Offering Services for Gene Therapies
- 11.5.1. Gene Therapies: Pipeline Analysis
- 11.6. Viral Vectors
- 11.6.1. Viral Vectors: Pipeline Analysis
- 11.6.1.1. Analysis by Location of Viral Vectors Manufacturing Facilities
- 11.6.1.2. Analysis by Type of Viral Vector Manufactured
- 11.6.2. Role of CMOs in Offering Services for Viral Vectors
- 11.6.2.1. CMOs Offering Services for Viral Vectors
- 11.6.1. Viral Vectors: Pipeline Analysis
- 11.7. Plasmid DNA
- 11.7.1. Plasmid DNA: Pipeline Analysis
- 11.7.1.1. Analysis by Location of Manufacturing Facilities
- 11.7.2. Role of CMOs in Offering Services for Plasmid DNA
- 11.7.2.1. CMOs Offering Services for Plasmid DNA
- 11.7.1. Plasmid DNA: Pipeline Analysis
12. CASE STUDY: OUTSOURCING OF BIOSIMILARS
- 12.1. Chapter Overview
- 12.2. Overview of Biosimilars
- 12.3. Development Stages of Biosimilars
- 12.4. Regulatory Requirements for Licensing of Biosimilars
- 12.5. Need for Outsourcing Manufacturing Operations
- 12.6. Impact of Biosimilars on the Global Contract Manufacturing Market
- 12.6.1. Biosimilars: Historical Trend of FDA Approvals
- 12.7. Biosimilars Contract Manufacturing Service Providers
- 12.8. Challenges Associated with Outsourcing of Biosimilar Manufacturing Operations
13. CASE STUDY: COMPARISON OF SMALL AND LARGE MOLECULE DRUGS / THERAPIES
- 13.1. Chapter Overview
- 13.2. Small Molecule and Large Molecule Drugs / Therapies
- 13.2.1. Comparison of General Characteristics
- 13.2.2. Comparison of Key Specifications
- 13.2.3. Comparison of Manufacturing Process
- 13.2.4. Comparison of Key Manufacturing Challenges
14. CASE STUDY: IN-HOUSE MANUFACTURING
- 14.1. Chapter Overview
- 14.2. In-House Manufacturing
- 14.2.1. Benefits Associated with In-House Manufacturing
- 14.2.2. Risks Associated with In-House Manufacturing
- 14.3. Outsourcing Trends in the Biopharmaceutical Industry
- 14.3.1. Types of Outsourcing Partners
- 14.4. Manufacturing Approaches Used for Approved Biologics
- 14.5. Choosing the Right Strategy: In-House Manufacturing versus Outsourcing
15. MAKE VERSUS BUY DECISION MAKING FRAMEWORK
- 15.1. Chapter Overview
- 15.2. Key Assumptions and Parameters
- 15.3. Biopharmaceutical Contract Manufacturers: Make versus Buy Decision Making
- 15.3.1. Scenario 1
- 15.3.2. Scenario 2
- 15.3.3. Scenario 3
- 15.3.4. Scenario 4
- 15.4. Conclusion
16. BIG PHARMA INITIATIVES
- 16.1. Chapter Overview
- 16.2. Biopharmaceutical Related Initiatives by Big Pharmaceutical Players
- 16.2.1. Analysis by Number of Initiatives
- 16.2.2. Analysis by Year of Initiative
- 16.2.3. Analysis by Purpose of Initiative
- 16.2.4. Analysis by Type of Initiative
- 16.2.4.1. Analysis by Type of Partnership
- 16.2.4.2. Analysis by Type of Expansion
- 16.2.5. Analysis by Scale of Operation
- 16.2.6. Analysis by Type of Biologic Manufactured
- 16.2.7. Analysis of Big Pharma Players by Year of Initiative
- 16.2.8. Analysis of Big Pharma Players by Purpose of Initiative
- 16.2.9. Analysis by Year and Type of Initiative
- 16.2.10. Analysis of Big Pharma Players by Region of Expansion
- 16.2.11. Analysis of Big Pharma Players by Type of Biologic Manufactured
17. PARTNERSHIPS AND COLLABORATIONS
- 17.1. Chapter Overview
- 17.2. Partnership Models
- 17.3. Biopharmaceutical Contract Manufacturing: Partnerships and Collaborations
- 17.3.1. Analysis by Year of Partnership
- 17.3.2. Analysis by Type of Partnership
- 17.3.3. Analysis by Year and Type of Partnership
- 17.3.4. Analysis by Type of Biologic Manufactured
- 17.3.5. Analysis by Year of Partnership and Type of Biologic Manufactured
- 17.3.6. Analysis by Type of Partnership and Type of Biologic Manufactured
- 17.3.7. Analysis by Scale of Operation
- 17.3.8. Analysis by Therapeutic Area
- 17.3.9. Most Active Players: Analysis by Number of Partnerships
- 17.3.10. Analysis by Geography
- 17.3.10.1. Local and International Agreements
- 17.3.10.2. Intracontinental and Intercontinental Agreements
18. MERGERS AND ACQUISITIONS
- 18.1. Chapter Overview
- 18.2. Merger and Acquisition Models
- 18.3. Biopharmaceutical Contract Manufacturing: Mergers and Acquisitions
- 18.3.1. Cumulative Year-wise Trend of Mergers and Acquisitions
- 18.3.2. Analysis by Type of Acquisition
- 18.3.3. Analysis by Geography
- 18.3.3.1. Local and International Mergers and Acquisitions
- 18.3.3.2. Intracontinental and Intercontinental Mergers and Acquisitions
- 18.3.3.3. Year-wise Trend in North America, Europe and Asia-Pacific
- 18.3.4. Most Active Acquirers: Analysis by Number of Acquisitions
- 18.3.5. Analysis by Key Value Drivers
- 18.3.6. Analysis by Year of Acquisition and Key Value Drivers
- 18.3.7. Analysis by Type of Biologic Manufactured
- 18.3.8. Analysis by Key Value Drivers and Type of Biologic Manufactured
- 18.4. Key Acquisitions: Deal Multiples
- 18.4.1. Year-wise Trend of Deal Multiple Amount
19. RECENT EXPANSIONS
- 19.1. Chapter Overview
- 19.2. Biopharmaceutical Contract Manufacturing: Recent Expansions
- 19.2.1. Analysis by Year of Expansion
- 19.2.2. Analysis by Purpose of Expansion
- 19.2.3. Analysis by Year and Purpose of Expansion
- 19.2.4. Analysis by Type of Biologic Manufactured
- 19.2.5. Analysis by Purpose of Expansion and Type of Biologic Manufactured
- 19.2.6. Analysis by Location of Expanded Facility
- 19.2.7. Most Active Players: Analysis by Number of Recent Expansions
- 19.2.8. Analysis by Purpose of Expansion and Location of Expanded Facility
- 19.2.9. Analysis by Amount Invested
- 19.2.10. Recent Expansions: Scenarios
20. RECENT DEVELOPMENTS
- 20.1. Chapter Overview
- 20.2. Types of Funding
- 20.3. Biopharmaceutical Contract Manufacturing: Funding and Investment Analysis
- 20.3.1. Analysis by Year of Funding
- 20.3.2. Analysis by Amount Invested
- 20.3.3. Analysis by Type of Funding
- 20.3.4. Analysis by Year and Type of Funding
- 20.3.5. Analysis of Funding Instances and Amount Invested by Geography (Continent)
- 20.3.6. Analysis of Funding Instances and Amount Invested by Geography (Country)
- 20.3.7. Most Active Players: Analysis by Number of Funding Instances
- 20.3.8. Most Active Players: Analysis by Total Amount Raised
- 20.3.9. Leading Investors: Analysis by Number of Funding Instances
- 20.3.10. Leading Investors: Analysis by Total Amount Raised
- 20.4. Technological Advancements
- 20.4.1. Single-Use Technology
- 20.4.2. Process Analytical Technology (PAT)
- 20.4.3. Continuous Processing
- 20.4.4. Quality by Design (QbD) in Bio-processing
- 20.4.5. Modular / Podular Biopharma Facilities
21. CAPACITY ANALYSIS
- 21.1. Chapter Overview
- 21.2. Key Assumptions and Methodology
- 21.3. Biopharmaceutical Contract Manufacturing: Global Installed Capacity
- 21.3.1. Analysis by Company Size
- 21.3.2. Analysis by Type of Expression System Used
- 21.3.3. Analysis by Geography
- 21.3.3.1. Analysis of Biopharmaceutical Contract Manufacturing Capacity in North America
- 21.3.3.2. Analysis of Biopharmaceutical Contract Manufacturing Capacity in Europe
- 21.3.3.3. Analysis of Biopharmaceutical Contract Manufacturing Capacity in Asia-Pacific
- 21.3.3.4. Analysis of Biopharmaceutical Contract Manufacturing Capacity in Rest of the World
- 21.4. Concluding Remarks
22. DEMAND ANALYSIS
- 22.1. Chapter Overview
- 22.2. Key Assumptions and Methodology
- 22.3. Global Demand for Biopharmaceuticals
- 22.4. Global Demand for Emerging Novel Biologics
- 22.4.1. Global Demand for ADC Therapeutics
- 22.4.2. Global Demand for Cell Therapy Manufacturing
23. TOTAL COST OF OWNERSHIP FOR BIOPHARMACEUTICAL CONTRACT MANUFACTURING ORGANIZATIONS
- 23.1. Chapter Overview
- 23.2. Key Parameters
- 23.3. Assumptions and Methodology
- 23.4. Total Cost of Ownership (Sample Dataset)
- 23.5. Total Cost of Ownership for Mid-sized Biopharmaceutical Contract Manufacturing Organizations, Y0-Y20
- 23.5.1. Total Cost of Ownership for Mid-sized Biopharmaceutical Contract Manufacturing Organizations: Analysis by CAPEX, Y0
- 23.5.2. Total Cost of Ownership for Mid-sized Biopharmaceutical Contract Manufacturing Organizations: Analysis by OPEX, Y1-Y20
- 23.6. Total Cost of Ownership for Large / Very Large Biopharmaceutical Contract Manufacturing Organizations, Y0-Y20
- 23.6.1. Total Cost of Ownership for Large / Very Large Biopharmaceutical Contract Manufacturing Organizations: Analysis by CAPEX, Y0
- 23.6.2. Total Cost of Ownership for Large / Very Large Biopharmaceutical Contract Manufacturing Organizations: Analysis by OPEX, Y1-Y20
24. GLOBAL BIOPHARMACEUTICAL CONTRACT MANUFACTURING MARKET
- 24.1. Chapter Overview
- 24.2. Assumptions and Methodology
- 24.3. Global Biopharmaceutical Contract Manufacturing Market, Historical Trends (Since 2018) and Forecasted Estimates (till 2035)
- 24.3.1. Scenario Analysis
- 24.3.1.1. Conservative Scenario
- 24.3.1.2. Optimistic Scenario
- 24.3.1. Scenario Analysis
- 24.4. Key Market Segmentations
25. BIOPHARMACEUTICAL CONTRACT MANUFACTURING MARKET, BY TYPE OF SERVICE OFFERED
- 25.1. Chapter Overview
- 25.2. Key Assumptions and Methodology
- 25.3. Biopharmaceutical Contract Manufacturing Market: Distribution by Type of Service Offered, 2018, Current Year and 2035
- 25.3.1. API Manufacturing: Historical Trends (Since 2018) and Forecasted Estimates (till 2035)
- 25.3.2. FDF Manufacturing: Historical Trends (Since 2018) and Forecasted Estimates (till 2035)
- 25.4. Data Triangulation and Validation
26. BIOPHARMACEUTICAL CONTRACT MANUFACTURING MARKET, BY TYPE OF BIOLOGIC MANUFACTURED
- 26.1. Chapter Overview
- 26.2. Key Assumptions and Methodology
- 26.3. Biopharmaceutical Contract Manufacturing Market: Distribution by Type of Biologic Manufactured, 2018, Current Year and 2035
- 26.3.1. Antibodies: Historical Trends (Since 2018) and Forecasted Estimates (till 2035)
- 26.3.2. Cell Therapies: Historical Trends (Since 2018) and Forecasted Estimates (till 2035)
- 26.3.3. Vaccines: Historical Trends (Since 2018) and Forecasted Estimates (till 2035)
- 26.3.4. Other Biologics: Historical Trends (Since 2018) and Forecasted Estimates (till 2035)
- 26.4. Data Triangulation and Validation
27. BIOPHARMACEUTICAL CONTRACT MANUFACTURING MARKET, BY TYPE OF EXPRESSION SYSTEM USED
- 27.1. Chapter Overview
- 27.2. Key Assumptions and Methodology
- 27.3. Biopharmaceutical Contract Manufacturing Market: Distribution by Type of Expression System Used, 2018, Current Year and 2035
- 27.3.1. Mammalian Expression Systems: Historical Trends (Since 2018) and Forecasted Estimates (till 2035)
- 27.3.2. Microbial Expression Systems: Historical Trends (Since 2018) and Forecasted Estimates (till 2035)
- 27.3.3. Other Expression Systems: Historical Trends (Since 2018) and Forecasted Estimates (till 2035)
- 27.4. Data Triangulation and Validation
28. BIOPHARMACEUTICAL CONTRACT MANUFACTURING MARKET, BY SCALE OF OPERATION
- 28.1. Chapter Overview
- 28.2. Key Assumptions and Methodology
- 28.3. Biopharmaceutical Contract Manufacturing Market: Distribution by Scale of Operation, 2018, Current Year and 2035
- 28.3.1. Preclinical / Clinical Operations: Historical Trends (Since 2018) and Forecasted Estimates (till 2035)
- 28.3.2. Commercial Operations: Historical Trends (Since 2018) and Forecasted Estimates (till 2035)
- 28.4. Data Triangulation and Validation
29. BIOPHARMACEUTICAL CONTRACT MANUFACTURING MARKET, BY COMPANY SIZE
- 29.1. Chapter Overview
- 29.2. Key Assumptions and Methodology
- 29.3. Biopharmaceutical Contract Manufacturing Market: Distribution by Company Size, 2018, Current Year and 2035
- 29.3.1. Small Companies: Historical Trends (Since 2018) and Forecasted Estimates (till 2035)
- 29.3.2. Mid-sized Companies: Historical Trends (Since 2018) and Forecasted Estimates (till 2035)
- 29.3.3. Large and Very Large Companies: Historical Trends (Since 2018) and Forecasted Estimates (till 2035)
- 29.4. Data Triangulation and Validation
30. BIOPHARMACEUTICAL CONTRACT MANUFACTURING MARKET, BY GEOGRAPHY
- 30.1. Chapter Overview
- 30.2. Key Assumptions and Methodology
- 30.3. Biopharmaceutical Contract Manufacturing Market: Distribution by Geography, 2018, Current Year and 2035
- 30.3.1. North America: Historical Trends (Since 2018) and Forecasted Estimates (till 2035)
- 30.3.1.1. US: Historical Trends (Since 2018) and Forecasted Estimates (till 2035)
- 30.3.1.2. Canada: Historical Trends (Since 2018) and Forecasted Estimates (till 2035)
- 30.3.2. Europe: Historical Trends (Since 2018) and Forecasted Estimates (till 2035)
- 30.3.2.1. Italy: Historical Trends (Since 2018) and Forecasted Estimates (till 2035)
- 30.3.2.2. Germany: Historical Trends (Since 2018) and Forecasted Estimates (till 2035)
- 30.3.2.3. France: Historical Trends (Since 2018) and Forecasted Estimates (till 2035)
- 30.3.2.4. Spain: Historical Trends (Since 2018) and Forecasted Estimates (till 2035)
- 30.3.2.5. UK: Historical Trends (Since 2018) and Forecasted Estimates (till 2035)
- 30.3.2.6. Rest of Europe: Historical Trends (Since 2018) and Forecasted Estimates (till 2035)
- 30.3.3. Asia-Pacific: Historical Trends (Since 2018) and Forecasted Estimates (till 2035)
- 30.3.3.1. China: Historical Trends (Since 2018) and Forecasted Estimates (till 2035)
- 30.3.3.2. India: Historical Trends (Since 2018) and Forecasted Estimates (till 2035)
- 30.3.3.3. South Korea: Historical Trends (Since 2018) and Forecasted Estimates (till 2035)
- 30.3.3.4. Japan: Historical Trends (Since 2018) and Forecasted Estimates (till 2035)
- 30.3.3.5. Rest of Asia-Pacific: Historical Trends (Since 2018) and Forecasted Estimates (till 2035)
- 30.3.4. Latin America: Historical Trends (Since 2018) and Forecasted Estimates (till 2035)
- 30.3.5. Middle East and North Africa: Historical Trends (Since 2018) and Forecasted Estimates (till 2035)
- 30.3.1. North America: Historical Trends (Since 2018) and Forecasted Estimates (till 2035)
- 30.4. Data Triangulation and Validation
31. BIOPHARMACEUTICAL CONTRACT MANUFACTURING MARKET, BY LEADING PLAYERS
- 31.1. Chapter Overview
- 31.2. Key Assumptions and Methodology
- 31.3. Biopharmaceutical Contract Manufacturing Market: Distribution by Leading Players
- 31.4. Data Triangulation and Validation
32. CASE STUDY: VIRTUAL PHARMACEUTICAL COMPANIES
- 32.1. Chapter Overview
- 32.2. Historical Evolution of the Virtual Business Model
- 32.3. Virtual Pharmaceutical Companies as a Subset of the Overall Biopharmaceutical Industry
- 32.4. Advantages Associated with Outsourcing Operations to Virtual Service Providers
- 32.5. Key Challenges Associated with Outsourcing Operations to Virtual Service Providers
33. SWOT ANALYSIS
- 33.1. Chapter Overview
- 33.2. Strengths
- 33.3. Weaknesses
- 33.4. Opportunities
- 33.5. Threats
- 33.6. Comparison of SWOT Factors
- 33.7. Conclusion
34. FUTURE OF THE BIOPHARMACEUTICAL CMO MARKET
- 34.1. Chapter Overview
- 34.2. Outsourcing Activities to Witness Significant Growth in the Coming Years
- 34.3. Shift from One-time Contracts to Strategic Partnerships
- 34.4. Integration / Adoption of New and Innovative Technologies
- 34.4.1. Single-use Bioreactors
- 34.4.2. Novel Bioprocess Techniques
- 34.4.3. Bioprocess Automation
- 34.5. Focus on Niche Therapeutic Areas
- 34.6. Growing Biosimilars Market to Contribute to the Growth of the Contract Services Segment
- 34.7. Capability Expansion by CMOs to become One-Stop-Shops
- 34.8. Offshoring Outsourcing Activities to Maximize Profits and Expand Existing Capacities
- 34.9. Increase in Financial Inflow and Outsourcing Budgets
- 34.10. Challenges Faced by Sponsors and Service Providers
- 34.10.1. Concerns Related to Single-use Systems
- 34.10.2. Issues Related to Capacity Fluctuations
- 34.11. Concluding Remarks
35. CONCLUSION
36. EXECUTIVE INSIGHTS
- 36.1. Chapter Overview
- 36.2. Company A
- 36.2.1. Company Snapshot
- 36.2.2. Interview Transcript: Chief Executive Officer
- 36.3. Company B
- 36.3.1. Company Snapshot
- 36.3.2. Interview Transcript: Chief Executive Officer And Co-Founder
- 36.4. Company C
- 36.4.1. Company Snapshot
- 36.4.2. Interview Transcript: Chief Technical Officer, Cell And Gene Therapy
- 36.5. Company D
- 36.5.1. Company Snapshot
- 36.5.2. Interview Transcript: President and Chief Operating Officer
- 36.6. Company E
- 36.6.1. Company Snapshot
- 36.6.2. Interview Transcript: Senior Director Of Global Strategic Marketing
- 36.7. Company F
- 36.7.1. Company Snapshot
- 36.7.2. Interview Transcript:Senior Director of Commercial Strategy and Market Insights
- 36.8. Company G
- 36.8.1. Company Snapshot
- 36.8.2. Interview Transcript:Global Head of Sales and Marketing and Head of Business Development (Germany)
- 36.9. Company H
- 36.9.1. Company Snapshot
- 36.9.2. Interview Transcript: Business Development Manager
- 36.10. Company I
- 36.10.1. Company Snapshot
- 36.10.2. Interview Transcript: Manager Marketing and Sales
37. APPENDIX I: TABULATED DATA
38. APPENDIX II: LIST OF COMPANIES AND ORGANIZATIONS
39. APPENDIX III: DETAILS OF PARTNERSHIPS AND COLLABORATIONS
List of Tables
- Table 5.1 Mammalian versus Microbial Expression Systems
- Table 6.1 List of Biopharmaceutical Contract Manufacturers
- Table 6.2 Biopharmaceutical Contract Manufacturers: Information on Type of Service Offered
- Table 6.3 Biopharmaceutical Contract Manufacturers: Information on Type of Biologic Manufactured
- Table 6.4 Biopharmaceutical Contract Manufacturers: Information on Scale of Operation
- Table 6.5 Biopharmaceutical Contract Manufacturers: Information on Type of Expression System Used
- Table 6.6 Biopharmaceutical Contract Manufacturers: Information on Type of Bioreactor Used
- Table 6.7 Biopharmaceutical Contract Manufacturers: Information on Mode of Operation of Bioreactor
- Table 7.1 List of Biopharmaceutical Contract Manufacturing Facilities in North America
- Table 7.2 List of Biopharmaceutical Contract Manufacturing Facilities in Europe
- Table 7.3 List of Biopharmaceutical Contract Manufacturing Facilities in Asia-Pacific
- Table 7.4 List of Biopharmaceutical Contract Manufacturing Facilities in Rest of the World
- Table 8.1 AGC Biologics: Company Overview
- Table 8.2 AGC Biologics: Biologics Manufacturing Facilities
- Table 8.3 AGC Biologics: Recent Developments and Future Outlook
- Table 8.4 Catalent: Company Overview
- Table 8.5 Catalent: Biologics Manufacturing Facilities
- Table 8.6 Catalent: Recent Developments and Future Outlook
- Table 8.7 FUJIFILM Diosynth Biotechnologies: Company Overview
- Table 8.8 FUJIFILM Diosynth Biotechnologies: Biologics Manufacturing Facilities
- Table 8.9 FUJIFILM Diosynth Biotechnologies: Recent Developments and Future Outlook
- Table 8.10 KBI Biopharma: Company Overview
- Table 8.11 KBI Biopharma: Biologics Manufacturing Facilities
- Table 8.12 KBI Biopharma: Recent Developments and Future Outlook
- Table 8.13 Charles River Laboratories: Company Overview
- Table 8.14 Charles River Laboratories: Biologics Manufacturing Facilities
- Table 8.15 Charles River Laboratories: Recent Developments and Future Outlook
- Table 8.16 Cytiva: Company Overview
- Table 8.17 Patheon: Company Overview
- Table 8.18 Piramal Pharma Solutions: Company Overview
- Table 9.1 FDA Quality Agreements and EMA cGMP Regulations: A
- Table 9.2 Boehringer Ingelheim:
- Table 9.3 Boehringer Ingelheim:
- Table 9.4 Boehringer Ingelheim: Recent Developments and Future Outlook
- Table 9.5 Lonza: Company Overview
- Table 9.6 Lonza: Biologics Manufacturing Facilities
- Table 9.7 Lonza: Recent Developments and Future Outlook
- Table 9.8 Sandoz: Company Overview
- Table 9.9 Sandoz: Biologics Manufacturing Facilities
- Table 9.10 Sandoz: Recent Developments and Future Outlook
- Table 9.11 Vetter Pharma: Company Overview
- Table 9.12 Vetter Pharma: Biologics Manufacturing Facilities
- Table 9.13 Vetter Pharma: Recent
- Table 9.14 Miltenyi Biotec: Company Overview
- Table 9.15 Miltenyi Biotec: Biologics Manufacturing Facilities
- Table 9.16 Miltenyi Biotec: Recent Developments and Future Outlook
- Table 9.17 Novasep: Company Overview
- Table 9.18 Olon: Company Overview
- Table 9.19 Rentschler Biopharma: Company Overview
- Table 10.1 WuXi Biologics: Company Overview
- Table 10.2 Wuxi Biologics: Biologics Manufacturing Facilities
- Table 10.3 WuXi Biologics: Recent Developments and Future Outlook
- Table 10.4 Kemwell Biopharma: Company Overview
- Table 10.5 Kemwell Biopharma: Recent Developments and Future Outlook
- Table 10.6 Minaris Regenerative Medicine: Company Overview
- Table 10.7 Minaris Regenerative Medicine: Biologics Manufacturing Facilities
- Table 10.8 Minaris Regenerative Medicine: Recent Developments and Future Outlook
- Table 10.9 Samsung BioLogics: Company Overview
- Table 10.10 Samsung BioLogics: Biologics Manufacturing Facilities
- Table 10.11 Samsung BioLogics: Recent Developments and Future Outlook
- Table 10.12 Cell Therapies: Company Overview
- Table 10.13 Cell Therapies: Recent Developments and Future Outlook
- Table 10.14 AcuraBio: Company Overview
- Table 10.15 Celltrion: Company Overview
- Table 10.16 Takara Bio: Company Overview
- Table 11.1 Bispecific Antibody Therapeutics: Information on Drug Candidate, Developer, Phase of Development and Target Antigen
- Table 11.2 Bispecific Antibody Therapeutics: Information on Clinical Drug Candidates, Target Indications, Therapeutic Areas and Disease Segment
- Table 11.3 Bispecific Antibody Therapeutics: List of Technology Platforms
- Table 11.4 Bispecific Antibody Contract Manufacturers: List of Companies
- Table 11.5 Commonly Used Cytotoxins for ADC Therapeutics
- Table 11.6 Occupational Exposure Limit Bands, Safebridge Consultants
- Table 11.7 Antibody Drug Conjugates: Information on Drug Candidates, Developers, Status of Development, Target Disease Indications and
- Table 11.8 Antibody Drug Conjugate Developers: Information on Year of Establishment, Company Size and Location of Headquarters
- Table 11.9 ADC Contract Manufacturers: List of Companies
- Table 11.10 Cell-based Therapies: Applications
- Table 11.11 Cell-based Therapies: Commercialized Products,
- Table 11.12 Key Cell Therapy Manufacturing Steps
- Table 11.13 Advantages and Disadvantages of Centralized and Decentralized Manufacturing Models
- Table 11.14 Cell Therapy Manufacturing (Industry Players): Information on Type of Cell Manufactured
- Table 11.15 Cell Therapy Contract Manufacturers: List of Companies
- Table 11.16 Gene Therapy Contract Manufacturers: List of Companies
- Table 11.17 Vector and Gene Therapy Manufacturers (Non-Industry players): Information on Type of Vector Manufactured
- Table 11.18 Viral Vectors Contract Manufacturers: List of Companies
- Table 11.19 Plasmid DNA Manufacturing Service Providers: Information on Location of Manufacturing Facility
- Table 11.20 Plasmid DNA Contract Manufacturers: List of Companies
- Table 12.1 List of Biosimilars Contract Manufacturing Service Providers
- Table 13.1 Small Molecules and Large Molecules: Strengths and Weaknesses
- Table 13.2 Small Molecules and Large Molecules: Comparison of Key Characteristics
- Table 13.3 Small Molecules and Large Molecules: Comparison of Development Characteristics
- Table 14.1 List of FDA Approved
- Table 16.1 Big Pharma Initiatives: List of Biopharmaceutical Manufacturing Initiatives
- Table 17.1 Biopharmaceutical Contract Manufacturing: List of Partnerships and Collaborations, Since 2019
- Table 17.2 Partnerships and Collaborations: Information on Type of Biologic Manufactured
- Table 18.1 Biopharmaceutical Contract Manufacturing: List of Mergers and Acquisitions, Since 2015
- Table 18.2 Mergers and Acquisitions: Information on Key Value Drivers and Type of Biologic Manufactured
- Table 18.3 Mergers and Acquisitions: Information on Deal Multiples, Since 2015
- Table 19.1 Biopharmaceutical Contract Manufacturing: List of Recent Expansions, Since 2016
- Table 20.1 Biopharmaceutical Contract Manufacturing: List of Funding and Investments, Since 2016
- Table 20.2 Funding and Investment Analysis: Summary of Investments
- Table 20.3 Funding and Investment Analysis: Summary of Venture Capital Funding
- Table 21.1 Biopharmaceutical Contract Manufacturers: Information on Capacity (Sample Data Set)
- Table 21.2 Capacity Analysis: Average Capacity per Category (Sample Data Set)
- Table 21.3 Capacity Analysis: Average Capacity for Mammalian Expression Systems (Sample Data Set)
- Table 21.4 Capacity Analysis: Average Capacity for Microbial Expression Systems (Sample Data Set)
- Table 21.5 Capacity Analysis: Average Capacity for Other Expression Systems (Sample Data Set)
- Table 21.6 Capacity Analysis: Global Production Capacity
- Table 22.1 Annual Biomanufacturing Capacity, till 2035 (Million Liters)
- Table 23.1 Total Cost of Ownership: Sample Dataset for Mid-sized Companies
- Table 23.2 Total Cost of Ownership: Sample Dataset for Large / Very Large Companies
- Table 31.1 List of Leading Biopharmaceutical Contract Manufacturing Companies
- Table 32.1 List of Virtual Biopharmaceutical Companies
- Table 36.1 RoslinCT: Key Highlights
- Table 36.2 Jafral Biosolutions: Key Highlights
- Table 36.3 Discovery Life Sciences: Key Highlights
- Table 36.4 Bioworkshops: Key Highlights
- Table 36.5 Aldevron: Key Highlights
- Table 36.6 Resilience: Key Highlights
- Table 36.7 Minaris Regenerative Medicine: Key Highlights
- Table 36.8 53Biologics: Key Highlights
- Table 36.9 Richter-Helm BioLogics: Key Highlights
- Table 37.1 Biopharmaceutical Contract Manufacturers: Distribution by Year of Establishment
- Table 37.2 Biopharmaceutical Contract Manufacturers: Distribution by Company Size
- Table 37.3 Biopharmaceutical Contract Manufacturers: Distribution by Location of Headquarters (Region)
- Table 37.4 Biopharmaceutical Contract Manufacturers: Distribution by Location of Headquarters (Country)
- Table 37.5 Biopharmaceutical Contract Manufacturers: Distribution by Year of Establishment, Company Size and Location of Headquarters (Region)
- Table 37.6 Biopharmaceutical Contract Manufacturers: Distribution by Type of Service Offered
- Table 37.7 Biopharmaceutical Contract Manufacturers: Distribution by Type of Biologic Manufactured
- Table 37.8 Biopharmaceutical Contract Manufacturers: Distribution by Type of Biologic Manufactured and Location of Headquarters (Region)
- Table 37.9 Biopharmaceutical Contract Manufacturers: Distribution by Type of Biologic Manufactured and Company Size
- Table 37.10 Biopharmaceutical Contract Manufacturers: Distribution by Scale of Operation
- Table 37.11 Biopharmaceutical Contract Manufacturers: Distribution by Type of Biologic Manufactured and Scale of Operation
- Table 37.12 Biopharmaceutical Contract Manufacturers: Distribution by Type of Expression System Used
- Table 37.13 Biopharmaceutical Contract Manufacturers: Distribution by Type of Expression System Used and Location of Headquarters (Region)
- Table 37.14 Biopharmaceutical Contract Manufacturers: Distribution by Type of Bioreactor Used
- Table 37.15 Biopharmaceutical Contract Manufacturers: Distribution by Mode of Operation of Bioreactor
- Table 37.16 Regional Distribution of Biopharmaceutical Contract Manufacturing Facilities
- Table 37.17 Biopharmaceutical Contract Manufacturing Facilities: Distribution by Type of Service Offered
- Table 37.18 Biopharmaceutical Contract Manufacturing Facilities: Distribution by Scale of Operation
- Table 37.19 AGC Biologics: Annual Revenues, Since FY 2018 (JPY Billion)
- Table 37.20 Catalent: Annual Revenues, Since FY-2018 (USD Billion)
- Table 37.21 FUJIFILM Diosynth Biotechnologies: Annual Revenues, Since FY 2018 (JPY Billion)
- Table 37.22 FUJIFILM Holdings: Annual Revenues by Business Divisions, Current Year (JPY Billion)
- Table 37.23 Charles River Laboratories: Annual Revenues, Since FY 2018 (USD Billion)
- Table 37.24 Boehringer Ingelheim: Annual Revenues, Since FY 2018 (EUR Billion)
- Table 37.25 Lonza: Annual Revenues, Since FY 2018 (CHF Billion)
- Table 37.26 Lonza: Annual Revenues by Business Divisions (CHF Billion)
- Table 37.27 Sandoz: Annual Revenues, Since FY 2018 (USD Billion)
- Table 37.28 Wuxi Biologics: Annual Revenues, Since FY 2018 (RMB Billion)
- Table 37.29 Samsung Biologics: Annual Revenues, Since FY 2018 (KRW Billion)
- Table 37.30 Approved and Clinical Bispecific Antibody Therapeutics: Distribution by Phase of Development
- Table 37.31 Approved and Clinical Bispecific Antibody Therapeutics: Distribution by Target Indication
- Table 37.32 Antibody Drug Conjugates: Distribution by Status of Development
- Table 37.33 Antibody Drug Conjugates: Distribution by Target Disease Indication
- Table 37.34 Most Active Players: Distribution by Number of Therapies
- Table 37.35 Cell Therapy Manufacturing (Industry Players): Distribution by Type of Cell Manufactured
- Table 37.36 Cell Therapy Manufacturing (Industry Players): Distribution by Type of Immune Cell Manufactured
- Table 37.37 Cell Therapy Manufacturing (Industry Players): Distribution by Type of Stem Cell Manufactured
- Table 37.38 Stem Cell Therapies: Distribution by Phase of Development
- Table 37.39 T-Cell Therapies: Distribution by Phase of Development
- Table 37.40 Gene Therapies: Distribution by Stage of Development
- Table 37.41 Gene Therapies: Distribution by Phase of Development
- Table 37.42 Clinical and Commercial Pipeline of Gene Therapies: Distribution by Type of Vector Used
- Table 37.43 Early-stage Pipeline of Gene Therapies: Distribution by Type of Vector Used
- Table 37.44 Clinical and Commercial Pipeline of Gene Therapies: Distribution by Therapeutic Area
- Table 37.45 Early-Stage Pipeline of Gene Therapies: Distribution by Therapeutic Area
- Table 37.46 Viral Vector and Gene Therapy Manufacturers (Industry Players): Distribution by Location of Viral Vector Manufacturing Facilities (Continent-wise)
- Table 37.47 Vector and Gene Therapy Manufacturers (Non-Industry Players): Distribution by Type of Vector Manufactured
- Table 37.48 Plasmid DNA Manufacturers: Distribution by Location of Manufacturing Facility
- Table 37.49 Biosimilars: Historical Trend of FDA Approvals, Since 2015
- Table 37.50 Small Molecule and Large Molecule Drugs: Historical Trend of FDA Approval, 2005-2022
- Table 37.51 Big Pharma Initiatives: Distribution of Players by Number of Biopharmaceutical Contract Manufacturing Focused Initiatives
- Table 37.52 Big Pharma Initiatives: Cumulative Year-wise Trend, Since 2005
- Table 37.53 Big Pharma Initiatives: Distribution by Purpose of Initiative
- Table 37.54 Big Pharma Initiatives: Distribution by Type of Initiative
- Table 37.55 Big Pharma Initiatives: Distribution by Type of Partnership
- Table 37.56 Big Pharma Initiatives: Distribution by Type of Expansion
- Table 37.57 Big Pharma Initiatives: Distribution by Scale of Operation
- Table 37.58 Big Pharma Initiatives: Distribution by Type of Biologic Manufactured
- Table 37.59 Big Pharma Initiatives: Distribution of Players by Purpose of Initiative
- Table 37.60 Big Pharma Initiatives: Distribution by Year and Type of Initiative
- Table 37.61 Big Pharma Initiatives: Distribution of Players by Region of Expansion
- Table 37.62 Partnerships and Collaborations: Cumulative Year-wise Trend, Since 2019
- Table 37.63 Partnerships and Collaborations: Distribution by Type of Partnership
- Table 37.64 Partnerships and Collaborations: Distribution by Year and Type of Partnership
- Table 37.65 Partnerships and Collaborations: Distribution by Type of Biologic Manufactured
- Table 37.66 Partnerships and Collaborations: Distribution by Year of Partnership and Type of Biologic Manufactured
- Table 37.67 Partnerships and Collaborations: Distribution by Type of Biologic Manufactured and Geography
- Table 37.68 Partnerships and Collaborations: Distribution by Type of Partnership and Type of Biologic Manufactured
- Table 37.69 Partnerships and Collaborations: Distribution by Scale of Operation
- Table 37.70 Partnerships and Collaborations: Distribution by Therapeutic Area
- Table 37.71 Most Active Players: Distribution by Number of Partnerships
- Table 37.72 Partnerships and Collaborations: Local and International Agreements
- Table 37.73 Partnerships and Collaborations: Intracontinental and Intercontinental Agreements
- Table 37.74 Mergers and Acquisitions: Year-Wise Cumulative Trend, Since 2015
- Table 37.75 Mergers and Acquisitions: Distribution by Type of Acquisition
- Table 37.76 Local and International Mergers and Acquisitions
- Table 37.77 Intracontinental and Intercontinental Mergers and Acquisitions
- Table 37.78 Mergers and Acquisitions: Year-Wise Trend in North America, Europe and Asia-Pacific, Since 2015
- Table 37.79 Most Active Acquirers: Distribution by Number of Acquisitions
- Table 37.80 Mergers and Acquisitions: Distribution by Key Value Drivers
- Table 37.81 Mergers and Acquisitions: Distribution by Year of Acquisition and Key Value Drivers
- Table 37.82 Mergers and Acquisitions: Distribution by Type of Biologic Manufactured
- Table 37.83 Mergers and Acquisitions: Distribution by Key Value Drivers and Type of Biologic Manufactured
- Table 37.84 Mergers and Acquisitions: Year-Wise Trend of Deal Multiple Amount (USD Million)
- Table 37.85 Recent Expansions: Cumulative Year-wise Trend, Since 2016
- Table 37.86 Recent Expansions: Distribution by Purpose of Expansion
- Table 37.87 Recent Expansions: Distribution by Year and Purpose of Expansion
- Table 37.88 Recent Expansions: Distribution by Type of Biologic Manufactured
- Table 37.89 Recent Expansions: Distribution by Purpose of Expansion and Type of Biologic Manufactured
- Table 37.90 Recent Expansions: Distribution by Location of Expanded Facility
- Table 37.91 Most Active Players: Distribution by Number of Recent Expansions
- Table 37.92 Recent Expansions: Distribution by Purpose of Expansion and Location of Expanded Facility
- Table 37.93 Recent Expansions: Distribution by Amount Invested (USD Million)
- Table 37.94 Funding and Investment Analysis: Cumulative Year-wise Trend, Since 2016
- Table 37.95 Funding and Investment Analysis: Cumulative Year-wise Trend by Amount Invested, Since 2016 (USD Million)
- Table 37.96 Funding and Investment Analysis: Distribution of Funding Instances by Type of Funding
- Table 37.97 Funding and Investment Analysis: Distribution of Amount Invested by Type of Funding (USD Million)
- Table 37.98 Funding and Investment Analysis: Distribution by Year and Type of Funding
- Table 37.99 Funding and Investment Analysis: Distribution of Funding Instances and Total Amount Invested by Geography (Continent) (USD Million)
- Table 37.100 Funding and Investment Analysis: Distribution of Funding Instances and Total Amount Invested by Geography (Country) (USD Million)
- Table 37.101 Most Active Players: Distribution by Number of Funding Instances
- Table 37.102 Most Active Players: Distribution by Total Amount Raised (USD Million)
- Table 37.103 Leading Investors: Distribution by Number of Funding Instances
- Table 37.104 Leading Investors: Distribution by Amount Invested (USD Million)
- Table 37.105 Biopharmaceutical Contract Manufacturers: Global Production Capacity by Company Size
- Table 37.106 Biopharmaceutical Contract Manufacturers: Global Production Capacity by Type of Expression System Used
- Table 37.107 Biopharmaceutical Contract Manufacturers: Global Production Capacity by Location of Manufacturing Facilities
- Table 37.108 Biopharmaceutical Contract Manufacturing Capacity in North America
- Table 37.109 Biopharmaceutical Contract Manufacturing Capacity in Europe
- Table 37.110 Biopharmaceutical Contract Manufacturing Capacity in Asia-Pacific
- Table 37.111 Biopharmaceutical Contract Manufacturing Capacity in Rest of the World
- Table 37.112 Global Demand for Biopharmaceuticals, till 2035 (in kilograms)
- Table 37.113 Global Demand for ADC Therapeutics, till 2035 (in kilograms)
- Table 37.114 Global Demand for Cell Therapies, till 2035 (in terms of Number of Patients)
- Table 37.115 Global Demand for Cell Therapies, till 2035 (Billion Cells)
- Table 37.116 Total Cost of Ownership: Capital Expenditures (CAPEX)
- Table 37.117 Total Cost of Ownership: Operational Expenditures (OPEX)
- Table 37.118 Total Cost of Ownership for Mid-sized Biopharmaceutical Contract Manufacturing Organizations, Y0-Y20 (USD Million)
- Table 37.119 Total Cost of Ownership for Mid-sized Biopharmaceutical Contract Manufacturing Organizations, Y0: Distribution by CAPEX (USD Million)
- Table 37.120 Total Cost of Ownership for Mid-sized Biopharmaceutical Contract Manufacturing Organizations, Y1-Y20: Distribution by OPEX (USD Million)
- Table 37.121 Total Cost of Ownership for Large / Very Large Biopharmaceutical Contract Manufacturing Organizations, Y0-Y20 (USD Million)
- Table 37.122 Total Cost of Ownership for Large / Very Large Biopharmaceutical Contract Manufacturing Organizations, Y0: Distribution by CAPEX (USD Million)
- Table 37.123 Total Cost of Ownership for Large / Very Large Biopharmaceutical Contract Manufacturing Organizations, Y1-Y20: Distribution by OPEX (USD Million)
- Table 37.124 Global Biopharmaceutical Contract Manufacturing Market, Historical Trends (Since 2018)
- Table 37.125 Global Biopharmaceutical Contract Manufacturing Market, Forecasted Estimates (till 2035), Base Scenario (USD Billion)
- Table 37.126 Global Biopharmaceutical Contract Manufacturing Market, Forecasted Estimates (till 2035), Conservative Scenario (USD Billion)
- Table 37.127 Global Biopharmaceutical Contract Manufacturing Market, Forecasted Estimates (till 2035), Optimistic Scenario (USD Billion)
- Table 37.128 Biopharmaceutical Contract Manufacturing Market: Distribution by Type of Service Offered, 2018, Current Year and 2035 (USD Billion)
- Table 37.129 Biopharmaceutical Contract Manufacturing Market for API Manufacturing, Historical Trends (Since 2018) and Forecasted Estimates (till 2035) (USD Billion)
- Table 37.130 Biopharmaceutical Contract Manufacturing Market for FDF Manufacturing, Historical Trends (Since 2018) and Forecasted Estimates (till 2035) (USD Billion)
- Table 37.131 Biopharmaceutical Contract Manufacturing Market: Distribution by Type of Biologic Manufactured, 2018, Current Year and 2035 (USD Billion)
- Table 37.132 Biopharmaceutical Contract Manufacturing Market for Antibodies, Historical Trends (Since 2018) and Forecasted Estimates (till 2035) (USD Billion)
- Table 37.133 Biopharmaceutical Contract Manufacturing Market for Cell Therapies, Historical Trends (Since 2018) and Forecasted Estimates (till 2035) (USD Billion)
- Table 37.134 Biopharmaceutical Contract Manufacturing Market for Vaccines, Historical Trends (Since 2018) and Forecasted Estimates (till 2035) (USD Billion)
- Table 37.135 Biopharmaceutical Contract Manufacturing Market: Distribution by Type of Expression System Used, 2018, Current Year and 2035 (USD Billion)
- Table 37.136 Biopharmaceutical Contract Manufacturing Market for Mammalian Expression Systems, Historical Trends (Since 2018) and Forecasted Estimates (till 2035) (USD Billion)
- Table 37.137 Biopharmaceutical Contract Manufacturing Market for Microbial Expression Systems, Historical Trends (Since 2018) and Forecasted Estimates (till 2035) (USD Billion)
- Table 37.138 Biopharmaceutical Contract Manufacturing Market for Other Expression Systems, Historical Trends (Since 2018) and Forecasted Estimates (till 2035) (USD Billion)
- Table 37.139 Biopharmaceutical Contract Manufacturing Market: Distribution by Scale of Operation, 2018, Current Year and 2035 (USD Billion)
- Table 37.140 Biopharmaceutical Contract Manufacturing Market for Preclinical / Clinical Operations, Historical Trends (Since 2018) and Forecasted Estimates (till 2035) (USD Billion)
- Table 37.141 Biopharmaceutical Contract Manufacturing Market for Commercial Operations, Historical Trends (Since 2018 and Forecasted Estimates (till 2035) (USD Billion)
- Table 37.142 Biopharmaceutical Contract Manufacturing Market: Distribution by Company Size, 2018, Current Year and 2035 (USD Billion)
- Table 37.143 Biopharmaceutical Contract Manufacturing Market for Small Companies, Historical Trends (Since 2018) and Forecasted Estimates (till 2035) (USD Billion)
- Table 37.144 Biopharmaceutical Contract Manufacturing Market for Mid-sized Companies, Historical Trends (Since 2018) and Forecasted Estimates (till 2035) (USD Billion)
- Table 37.145 Biopharmaceutical Contract Manufacturing Market for Large and Very Large Companies, Historical Trends (Since 2018) and Forecasted Estimates (till 2035) (USD Billion)
- Table 37.146 Biopharmaceutical Contract Manufacturing Market: Distribution by Geography, 2018, Current Year and 2035 (USD Billion)
- Table 37.147 Biopharmaceutical Contract Manufacturing Market in North America, Historical Trends (Since 2018) and Forecasted Estimates (till 2035) (USD Billion)
- Table 37.148 Biopharmaceutical Contract Manufacturing Market in the US, Historical Trends (Since 2018) and Forecasted Estimates (till 2035) (USD Billion)
- Table 37.149 Biopharmaceutical Contract Manufacturing Market in Canada, Historical Trends (Since 2018) and Forecasted Estimates (till 2035) (USD Billion)
- Table 37.150 Biopharmaceutical Contract Manufacturing Market in Europe, Historical Trends (Since 2018) and Forecasted Estimates (till 2035) (USD Billion)
- Table 37.151 Biopharmaceutical Contract Manufacturing Market in Italy, Historical Trends (Since 2018) and Forecasted Estimates (till 2035) (USD Billion)
- Table 37.152 Biopharmaceutical Contract Manufacturing Market in Germany, Historical Trends (Since 2018) and Forecasted Estimates (till 2035) (USD Billion)
- Table 37.153 Biopharmaceutical Contract Manufacturing Market in France, Historical Trends (Since 2018) and Forecasted Estimates (till 2035) (USD
- Table 37.154 Biopharmaceutical Contract Manufacturing Market in Spain, Historical Trends (Since 2018) and Forecasted Estimates (till 2035) (USD Billion)
- Table 37.155 Biopharmaceutical Contract Manufacturing Market in the UK, Historical Trends (Since 2018) and Forecasted Estimates (till 2035) (USD Billion)
- Table 37.156 Biopharmaceutical Contract Manufacturing Market in Rest of Europe, Historical Trends (Since 2018) and Forecasted Estimates (till 2035) (USD Billion)
- Table 37.157 Biopharmaceutical Contract Manufacturing Market in Asia-Pacific, Historical Trends (Since 2018) and Forecasted Estimates (till 2035) (USD Billion)
- Table 37.158 Biopharmaceutical Contract Manufacturing Market in China, Historical Trends (Since 2018) and Forecasted Estimates (till 2035) (USD Billion)
- Table 37.159 Biopharmaceutical Contract Manufacturing Market in India, Historical Trends (Since 2018) and Forecasted Estimates (till 2035) (USD Billion)
- Table 37.160 Biopharmaceutical Contract Manufacturing Market in South Korea, Historical Trends (Since 2018) and Forecasted Estimates (till 2035) (USD Billion)
- Table 37.161 Biopharmaceutical Contract Manufacturing Market in Japan, Historical Trends (Since 2018) and Forecasted Estimates (till 2035) (USD Billion)
- Table 37.162 Biopharmaceutical Contract Manufacturing Market in Rest of Asia-Pacific, Historical Trends (Since 2018) and Forecasted Estimates (till 2035) (USD Billion)
- Table 37.163 Biopharmaceutical Contract Manufacturing Market in Latin America, Historical Trends (Since 2018) and Forecasted Estimates (till 2035) (USD Billion)
- Table 37.164 Biopharmaceutical Contract Manufacturing Market in Middle East and North Africa, Historical Trends (Since 2018) and Forecasted Estimates (till 2035) (USD Billion)
- Table 37.165 Biopharmaceutical Contract Manufacturing Market: Distribution by Leading Players (USD Billion)
- Table 37.166 Overall Share of Virtual Biopharmaceutical Companies in the Biopharmaceutical Market (USD Billion)
- Table 37.167 Overall Share of Virtual Biopharmaceutical Companies in the Biopharmaceutical Contract Manufacturing Market in 2023 (USD Billion)
- Table 37.168 Global Biopharmaceuticals Market: Distribution of Number of FDA Approvals by Year, 2005-2023
- Table 39.1 Biopharmaceutical Contract Manufacturing: List of Partnerships and Collaborations, 2015 - 2018
List of Figures
- Figure 2.1 Research Methodology: Project Methodology
- Figure 2.2 Research Methodology: Forecast Methodology
- Figure 2.3 Research Methodology: Robust Quality Control
- Figure 2.4 Research Methodology: Key Market Segmentation
- Figure 3.1 Lessons Learnt from Past Recessions
- Figure 4.1 Executive Summary: Overall Market Landscape
- Figure 4.2 Executive Summary: Regional Capability Analysis
- Figure 4.3 Executive Summary: Partnerships and Collaborations
- Figure 4.4 Executive Summary: Mergers and Acquisitions
- Figure 4.5 Executive Summary: Recent Expansions
- Figure 4.6 Executive Summary: Funding and Investment Analysis
- Figure 4.7 Executive Summary: Demand Analysis
- Figure 4.8 Executive Summary: Total Cost of Ownership
- Figure 4.9 Executive Summary: Market Forecast and Opportunity Analysis
- Figure 5.1 Types of Biopharmaceuticals
- Figure 5.2 Types of Expression Systems Used for the Production of Biopharmaceuticals
- Figure 5.3 Stages of the Biomanufacturing Process
- Figure 5.4 Types of Third-Party Service Providers
- Figure 5.5 Commonly Outsourced Biopharmaceutical Contract Manufacturing Operations
- Figure 6.1 Biopharmaceutical Contract Manufacturers: Distribution by Year of Establishment
- Figure 6.2 Biopharmaceutical Contract Manufacturers: Distribution by Company Size
- Figure 6.3 Biopharmaceutical Contract Manufacturers: Distribution by Location of Headquarters (Region)
- Figure 6.4 Biopharmaceutical Contract Manufacturers: Distribution by Location of Headquarters (Country)
- Figure 6.5 Biopharmaceutical Contract Manufacturers: Distribution by Year of Establishment, Company Size and Location of Headquarters (Region)
- Figure 6.6 Biopharmaceutical Contract Manufacturers: Distribution by Type of Service Offered
- Figure 6.7 Biopharmaceutical Contract Manufacturers: Distribution by Type of Biologic Manufactured
- Figure 6.8 Biopharmaceutical Contract Manufacturers: Distribution by Type of Biologic Manufactured and Location of Headquarters (Region)
- Figure 6.9 Biopharmaceutical Contract Manufacturers: Distribution by Type of Biologic Manufactured and Company Size
- Figure 6.10 Biopharmaceutical Contract Manufacturers: Distribution by Scale of Operation
- Figure 6.11 Biopharmaceutical Contract Manufacturers: Distribution by Type of Biologic Manufactured and Scale of Operation
- Figure 6.12 Biopharmaceutical Contract Manufacturers: Distribution by Type of Expression System Used
- Figure 6.13 Biopharmaceutical Contract Manufacturers: Distribution by Type of Expression System Used and Location of Headquarters (Region)
- Figure 6.14 Biopharmaceutical Contract Manufacturers: Distribution by Type of Bioreactor Used
- Figure 6.15 Biopharmaceutical Contract Manufacturers: Distribution by Mode of Operation of Bioreactor
- Figure 7.1 Regional Distribution of Biopharmaceutical Contract Manufacturing Facilities
- Figure 7.2 Biopharmaceutical Contract Manufacturing Facilities: Distribution by Type of Service Offered
- Figure 7.3 Biopharmaceutical Contract Manufacturing Facilities: Distribution by Scale of Operation
- Figure 7.4 Regional Capability Analysis: Biopharmaceutical Contract Manufacturing Facilities in North America
- Figure 7.5 Regional Capability Analysis: Biopharmaceutical Contract Manufacturing Facilities in Europe
- Figure 7.6 Regional Capability Analysis: Biopharmaceutical Contract Manufacturing Facilities in Asia-Pacific
- Figure 7.7 Regional Capability Analysis: Biopharmaceutical Contract Manufacturing Facilities in Rest of the World
- Figure 8.1 Biopharmaceutical Contract Manufacturing Industry: The US Market Scenario
- Figure 8.2 Biopharmaceutical Contract Manufacturing in the US: Growth Drivers and Challenges
- Figure 8.3 US FDA Guidelines: Elements of a Quality Agreement
- Figure 8.4 US FDA Guidelines: Key Considerations for Biologic Manufacturing Operations
- Figure 8.5 AGC Biologics: Annual Revenues, Since FY 2018 (JPY Billion)
- Figure 8.6 Catalent: Service Portfolio
- Figure 8.7 Catalent: Biosimilars Service Portfolio
- Figure 8.8 Catalent: Annual Revenues, Since FY-2018 (USD Billion)
- Figure 8.9 FUJIFILM Diosynth Biotechnologies: Service Portfolio
- Figure 8.10 FUJIFILM Diosynth Biotechnologies: Annual Revenues, Since FY 2018 (JPY Billion)
- Figure 8.11 FUJIFILM Holdings: Annual Revenues by Business Divisions, Current Year (JPY Billion)
- Figure 8.12 KBI Biopharma: Service Portfolio
- Figure 8.13 Charles River Laboratories: Service Portfolio
- Figure 8.14 Charles River Laboratories: Annual Revenues, Since FY 2018 (USD Billion)
- Figure 9.1 Biopharmaceutical Contract Manufacturing in Europe: Growth Drivers and Challenges
- Figure 9.2 EMA GMP Guidelines: Key Considerations for the Contract Giver, Contract Acceptor and the Contract
- Figure 9.3 Boehringer Ingelheim (BioXcellenece): Service Portfolio
- Figure 9.4 Boehringer Ingelheim: Annual Revenues, Since FY 2018 (EUR Billion)
- Figure 9.5 Lonza: Service Portfolio
- Figure 9.6 Lonza: Annual Revenues, Since FY 2018 (CHF Billion)
- Figure 9.7 Lonza: Annual Revenues by Business Divisions (CHF Billion)
- Figure 9.8 Sandoz: Annual Revenues, Since FY 2018 (USD Billion)
- Figure 9.9 Vetter Pharma: Service Portfolio
- Figure 10.1 Chinese Regulatory Guidelines: Key Considerations for the Contract Giver
- Figure 10.2 Chinese Regulatory Guidelines: Key Considerations for the Contract Acceptor
- Figure 10.3 Chinese Regulatory Guidelines: Key Aspects of the Contract
- Figure 10.4 WuXi Biologics: Service Portfolio
- Figure 10.5 Wuxi Biologics: Annual Revenues, Since FY 2018 (RMB Billion)
- Figure 10.6 Biopharmaceutical Contract Manufacturing in India: Growth Drivers
- Figure 10.7 Kemwell Biopharma: Service Portfolio
- Figure 10.8 Minaris Regenerative Medicine: Service Portfolio
- Figure 10.9 Samsung Biologics: Service Portfolio
- Figure 10.10 Samsung Biologics: Annual Revenues, Since FY 2018 (KRW Billion)
- Figure 10.11 Cell Therapies: Service Portfolio
- Figure 11.1 Basic Structure of an Antibody
- Figure 11.2 Approved and Clinical Bispecific Antibody Therapeutics: Distribution by Phase of Development
- Figure 11.3 Approved and Clinical Bispecific Antibody Therapeutics: Distribution by Target Indication
- Figure 11.4 Structure of an Antibody Drug Conjugate (ADC)
- Figure 11.5 Antibody Drug Conjugates: Distribution by Status of Development
- Figure 11.6 Antibody Drug Conjugates: Distribution by Target Disease Indication
- Figure 11.7 Most Active Players: Distribution by Number of Therapies
- Figure 11.8 Decentralized Manufacturing: Process Model
- Figure 11.9 Cell Therapies: Challenges and Drivers
- Figure 11.10 Cell Therapies: Potency as Critical Quality Attribute
- Figure 11.11 Cell Therapy Manufacturing (Industry Players): Distribution by Type of Cell Manufactured
- Figure 11.12 Cell Therapy Manufacturing (Industry Players): Distribution by Type of Immune Cell Manufactured
- Figure 11.13 Cell Therapy Manufacturing (Industry Players): Distribution by Type of Stem Cell Manufactured
- Figure 11.14 Stem Cell Therapies: Distribution by Phase of Development
- Figure 11.15 T-Cell Therapies: Distribution by Phase of Development
- Figure 11.16 Gene Therapies: Distribution by Stage of Development
- Figure 11.17 Gene Therapies: Distribution by Phase of Development
- Figure 11.18 Clinical and Commercial Pipeline of Gene Therapies: Distribution by Type of Vector Used
- Figure 11.19 Early-stage Pipeline of Gene Therapies: Distribution by Type of Vector Used
- Figure 11.20 Clinical and Commercial Pipeline of Gene Therapies: Distribution by Therapeutic Area
- Figure 11.21 Early-Stage Pipeline of Gene Therapies: Distribution by Therapeutic Area
- Figure 11.22 Viral Vector and Gene Therapy Manufacturers (Industry Players): Distribution by Location of Viral Vector Manufacturing Facilities (Continent-wise)
- Figure 11.23 Vector and Gene Therapy Manufacturers (Non-Industry Players): Distribution by Type of Vector Manufactured
- Figure 11.24 Plasmid DNA Manufacturers: Distribution by Location of Manufacturing Facility
- Figure 12.1 Manufacturing Stages of a Biosimilar Product
- Figure 12.2 Analytical and Functional Characterization Methods for Key Biosimilar Product
- Figure 12.3 Regulatory Process Adopted for Licensing of a Biosimilar Product
- Figure 12.4 Need for Outsourcing Biosimilar Manufacturing Operations
- Figure 12.5 Biosimilars: Historical Trend of FDA Approvals, Since 2015
- Figure 12.6 Challenges Associated with Outsourcing Biosimilar Manufacturing Operations
- Figure 13.1 Small Molecule and Large Molecule Drugs: Historical Trend of FDA Approval, 2005-2022
- Figure 13.2 Small Molecules versus Large Molecules: Comparison of Manufacturing Process
- Figure 14.1 Benefits Associated with In-House Manufacturing
- Figure 14.2 Risks Associated with In-House Manufacturing
- Figure 14.3 Advantages and Disadvantages of Different Types of Outsourcing Partnerships
- Figure 15.1 Make versus Buy Decision Making Framework
- Figure 15.2 Make versus Buy Decision Making Framework: Possible Scenarios
- Figure 16.1 Big Pharma Initiatives: Distribution of Players by Number of Biopharmaceutical Contract Manufacturing Focused Initiatives
- Figure 16.2 Big Pharma Initiatives: Cumulative Year-wise Trend, Since 2005
- Figure 16.3 Big Pharma Initiatives: Distribution by Purpose of Initiative
- Figure 16.4 Big Pharma Initiatives: Distribution by Type of Initiative
- Figure 16.5 Big Pharma Initiatives: Distribution by Type of Partnership
- Figure 16.6 Big Pharma Initiatives: Distribution by Type of Expansion
- Figure 16.7 Big Pharma Initiatives: Distribution by Scale of Operation
- Figure 16.8 Big Pharma Initiatives: Distribution by Type of Biologic Manufactured
- Figure 16.9 Big Pharma Initiatives: Distribution of Players by Year and Number of Initiatives
- Figure 16.10 Big Pharma Initiatives: Distribution of Players by Purpose of Initiative
- Figure 16.11 Big Pharma Initiatives: Distribution by Year and Type of Initiative
- Figure 16.12 Big Pharma Initiatives: Distribution of Players by Region of Expansion
- Figure 16.13 Big Pharma Initiatives: Distribution of Players by Type of Biologic Manufactured
- Figure 17.1 Partnerships and Collaborations: Cumulative Year-wise Trend, Since 2019
- Figure 17.2 Partnerships and Collaborations: Distribution by Type of Partnership
- Figure 17.3 Partnerships and Collaborations: Distribution by Year and Type of Partnership
- Figure 17.4 Partnerships and Collaborations: Distribution by Type of Biologic Manufactured
- Figure 17.5 Partnerships and Collaborations: Distribution by Year of Partnership and Type of Biologic Manufactured
- Figure 17.6 Partnerships and Collaborations: Distribution by Type of Partnership and Type of Biologic Manufactured
- Figure 17.7 Partnerships and Collaborations: Distribution by Scale of Operation
- Figure 17.8 Partnerships and Collaborations: Distribution by Therapeutic Area
- Figure 17.9 Most Active Players: Distribution by Number of Partnerships
- Figure 17.10 Partnerships and Collaborations: Local and International Agreements
- Figure 17.11 Partnerships and Collaborations: Intracontinental and Intercontinental Agreements
- Figure 18.1 Mergers and Acquisitions: Year-Wise Cumulative Trend, Since 2015
- Figure 18.2 Mergers and Acquisitions: Distribution by Type of Acquisition
- Figure 18.3 Local and International Mergers and Acquisitions
- Figure 18.4 Intracontinental and Intercontinental Mergers and Acquisitions
- Figure 18.5 Mergers and Acquisitions: Year-Wise Trend in North America, Europe and Asia-Pacific, Since 2015
- Figure 18.6 Most Active Acquirers: Distribution by Number of Acquisitions
- Figure 18.7 Catalent Biologics: Information on Key Acquisitions
- Figure 18.8 Mergers and Acquisitions: Distribution by Key Value Drivers
- Figure 18.9 Mergers and Acquisitions: Distribution by Year of Acquisition and Key Value Drivers
- Figure 18.10 Mergers and Acquisitions: Distribution by Type of Biologic Manufactured
- Figure 18.11 Mergers and Acquisitions: Distribution by Key Value Drivers and Type of Biologic Manufactured
- Figure 18.12 Mergers and Acquisitions: Year-Wise Trend of Deal Multiple Amount (USD Million)
- Figure 19.1 Recent Expansions: Cumulative Year-wise Trend, Since 2016
- Figure 19.2 Recent Expansions: Distribution by Purpose of Expansion
- Figure 19.3 Recent Expansions: Distribution by Year and Purpose of Expansion
- Figure 19.4 Recent Expansions: Distribution by Type of Biologic Manufactured
- Figure 19.5 Recent Expansions: Distribution by Purpose of Expansion and Type of Biologic Manufactured
- Figure 19.6 Recent Expansions: Distribution by Location of Expanded Facility
- Figure 19.7 Most Active Players: Distribution by Number of Recent Expansions
- Figure 19.8 Recent Expansions: Distribution by Purpose of
- Figure 19.9 Recent Expansions: Distribution by Amount Invested (USD Million)Figure 19.10 Recent Expansions: Comparison 2016-2020 and 2021-2023 Scenario
- Figure 19.10 Recent Expansions: Regional Comparison 2016-2020 and 2021-2023 Scenario
- Figure 20.1 Funding and Investment Analysis: Cumulative Year-wise Trend, Since 2016
- Figure 20.2 Funding and Investment Analysis: Cumulative Year-wise Trend by Amount Invested, Since 2016 (USD Million)
- Figure 20.3 Funding and Investment Analysis: Distribution of Funding Instances by Type of Funding
- Figure 20.4 Funding and Investment Analysis: Distribution of Amount Invested by Type of Funding (USD Million)
- Figure 20.5 Funding and Investment Analysis: Distribution by Year and Type of Funding
- Figure 20.6 Funding and Investment Analysis: Distribution of Funding Instances and Total Amount Invested by Geography (Continent) (USD Million)
- Figure 20.7 Funding and Investment Analysis: Distribution of Funding Instances and Total Amount Invested by Geography (Country) (USD Million)
- Figure 20.8 Most Active Players: Distribution by Number of Funding Instances
- Figure 20.9 Most Active Players: Distribution by Total Amount Raised (USD Million)
- Figure 20.10 Leading Investors: Distribution by Number of Funding Instances
- Figure 20.11 Leading Investors: Distribution by Amount Invested (USD Million)
- Figure 21.1 Biopharmaceutical Contract Manufacturers: Global Production Capacity by Company Size
- Figure 21.2 Biopharmaceutical Contract Manufacturers: Global Production Capacity by Type of Expression System Used
- Figure 21.3 Biopharmaceutical Contract Manufacturers: Global Production Capacity by Location of Manufacturing Facilities
- Figure 21.4 Biopharmaceutical Contract Manufacturing Capacity in North America
- Figure 21.5 Biopharmaceutical Contract Manufacturing Capacity in Europe
- Figure 21.6 Biopharmaceutical Contract Manufacturing Capacity in Asia-Pacific
- Figure 21.7 Biopharmaceutical Contract Manufacturing Capacity in Rest of the World
- Figure 22.1 Global Demand for Biopharmaceuticals, till 2035 (in kilograms)
- Figure 22.2 Global Demand for ADC Therapeutics, till 2035 (in kilograms)
- Figure 22.3 Global Demand for Cell Therapies, till 2035 (in terms of Number of Patients)
- Figure 22.4 Global Demand for Cell Therapies, till 2035 (Billion Cells)
- Figure 23.1 Total Cost of Ownership: Capital Expenditures (CAPEX)
- Figure 23.2 Total Cost of Ownership: Operational Expenditures (OPEX)
- Figure 23.3 Total Cost of Ownership for Mid-sized Biopharmaceutical
- Figure 23.4 Total Cost of Ownership for Mid-sized Biopharmaceutical Contract Manufacturing Organizations, Y0: Distribution by CAPEX (USD Million)
- Figure 23.5 Total Cost of Ownership for Mid-sized Biopharmaceutical Contract Manufacturing Organizations, Y1-Y20: Distribution by OPEX (USD Million)
- Figure 23.6 Total Cost of Ownership for Large / Very Large Biopharmaceutical Contract Manufacturing Organizations, Y0-Y20 (USD Million)
- Figure 23.7 Total Cost of Ownership for Large / Very Large Biopharmaceutical Contract Manufacturing Organizations, Y0: Distribution by CAPEX (USD Million)
- Figure 23.8 Total Cost of Ownership for Large / Very Large Biopharmaceutical Contract Manufacturing Organizations, Y1-Y20: Distribution by OPEX (USD Million)
- Figure 24.1 Global Biopharmaceutical Contract Manufacturing Market, Historical Trends (Since 2018)
- Figure 24.2 Global Biopharmaceutical Contract Manufacturing Market, Forecasted Estimates (till 2035), Base Scenario (USD Billion)
- Figure 24.3 Global Biopharmaceutical Contract Manufacturing Market, Forecasted Estimates (till 2035), Conservative Scenario (USD Billion)
- Figure 24.4 Global Biopharmaceutical Contract Manufacturing Market, Forecasted Estimates (till 2035), Optimistic Scenario (USD Billion)
- Figure 25.1 Biopharmaceutical Contract Manufacturing Market: Distribution by Type of Service Offered, 2018, Current Year and 2035
- Figure 25.2 Biopharmaceutical Contract Manufacturing Market for API Manufacturing, Historical Trends (Since 2018) and Forecasted Estimates (till 2035) (USD Billion)
- Figure 25.3 Biopharmaceutical Contract Manufacturing Market for FDF Manufacturing, Historical Trends (Since 2018) and Forecasted Estimates (till 2035) (USD Billion)
- Figure 26.1 Biopharmaceutical Contract Manufacturing Market: Distribution by Type of Biologic Manufactured, 2018, Current Year and 2035
- Figure 26.2 Biopharmaceutical Contract Manufacturing Market for Antibodies, Historical Trends (Since 2018) and Forecasted Estimates (till 2035) (USD Billion)
- Figure 26.3 Biopharmaceutical Contract Manufacturing Market for Cell Therapies, Historical Trends (Since 2018) and Forecasted Estimates (till 2035) (USD Billion)
- Figure 26.4 Biopharmaceutical Contract Manufacturing Market for Vaccines, Historical Trends (Since 2018) and Forecasted Estimates (till 2035) (USD Billion)
- Figure 27.1 Biopharmaceutical Contract Manufacturing Market: Distribution by Type of Expression System Used, 2018, Current Year and 2035
- Figure 27.2 Biopharmaceutical Contract Manufacturing Market for Mammalian Expression Systems, Historical Trends (Since 2018) and Forecasted Estimates (till 2035) (USD Billion)
- Figure 27.3 Biopharmaceutical Contract Manufacturing Market for Microbial Expression Systems, Historical Trends (Since 2018) and Forecasted Estimates (till 2035) (USD Billion)
- Figure 27.4 Biopharmaceutical Contract Manufacturing Market for Other Expression Systems, Historical Trends (Since 2018) and Forecasted Estimates (till 2035) (USD Billion)
- Figure 28.1 Biopharmaceutical Contract Manufacturing Market: Distribution by Scale of Operation, 2018, Current Year and 2035
- Figure 28.2 Biopharmaceutical Contract Manufacturing Market for Preclinical / Clinical Operations, Historical Trends (Since 2018) and Forecasted Estimates (till2035) (USD Billion)
- Figure 28.3 Biopharmaceutical Contract Manufacturing Market for Commercial Operations, Historical Trends (Since 2018 and Forecasted Estimates (till 2035) (USD Billion)
- Figure 29.1 Biopharmaceutical Contract Manufacturing Market: Distribution by Company Size, 2018, Current Year and 2035
- Figure 29.2 Biopharmaceutical Contract Manufacturing Market for Small Companies, Historical Trends (Since 2018) and Forecasted Estimates (till 2035) (USD Billion)
- Figure 29.3 Biopharmaceutical Contract Manufacturing Market for Mid-sized Companies, Historical Trends (Since 2018) and Forecasted Estimates (till 2035) (USD Billion)
- Figure 29.4 Biopharmaceutical Contract Manufacturing Market for Large and Very Large Companies, Historical Trends (Since 2018) and Forecasted Estimates (till 2035) (USD Billion)
- Figure 30.1 Biopharmaceutical Contract Manufacturing Market: Distribution by Geography, 2018, Current Year and 2035
- Figure 30.2 Biopharmaceutical Contract Manufacturing Market in North America, Historical Trends (Since 2018) and Forecasted Estimates (till 2035) (USD Billion)
- Figure 30.3 Biopharmaceutical Contract Manufacturing Market in the US, Historical Trends (Since 2018) and Forecasted Estimates (till 2035) (USD Billion)
- Figure 30.4 Biopharmaceutical Contract Manufacturing Market in Canada, Historical Trends (Since 2018) and Forecasted Estimates (till 2035) (USD Billion)
- Figure 30.5 Biopharmaceutical Contract Manufacturing Market in Europe, Historical Trends (Since 2018) and Forecasted Estimates (till 2035) (USD Billion)
- Figure 30.6 Biopharmaceutical Contract Manufacturing Market in Italy, Historical Trends (Since 2018) and Forecasted Estimates (till 2035) (USD Billion)
- Figure 30.7 Biopharmaceutical Contract Manufacturing Market in Germany, Historical Trends (Since 2018) and Forecasted Estimates (till 2035) (USD Billion)
- Figure 30.8 Biopharmaceutical Contract Manufacturing Market in France, Historical Trends (Since 2018) and Forecasted Estimates (till 2035) (USD
- Figure 30.9 Biopharmaceutical Contract Manufacturing Market in Spain, Historical Trends (Since 2018) and Forecasted Estimates (till 2035) (USD Billion)
- Figure 30.10 Biopharmaceutical Contract Manufacturing Market in the UK, Historical Trends (Since 2018) and Forecasted Estimates (till 2035) (USD Billion)
- Figure 30.11 Biopharmaceutical Contract Manufacturing Market in Rest of Europe, Historical Trends (Since 2018) and Forecasted Estimates (till 2035) (USD Billion)
- Figure 30.12 Biopharmaceutical Contract Manufacturing Market in Asia-Pacific, Historical Trends (Since 2018) and Forecasted Estimates (till 2035) (USD Billion)
- Figure 30.13 Biopharmaceutical Contract Manufacturing Market in China, Historical Trends (Since 2018) and Forecasted Estimates (till 2035) (USD Billion)
- Figure 30.14 Biopharmaceutical Contract Manufacturing Market in India, Historical Trends (Since 2018) and Forecasted Estimates (till 2035) (USD Billion)
- Figure 30.15 Biopharmaceutical Contract Manufacturing Market in South Korea, Historical Trends (Since 2018) and Forecasted Estimates (till 2035) (USD Billion)
- Figure 30.16 Biopharmaceutical Contract Manufacturing Market in Japan, Historical Trends (Since 2018) and Forecasted Estimates (till 2035) (USD Billion)
- Figure 30.17 Biopharmaceutical Contract Manufacturing Market in Rest of Asia-Pacific, Historical Trends (Since 2018) and Forecasted Estimates (till 2035) (USD Billion)
- Figure 30.18 Biopharmaceutical Contract Manufacturing Market in Latin America, Historical Trends (Since 2018) and Forecasted Estimates (till 2035) (USD Billion)
- Figure 30.19 Biopharmaceutical Contract Manufacturing Market in Middle East and North Africa, Historical Trends (Since 2018) and Forecasted Estimates (till 2035) (USD Billion)
- Figure 30.20 Biopharmaceutical Contract Manufacturing Market: Distribution by Leading Players (USD Billion)
- Figure 31.1 Overall Share of Virtual Biopharmaceutical Companies in the Biopharmaceutical Market (USD Billion)
- Figure 31.2 Overall Share of Virtual Biopharmaceutical Companies in the Biopharmaceutical Contract Manufacturing Market in 2023 (USD Billion)
- Figure 32.1 Biopharmaceutical Contract Manufacturing: SWOT Analysis
- Figure 32.2 Global Biopharmaceuticals Market: Distribution of Number of FDA Approvals by Year, 2005-2022
- Figure 32.3 Comparison of SWOT Factors: Harvey Ball Analysis
- Figure 35.1 Concluding Remarks: Overall Market Landscape
- Figure 35.2 Concluding Remarks: Partnerships and Collaborations
- Figure 35.3 Concluding Remarks: Mergers and Acquisitions
- Figure 35.4 Concluding Remarks: Funding and Investments
- Figure 35.5 Concluding Remarks: Recent Expansions
- Figure 35.6 Concluding Remarks: Capacity Analysis
- Figure 35.7 Concluding Remarks: Demand Analysis
- Figure 35.8 Concluding Remarks: Market Forecast and Opportunity Analysis (I/II)
- Figure 35.9 Concluding Remarks: Market Forecast and Opportunity Analysis (II/II)


