


 |
市場調查報告書
商品編碼
1817404
腺結合病毒(AAV)媒介市場:產業趨勢和全球預測 - 各治療類型,各治療領域,各給藥途徑,各產業規模,各地區Adeno-Associated Viral (AAV) Vector Market: Industry Trends and Global Forecasts - Distribution by Type of Therapy, Therapeutic Area, Route of Administration, Scale of Operation and Geographical Regions |
||||||
全球腺相關病毒 (AAV) 載體市場:概覽
目前,全球 AAV 載體市場規模估計為 36 億美元,預計到 2035 年將達到 60 億美元,預測期內的複合年增長率為 5.3%。
市場區隔包括基於以下參數的市場規模和機會分析:
治療類型
- 遺傳基因增強療法
- 遺傳基因調節療法
治療領域
- 癌症疾病
- 罕見疾病
- 神經疾病
- 代謝疾病
- 肌肉骨骼系統疾病
- 皮膚科疾病
- 感染疾病
- 心血管疾病
- 遺傳疾病
- 眼科疾病
- 其他
給藥途徑
- 靜脈注射
- 視網膜下途徑
- 玻璃體內給藥
- 其他
事業規模
- 前臨床
- 臨床
- 商業
主要地區
- 北美
- 歐洲
- 亞太地區
- 中東·北非
- 其他
全球AAV市場成長與趨勢
近年來,由於基因治療具有針對疾病根本病因的潛力,其需求激增在細胞層面。目前,超過2000種基因療法正處於臨床開發的不同階段。人們對這些療法日益增長的興趣促使對新型遞送載體的需求不斷增長。 AAV載體已成為各種基因轉移載體中最有效的病毒載體。目前,已有六種基於AAV的基因療法獲準用於各種適應症。根據目前的市場動態,全球近290家公司正在開發基於AAV載體的療法,以滿足日益增長的需求。
AAV技術已有50多年的歷史,並持續取得持續進展,使其成為基因治療領域應用最廣泛的基因轉移系統之一。此外,由於AAV載體結構簡單且與疾病無關聯,因此它是許多醫療應用的首選載體。近年來,AAV載體市場面臨來自各種病毒和非病毒系統的競爭,這些系統能夠遞送更大的遺傳物質。進一步的複雜性源自於擴大GMP AAV生產流程所帶來的課題。
鑑於AAV病毒載體領域的當前趨勢和預期機遇,該領域在不久的將來有望實現顯著增長。
全球AAV市場關鍵洞察
本報告分析了全球AAV病毒載體市場的現狀,並揭示了行業內的潛在成長機會。本報告的主要發現包括:
- 該領域的利害關係人正在評估635種基於腺相關病毒載體的療法,以治療各種疾病。
- 大多數療法(42%)處於臨床前階段,其次是處於臨床階段的療法(30%)。目前,大多數療法採用基因增強方法來治療多種疾病。
- 目前,全球近95家公司聲稱提供各種規模的服務來支持AAV療法的開發。
- 全球多個利害關係人正在大力開發基於腺相關病毒載體的療法。
- 目前市場上有 55 種腺相關病毒載體技術/平台,可供各種製造商使用,以滿足日益增長的 AAV 療法需求。
- 該領域公司開發的所有技術/平台均專門用於生產腺相關病毒載體,其中大多數正在開發用於神經系統疾病。
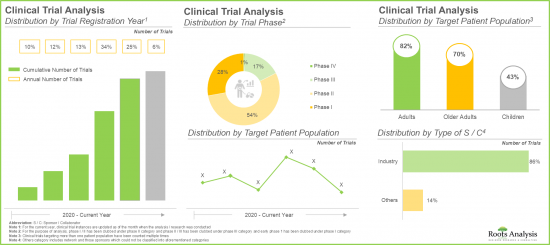
- 大多數試驗(65%)是在過去三年內招募的,其中相當一部分試驗目前處於研究的早期階段(I 期和 II 期)。
- 併購 (22%) 成為產業利害關係人首選的合作模式,幫助他們進入新市場並擴展產品組合。
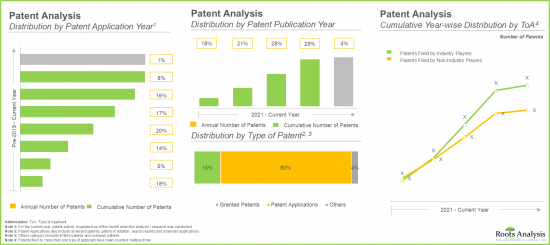
- 自 2021 年以來,腺相關病毒載體領域已公佈超過 1,600 項專利,其中超過 60% 是在過去五年內提交的。
- 預計未來已上市和後期療法的收入機會將在各種治療疾病、治療類型和給藥途徑方面呈現多樣化。
- AAV 製造技術具有多種優勢,例如高標靶性和廣泛的組織趨向性,預測期內市場規模有望以每年 7.7% 的速度成長。
全球 AAV 市場的主要細分市場
依治療領域劃分,市場分為肌肉相關疾病、遺傳性疾病、血液疾病、眼科疾病、皮膚病及代謝性疾病。這是由於基於AAV載體的療法日益普及,尤其是在治療杜氏肌肉營養不良症 (DMD) 和脊髓性肌肉萎縮症等嚴重肌肉疾病方面。
依治療類型劃分,全球AAV載體治療市場分為基因增強療法及基因調控療法。今年,基因增強療法的銷售正在全面推動AAV載體治療產業的發展。此外,基因調控療法的佔有率預計將大幅成長,預測期內的複合年增長率為61%。
依給藥途徑劃分,AAV載體治療產業分為靜脈注射、視網膜下注射、玻璃體內注射及其他途徑。目前,靜脈注射途徑佔最大的市場佔有率,因為它能夠快速且均勻地將治療藥物輸送到全身。此外,預計透過玻璃體內途徑給藥的治療藥物佔有率也將大幅成長,預測期內的複合年增長率為64%。這是由於核准的AAV為基礎的眼科疾病療法數量不斷增加,其中玻璃體內注射途徑逐漸成為主要途徑。
本部分將聚焦在北美、歐洲、亞太、拉丁美洲和其他地區的AAV載體療法市場分佈。根據基礎估計,北美今年很可能佔AAV載體療法市場的大部分佔有率(75%)。這得歸功於該地區先進的醫療基礎設施,使其能夠進行大量臨床試驗。
AAV市場參與企業案例
- Astellas Pharma
- Charles River Laboratories
- Lonza
- Patheon pharma services
- Sanofi
- WuXi AppTec
- Sarepta Therapeutics
- Uniqure
- Spark Therapeutics
- PTC Therapeutics
- Biomarin Pharmaceutical
- Novartis
全球AAV市場調查對象
- 市場規模和機會分析:本研究報告對全球 AAV 載體市場進行了深入分析,重點關注 [A] 治療類型、[B] 治療領域、[C] 給藥途徑、[D] 企業規模和 [E] 地區等關鍵細分市場。
- 腺相關病毒載體製造市場格局:本報告對全球腺相關病毒載體市場進行了深入分析,重點關注以下關鍵細分市場:A) 發展現狀、B) 治療領域、C) 目標基因/分子類型、D) 治療類型、E) 使用的基因轉移方法、F) 給藥途徑、G) 特殊名稱、H) 成立年份、I) 公司所在地和 J) 總部規模。
- 腺相關病毒載體製造市場技術/平台格局:本報告對腺相關病毒載體製造技術/平台進行了全面評估,考慮了各種參數,例如 A) 製造的載體類型、B) 製造的病毒載體類型、C) 業務規模、D) 應用領域、E) 治療領域、F) 成立年份、G) 公司規模和 H) 總部所在地。
- 競爭分析:本報告對腺相關病毒載體製造商進行了全面的競爭分析,考察了 A) 製造商優勢和 B) 產品組合優勢等因素。
- 技術競爭分析:本報告對 AAV 病毒載體製造技術進行了全面的競爭分析,考察了 A) 供應商優勢和 B) 關鍵技術規格等因素。
- 公司簡介:參與公司的詳細公司和藥物簡介,重點關注 A] 公司概況、[B] 財務資訊(如有)、[C] 藥物組合以及 [D] 近期發展和未來前景。
- 臨床試驗分析:基於多個參數對臨床試驗進行深入分析,包括 A] 臨床試驗註冊年份、[B] 當前狀態、[C] 開發階段、[D] 入組患者人數、[E] 申辦方/合作者類型以及 [F] 臨床試驗的區域分佈。
- 合作關係與協作:根據多項參數,對腺相關病毒載體製造市場利益相關者達成的交易進行深入分析,包括A]合作年份、[B]合作類型、[C]治療領域、[D]應用領域、[E]區域分佈和[F]最活躍的參與者(合作夥伴數量)。
- 潛在合作夥伴分析:根據多項參數,對有可能與腺相關病毒載體和基因治療產品製造商建立合作夥伴關係的公司進行深入審查,包括A]開發商實力、[B]產品實力、[C]治療能力和[D]產品線實力。
- 專利分析:根據各種相關參數,對迄今為止在腺相關病毒載體製造領域提交/授予的專利進行深入分析,包括:A) 專利類型、[B]出版年份、[C]區域適用性、[D]CPC 符號、[E]新興重點領域、[F]關鍵行業/非行業參與者和[G]專利估值。
- 新創企業健康指數:根據各種相關參數,對迄今為止在 AAV 載體製造領域提交/授予的專利進行深入分析,包括:A) 處於發現、臨床前和臨床階段的候選藥物數量,[B] 專利數量,以及 [C] 已建立的合作夥伴關係數量。本文對參與腺相關病毒載體療法開發的各類新創公司進行了全面分析。
- 外包:可行/不可行框架:全面研究腺相關病毒載體製造商應考慮的各種因素,以幫助他們做出自主生產還是外包給CMO的決策。
目錄
章節1 報告概要
第1章 序文
第2章 調查手法
第3章 市場動態
- 章概要
- 預測調查手法
- 市場評估組成架構
- 預測工具和技巧
- 重要的考慮事項
- 限制事項
第4章 宏觀經濟指標
- 章概要
- 市場動態
- 結論
章節2 定性洞察
第5章 摘要整理
第6章 簡介
- 章概要
- 媒介的分類
- 腺結合病毒媒介
- 結論
章節3 競爭情形
第7章 腺結合病毒媒介療法:市場形勢
- 章概要
- 基於腺結合病毒媒介治療方法:市場形勢
- 基於腺結合病毒媒介治療方法的開發商:大氣候
第8章 腺結合病毒媒介廠商:市場形勢
- 章概要
- 腺結合病毒媒介廠商:市場形勢
第9章 腺結合病毒媒介製造:技術/平台的形勢
- 章概要
- 腺結合病毒媒介製造:技術/平台的形勢
- 腺結合病毒媒介製造:技術/平台供應商的形勢
第10章 企業競爭力分析:腺結合病毒媒介廠商
- 章概要
- 前提主要的參數
- 調查手法
- Pierre群組概要
- 企業競爭力分析
第11章 技術競爭力分析
- 章概要
- 前提主要的參數
- 調查手法
- Pierre群組概要
- 腺結合病毒媒介技術/平台:競爭力分析
章節4 企業簡介
第12章 成藥的簡介
- 章概要
- erebidisu(sareputa·serapyutikusu公司開發)
- Hemgenix(Uniqure開發)
- kebiridi(PTCserapyutikusu公司開發)
- Luxturna(Spark Therapeutics公司開發)
- rokutabian(生物Marine製藥公司開發)
- zorugensuma(諾華公司開發)
第13章 企業簡介:主要腺結合病毒媒介廠商
- 章概要
- Astellas Pharma
- Charles River Laboratories
- Cytiva
- Lonza
- Patheon Pharma Services
- Sanofi
- Wuxi AppTec
章節5 市場趨勢
第14章 臨床試驗的分析
- 章概要
- 範圍與調查手法
- 使用了腺結合病毒媒介的治療方法:臨床試驗分析
第15章 夥伴關係和合作
- 章概要
- 夥伴關係模式
- 腺相關病毒載體療法開發人員:合作夥伴關係與合作
- 腺結合病毒媒介製造商:夥伴關係和合作
第16章 合作夥伴候補分析
第17章 專利分析
- 章概要
- 範圍與調查手法
- 腺結合病毒媒介市場:專利分析
- 專利基準分析
- 專利評估
- 高採用專利
第18章 Start-Ups的健全性指標
- 章概要
- 開發基於腺結合病毒媒介治療方法的Start-Ups企業
- Start-Ups的基準
第19章 外包:GO/NO-GO組成架構
- 章概要
- 外包:Go/No-Go組成架構
- 腺結合病毒媒介開發外包:Go/No-Go組成架構
- 結論
章節6 市場機會分析
第20章 全球腺結合病毒媒介治療藥市場
第21章 基於腺結合病毒媒介治療藥市場(各治療領域)
第22章 基於腺結合病毒媒介治療藥市場(各治療類型)
第23章 基於腺結合病毒媒介治療藥市場(各給藥途徑)
第24章 基於腺結合病毒媒介治療藥市場(各地區)
第25章 腺結合病毒媒介為基礎治療藥市場:治療藥的銷售額預測
- 章概要
- 主要的前提與調查手法
- 已上市的腺相關病毒載體療法:銷售預測
- 勒克司toRuna
- hemujenikkusu
- zorugensuma
- rokutavian
- erevidisu
- 提高studiothe
- EB 101
- BBM H901
- 處於III期基於腺結合病毒媒介治療藥:預測銷售額
- AGTC 501
- rumevokku
- NFS-01
- RGX-314
- SPK-8011
- jirokutokogen·fiteruparubobekku
- RGX-121
- DTx-401
- DTx-301
- ABO-102
- AAV-RPE65
- ikusoberogen·soroparubobekku
- OCU400
第26章 全球腺結合病毒媒介製造市場
第27章 腺結合病毒媒介製造市場(各開發階段)
第28章 腺結合病毒媒介製造市場(各治療領域)
第29章 腺結合病毒媒介製造市場(各地區)
第30章 腺結合病毒媒介製造市場(市售,臨床,前臨床階段的各產品)
章節7 其他獨家洞察
第31章 結論
第32章 執行洞察
章節8 附錄
第33章 附錄I:表資料
第34章 附錄II:企業及組織一覽
GLOBAL AAV VECTOR MARKET: OVERVIEW
The global AAV vector market estimated to be 3.6 billion in the current year and USD 6.0 billion by 2035, representing a CAGR of 5.3% during the forecast period.
The market sizing and opportunity analysis has been segmented across the following parameters:
Type of Therapy
- Gene Augmentation Therapies
- Gene Regulation Therapies
Therapeutic Area
- Oncological Disorders
- Rare Disorders
- Neurological Disorders
- Metabolic Disorders
- Musculoskeletal Disorders
- Dermatological Disorders
- Infectious Diseases
- Cardiovascular Disorders
- Genetic Disorders
- Ophthalmic Disorders
- Other Disorders
Route of Administration
- Intravenous Route
- Subretinal Route
- Intravitreal Route
- Other Routes
Scale of Operation
- Preclinical
- Clinical
- Commercial
Key Geographical Regions
- North America
- Europe
- Asia-Pacific
- Middle East and North Africa
- Latin America and Rest of the World
Global AAV Market: Growth and Trends
In the last few years, the demand for gene therapies has surged owing to their potential in targeting the underlying cause of a disease at cellular level. Presently, over 2,000 gene therapies are being evaluated in different phases of clinical development. This increasing interest in such therapies has resulted in an increase in the demand for novel delivery vectors. AAV vectors have emerged the most efficient viral vectors, among the various gene delivery vectors available. In the present year, six AAV based gene therapies have been approved for various indications. The current market dynamics suggest that close to 290 players across the globe are developing AAV vector-based therapies in order to cater to their increasing demand.
The AAV technology has a history spanning over 50 years and is consistently advancing, becoming one of the most widely utilized gene delivery systems for gene therapy purposes. Additionally, due to its uncomplicated structure, and absence of disease association, AAV vector is the most favored vector for numerous medical applications. Lately, the AAV vector market has encountered competition from various viral and non-viral systems that enable the delivery of larger genetic material. Additional complexity arises from the difficulties associated with scaling up GMP AAV production processes.
Given the current trends and anticipated opportunities in the AAV viral vector sector, we anticipate that this field will experience notable growth in the near future.
Global AAV Market: Key Insights
The report delves into the current state of global AAV viral vector market and identifies potential growth opportunities within industry. Some key findings from the report include:
- Close to 635 adeno-associated viral vector-based therapies are being evaluated by stakeholders in this domain for various disease indications.
- Most (42%) therapies are in preclinical stage of development, followed by those in clinical stage (30%); majority of the therapies presently use gene augmentation approach in order to treat several diseases.
- Presently, close to 95 players across the globe claim to offer their services across various scale of operations in order to support the development of AAV therapies; notably, majority of these firms are based in North America.
- Several stakeholders have made significant efforts in order to develop adeno-associated viral vector-based therapies, across the globe; majority of these players have been established post-2010.
- 55 adeno-associated viral vector technologies / platforms are currently available in the market; these can be used by various manufacturers in order to cater the increasing demand for AAV therapies.
- All the technologies / platforms developed by companies engaged in this domain are focused on adeno-associated viral vectors manufacturing; of these, majority are being developed against neurological disorders.
- Majority (65%) of the trials were registered in the last three years; a significant proportion of these trials are currently under early stages of research (phase I and phase II).
- Mergers and acquisitions (22%) emerged as the preferred type of partnership model adopted by industry stakeholders, as it enables companies to enter new markets and expand their product portfolios.
- Over 1,600 patents have been published in the adeno-associated viral vector domain since 2021; of these, over 60% of the patents have been filed in the last five years.
- The future opportunity, in terms of revenues generated from marketed and late-stage therapies, is anticipated to be well distributed across different therapeutic disorders, type of therapy and route of administration.
- The market is likely to witness an annualized growth of 7.7% during the forecast period owing to various benefits offered by AAV manufacturing techniques, including high target specificity and broad tissue tropism.
Global AAV Market: Key Segments
Muscle-related Disorders Segment is Likely to Hold the Largest Market Share
In terms of therapeutic area, the market is segmented across muscle-related disorders, genetic disorders, hematological disorders, ophthalmic disorders, dermatological disorders and metabolic disorders. In the current year, the muscle-related disorders segment occupies the higher AAV vector market share (53%), owing to the increasing adoption of AAV vector-based therapies in the treatment of severe muscle disorders, specifically Duchenne muscular dystrophy (DMD) and spinal muscular atrophy.
Gene Augmentation Therapies Segment Holds the Largest Market Share
In terms of type of therapy, the global AAV vector-based therapies market is segmented across gene augmentation therapies and gene regulation therapies. In the current year, the revenues generated by the sales of gene augmentation therapies completely drive the AAV vector-based therapies industry. Further, the market is likely to witness a considerable increase in the share of gene regulation therapies, growing at a CAGR of 61% during the forecast period.
Intravenous Route Segment Holds the Largest Market Share
In terms of route of administration, the AAV vector based therapies industry is segmented across intravenous route, subretinal route, intravitreal route and other routes. In the current year, intravenous route segment occupies the highest market share due to the ability of intravenous route to deliver therapy quickly and evenly across the entire body. In addition, the market is anticipated to witness a considerable increase in the share of therapies administered via intravitreal route, growing at a CAGR of 64% during the forecast period. This is an outcome of the increasing number of AAV based therapy approvals for ophthalmic disorders, for which intravitreal route has emerged as the primary route.
Europe is likely to Propel in the AAV vector based Therapies Market in the Coming Years
This segment highlights the distribution of AAV vector based therapies market across various geographical regions, namely North America, Europe, Asia-Pacific and Latin America, and rest of the world. Our estimates suggest that North America is likely to capture the majority (~75%) of the AAV vector based therapies market share in the current year. This can be attributed to the availability of advanced healthcare infrastructure within this region to conduct a large number of clinical trials.
Example Players in the AAV Market
- Astellas Pharma
- Charles River Laboratories
- Lonza
- Patheon pharma services
- Sanofi
- WuXi AppTec
- Sarepta Therapeutics
- Uniqure
- Spark Therapeutics
- PTC Therapeutics
- Biomarin Pharmaceutical
- Novartis
Global AAV Market: Research Coverage
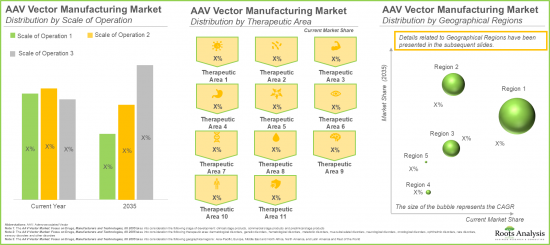
- Market Sizing and Opportunity Analysis: The report features an in-depth analysis of the global AAV vector market, focusing on key market segments, including [A] type of therapy, [B] therapeutic area, [C] route of administration, [D] scale of operation and [E] geographical regions.
- Adeno-associated Viral Vector Manufacturing Market Landscape: The report features an in-depth analysis of the global AAV vector market, focusing on key market segments, including [A] status of development, [B] therapeutic area, [C] type of gene / molecule targeted, [D] type of therapy, [E] gene delivery method used, [F] route of administration, [G] special designation awarded, [H] year of establishment, [I] company size, and [J] location of headquarters.
- Adeno-associated Viral Vector Manufacturing Market Technologies / Platforms Landscape: A comprehensive evaluation of adeno-associated viral vector manufacturing technologies / platforms, considering various parameters, such as [A] type of vector manufactured, [B] type of viral vector manufactured, [C] scale of operation [D] application area [E] therapeutic area, [F] year of establishment, [G] company size, and [H] location of headquarters .
- Company Competitiveness Analysis: A comprehensive competitive analysis of AAV viral vector manufacturers, examining factors, such as [A] manufacturer strength and [B] product portfolio strength.
- Technology Competitiveness Analysis: A comprehensive competitive analysis of AAV viral vector manufacturing technologies, examining factors, such as [A] supplier power and [B] key technology specifications.
- Company Profiles: In-depth company and drug profiles of the players, focusing on [A] company overview, [B] financial information (if available), [C] drug portfolio and [D] recent developments and an informed future outlook.
- Clinical Trial Analysis: An insightful analysis of clinical studies, based on several parameters, such as [A] trial registration year, [B] current status, [C] phase of development, [D], enrolled patient population [E] type of sponsor / collaborator and [F] regional distribution of trials.
- Partnerships and Collaborations: An in-depth analysis of the deals inked by stakeholders in the AAV vector manufacturing market, based on several parameters, such as [A] year of partnership, [B] type of partnership, [C] therapeutic area, [D] application area, [E] geographical distribution [F] most active players (in terms of number of partnerships).
- Likely Partners Analysis: A detailed review of the companies with the likelihood of establishing partnerships with adeno-associated viral vector and gene therapy product manufacturers, based on several parameters, such as [A] developer strength, [B] product strength, [C] therapeutic capability and [D] pipeline strength.
- Patent Analysis: An in-depth analysis of patents filed / granted till date in the AAV vector manufacturing domain, based on various relevant parameters, such as [A] type of patent, [B] publication year, [C] regional applicability, [D] CPC symbols, [E] emerging focus areas, [F] leading industry / non-industry players and [G] patent valuation.
- Start-up Health Indexing: A comprehensive analysis of the various start-ups engaged in the development of adeno-associated viral vectors-based therapies, based on relevant parameters, such as [A] number of candidates in discovery, preclinical and clinical phases of development, [B] number of patents and [C] number of partnerships established.
- Outsourcing: Go / No-Go Framework: An exhaustive study of the various factors that need to be taken into consideration by adeno-associated viral vector manufacturers to facilitate decision making to manufacture their respective products in-house or engage the services of a CMO.
Key Questions Answered in this Report
- How many companies are currently engaged in this market?
- Which are the leading companies in this market?
- What factors are likely to influence the evolution of this market?
- What is the current and future market size?
- What is the CAGR of this market?
- How is the current and future market opportunity likely to be distributed across key market segments?
Reasons to Buy this Report
- The report provides a comprehensive market analysis, offering detailed revenue projections of the overall market and its specific sub-segments. This information is valuable to both established market leaders and emerging entrants.
- Stakeholders can leverage the report to gain a deeper understanding of the competitive dynamics within the market. By analyzing the competitive landscape, businesses can make informed decisions to optimize their market positioning and develop effective go-to-market strategies.
- The report offers stakeholders a comprehensive overview of the market, including key drivers, barriers, opportunities, and challenges. This information empowers stakeholders to stay abreast of market trends and make data-driven decisions to capitalize on growth prospects.
Additional Benefits
- Complimentary PPT Insights Packs
- Complimentary Excel Data Packs for all Analytical Modules in the Report
- 15% Free Content Customization
- Detailed Report Walkthrough Session with Research Team
- Free Updated report if the report is 6-12 months old or older
TABLE OF CONTENTS
SECTION I: REPORT OVERVIEW
1. PREFACE
- 1.1. Introduction
- 1.2. Market Share Insights
- 1.3. Key Market Insights
- 1.4. Report Coverage
- 1.5. Key Questions Answered
- 1.6. Chapter Outlines
2. RESEARCH METHODOLOGY
- 2.1. Chapter Overview
- 2.2. Research Assumptions
- 2.2.1. Market Landscape and Market Trends
- 2.2.2. Market Forecast and Opportunity Analysis
- 2.2.3. Comparative Analysis
- 2.3. Database Building
- 2.3.1. Data Collection
- 2.3.2. Data Validation
- 2.3.3. Data Analysis
- 2.4. Project Methodology
- 2.4.1. Secondary Research
- 2.4.1.1. Annual Reports
- 2.4.1.2. Academic Research Papers
- 2.4.1.3. Company Websites
- 2.4.1.4. Investor Presentations
- 2.4.1.5. Regulatory Filings
- 2.4.1.6. White Papers
- 2.4.1.7. Industry Publications
- 2.4.1.8. Conferences and Seminars
- 2.4.1.9. Government Portals
- 2.4.1.10. Media and Press Releases
- 2.4.1.11. Newsletters
- 2.4.1.12. Industry Databases
- 2.4.1.13. Roots Proprietary Databases
- 2.4.1.14. Paid Databases and Sources
- 2.4.1.15. Social Media Portals
- 2.4.1.16. Other Secondary Sources
- 2.4.2. Primary Research
- 2.4.2.1. Types of Primary Research
- 2.4.2.1.1. Qualitative Research
- 2.4.2.1.2. Quantitative Research
- 2.4.2.1.3. Hybrid Approach
- 2.4.2.2. Advantages of Primary Research
- 2.4.2.3. Techniques for Primary Research
- 2.4.2.3.1. Interviews
- 2.4.2.3.2. Surveys
- 2.4.2.3.3. Focus Groups
- 2.4.2.3.4. Observational Research
- 2.4.2.3.5. Social Media Interactions
- 2.4.2.4. Key Opinion Leaders Considered in Primary Research
- 2.4.2.4.1. Company Executives (CXOs)
- 2.4.2.4.2. Board of Directors
- 2.4.2.4.3. Company Presidents and Vice Presidents
- 2.4.2.4.4. Research and Development Heads
- 2.4.2.4.5. Technical Experts
- 2.4.2.4.6. Subject Matter Experts
- 2.4.2.4.7. Scientists
- 2.4.2.4.8. Doctors and Other Healthcare Providers
- 2.4.2.5. Ethics and Integrity
- 2.4.2.5.1. Research Ethics
- 2.4.2.5.2. Data Integrity
- 2.4.2.1. Types of Primary Research
- 2.4.3. Analytical Tools and Databases
- 2.4.1. Secondary Research
- 2.5. Robust Quality Control
3. MARKET DYNAMICS
- 3.1. Chapter Overview
- 3.2. Forecast Methodology
- 3.2.1. Top-down Approach
- 3.2.2. Bottom-up Approach
- 3.2.3. Hybrid Approach
- 3.3. Market Assessment Framework
- 3.3.1. Total Addressable Market (TAM)
- 3.3.2. Serviceable Addressable Market (SAM)
- 3.3.3. Serviceable Obtainable Market (SOM)
- 3.3.4. Currently Acquired Market (CAM)
- 3.4. Forecasting Tools and Techniques
- 3.4.1. Qualitative Forecasting
- 3.4.2. Correlation
- 3.4.3. Regression
- 3.4.4. Extrapolation
- 3.4.5. Convergence
- 3.4.6. Sensitivity Analysis
- 3.4.7. Scenario Planning
- 3.4.8. Data Visualization
- 3.4.9. Time Series Analysis
- 3.4.10. Forecast Error Analysis
- 3.5. Key Considerations
- 3.5.1. Demographics
- 3.5.2. Government Regulations
- 3.5.3. Reimbursement Scenarios
- 3.5.4. Market Access
- 3.5.5. Supply Chain
- 3.5.6. Industry Consolidation
- 3.5.7. Pandemic / Unforeseen Disruptions Impact
- 3.6. Limitations
4. MACRO-ECONOMIC INDICATORS
- 4.1. Chapter Overview
- 4.2. Market Dynamics
- 4.2.1. Time Period
- 4.2.1.1. Historical Trends
- 4.2.1.2. Current and Forecasted Estimates
- 4.2.2. Currency Coverage
- 4.2.2.1. Major Currencies Affecting the Market
- 4.2.2.2. Factors Affecting Currency Fluctuations
- 4.2.2.3. Impact of Currency Fluctuations on the Industry
- 4.2.3. Foreign Currency Exchange Rate
- 4.2.3.1. Impact of Foreign Exchange Rate Volatility on the Market
- 4.2.3.2. Strategies for Mitigating Foreign Exchange Risk
- 4.2.4. Recession
- 4.2.4.1. Assessment of Current Economic Conditions and Potential Impact on the Market
- 4.2.4.2. Historical Analysis of Past Recessions and Lessons Learnt
- 4.2.5. Inflation
- 4.2.5.1. Measurement and Analysis of Inflationary Pressures in the Economy
- 4.2.5.2. Potential Impact of Inflation on the Market Evolution
- 4.2.6. Interest Rates
- 4.2.6.1. Interest Rates and Their Impact on the Market
- 4.2.6.2. Strategies for Managing Interest Rate Risk
- 4.2.7. Commodity Flow Analysis
- 4.2.7.1. Type of Commodity
- 4.2.7.2. Origins and Destinations
- 4.2.7.3. Values and Weights
- 4.2.7.4. Modes of Transportation
- 4.2.8. Global Trade Dynamics
- 4.2.8.1. Import Scenario
- 4.2.8.2. Export Scenario
- 4.2.8.3. Trade Policies
- 4.2.8.4. Strategies for Mitigating the Risks Associated with Trade Barriers
- 4.2.8.5. Impact of Trade Barriers on the Market
- 4.2.9. War Impact Analysis
- 4.2.9.1. Russian-Ukraine War
- 4.2.9.2. Israel-Hamas War
- 4.2.10. COVID Impact / Related Factors
- 4.2.10.1. Global Economic Impact
- 4.2.10.2. Industry-specific Impact
- 4.2.10.3 .Government Response and Stimulus Measures
- 4.2.10.4. Future Outlook and Adaptation Strategies
- 4.2.11. Other Indicators
- 4.2.11.1. Fiscal Policy
- 4.2.11.2. Consumer Spending
- 4.2.11.3. Gross Domestic Product
- 4.2.11.4. Employment
- 4.2.11.5. Taxes
- 4.2.11.6. Stock Market Performance
- 4.2.11.7. Cross Border Dynamics
- 4.2.1. Time Period
- 4.3. Conclusion
SECTION II: QUALITATIVE INSIGHTS
5. EXECUTIVE SUMMARY
- 5.1. Executive Summary: Market Landscape
- 5.2. Executive Summary: Market Trends
- 5.3. Executive Summary: Market Forecast and Opportunity Analysis
6. INTRODUCTION
- 6.1. Chapter Overview
- 6.2. Classification of Vectors
- 6.2.1. Viral Vectors
- 6.2.1.1. Retrovirus Vectors
- 6.2.1.2. Lentivirus Vectors
- 6.2.1.3. Adeno-associated Viral Vectors
- 6.2.1.4. Adenovirus Vectors
- 6.2.1.5. Other Viral Vectors
- 6.2.1.5.1. Alphavirus
- 6.2.1.5.2. Foamy Virus
- 6.2.1.5.3. Simian Virus
- 6.2.1.5.4. Vaccinia Virus
- 6.2.1.5.5. Chimeric Viral Vectors
- 6.2.1.5.6. Herpes Simplex Virus
- 6.2.1.5.7. Sendai Virus
- 6.2.2. Non-Viral Vectors
- 6.2.1. Viral Vectors
- 6.3. Adeno-associated Viral Vectors
- 6.3.1. Structure and Design
- 6.3.2. Adeno-associated Viral Vector Life Cycle
- 6.3.3. Application of Adeno-associated Viral Vectors
- 6.3.3.1. Gene Therapy
- 6.3.3.2. Vaccination
- 6.3.4. Advantages of Adeno-associated Viral Vectors
- 6.3.5. Challenges Related to Adeno-associated Viral Vectors
- 6.4. Concluding Remarks
SECTION III: COMPETITIVE LANDSCAPE
7. ADENO-ASSOCIATED VIRAL VECTOR BASED THERAPIES: MARKET LANDSCAPE
- 7.1. Chapter Overview
- 7.2. Adeno-associated Viral Vector Based Therapies: Overall Market Landscape
- 7.2.1. Analysis by Status of Development
- 7.2.2. Analysis by Therapeutic Area
- 7.2.3. Analysis by Status of Development and Therapeutic Area
- 7.2.4. Analysis by Type of Gene / Molecule Targeted
- 7.2.5. Analysis by Type of Therapy
- 7.2.6. Analysis by Type of Gene Delivery Method Used
- 7.2.7. Analysis by Route of Administration
- 7.2.8. Analysis by Special Designation Awarded
- 7.3. Adeno-associated Viral Vector Based Therapy Developers: Overall Landscape
- 7.3.1. Analysis by Year of Establishment
- 7.3.2. Analysis by Company Size
- 7.3.3. Analysis by Location of Headquarters (Region)
- 7.3.4. Analysis by Company Size and Location of Headquarters (Region)
- 7.3.5. Most Active Developers: Analysis by Number of Therapies Developed
8. ADENO-ASSOCIATED VIRAL VECTOR MANUFACTURERS: MARKET LANDSCAPE
- 8.1. Chapter Overview
- 8.2. Adeno-associated Viral Vector Manufacturers: Overall Market Landscape
- 8.2.1. Analysis by Year of Establishment
- 8.2.2. Analysis by Company Size
- 8.2.3. Analysis by Location of Headquarters
- 8.2.4. Analysis by Type of Product Manufactured
- 8.2.5. Analysis by Type of Vector Manufactured
- 8.2.6. Analysis by Scale of Operation
- 8.2.7. Analysis by Type of Manufacturer
- 8.2.8. Analysis by Location of Vector Manufacturing Facility
- 8.2.9. Analysis by Application Area
9. ADENO-ASSOCIATED VIRAL VECTOR MANUFACTURING: TECHNOLOGIES / PLATFORMS LANDSCAPE
- 9.1. Chapter Overview
- 9.2. Adeno-associated Viral Vector Manufacturing: Technologies / Platforms Landscape
- 9.2.1. Analysis by Type of Vector Manufactured
- 9.2.2. Analysis by Type of Viral Vector Manufactured
- 9.2.3. Analysis by Scale of Operation
- 9.2.4. Analysis by Application Area
- 9.2.5. Analysis by Therapeutic Area
- 9.3. Adeno-associated Viral Vector Manufacturing: Technology / Platform Providers Landscape
- 9.3.1. Analysis by Year of Establishment
- 9.3.2. Analysis by Company Size
- 9.3.3. Analysis by Location of Headquarters
- 9.3.4. Analysis by Company Size and Location of Headquarters
- 9.3.5. Most Active Players: Analysis by Number of Technologies / Platforms
10. COMPANY COMPETITIVENESS ANALYSIS: ADENO-ASSOCIATED VIRAL VECTOR MANUFACTURERS
- 10.1. Chapter Overview
- 10.2. Assumptions and Key Parameters
- 10.3. Methodology
- 10.4. Overview of Peer Groups
- 10.5. Company Competitiveness Analysis
- 10.5.1. Adeno-associated viral vector manufacturers headquartered in North America
- 10.5.2. Adeno-associated viral vector manufacturers headquartered in Europe
- 10.5.3. Adeno-associated viral vector manufacturers headquartered in Asia-Pacific
11. TECHNOLOGY COMPETITIVENESS ANALYSIS
- 11.1. Chapter Overview
- 11.2. Assumptions and Key Parameters
- 11.3. Methodology
- 11.4. Overview of Peer Groups
- 11.5. Adeno-associated Viral Vector Technologies / Platforms: Competitiveness Analysis
- 11.5.1. Adeno-associated Viral Vector Technologies / Platforms Provided by Companies Headquartered in North America
- 11.5.2. Adeno-associated Viral Vector Technologies / Platforms Provided by Companies Headquartered in Europe and Asia-Pacific
SECTION IV: COMPANY PROFILES
12. MARKETED DRUG PROFILES
- 12.1. Chapter Overview
- 12.2. Elevidys (Developed by Sarepta Therapeutics)
- 12.2.1. Company Overview
- 12.2.2. Development Timeline
- 12.2.3. Mechanism of Action and Vector Used
- 12.2.4. Manufacturing, Dosage and Sales
- 12.2.5. Target Indication
- 12.2.6. Current Status of Development
- 12.3. Hemgenix (Developed by Uniqure)
- 12.4. Kebilidi (Developed by PTC Therapeutics)
- 12.5. Luxturna (Developed by Spark Therapeutics)
- 12.6. Roctavian (Developed by Biomarin Pharmaceutical)
- 12.7. Zolgensma (Developed by Novartis)
13. COMPANY PROFILES: LEADING ADENO-ASSOCIATED VIRAL VECTOR MANUFACTURERS
- 13.1. Chapter Overview
- 13.2. Astellas Pharma
- 13.2.1. Company Overview
- 13.2.2. Financial Information
- 13.2.3. Vector Manufacturing Related Capabilities
- 13.2.4. Recent Developments and Future Outlook
- 13.3. Charles River Laboratories
- 13.4. Cytiva
- 13.5. Lonza
- 13.6. Patheon Pharma Services
- 13.7. Sanofi
- 13.8. Wuxi AppTec
SECTION V: MARKET TRENDS
14. CLINICAL TRIAL ANALYSIS
- 14.1. Chapter Overview
- 14.2. Scope and Methodology
- 14.3. Adeno-associated Viral Vector Based Therapies: Clinical Trial Analysis
- 14.3.1. Analysis by Trial Registration Year
- 14.3.2. Analysis of Patients Enrolled by Trial Registration Year
- 14.3.3. Analysis by Trial Phase
- 14.3.4. Analysis of Patients Enrolled by Trial Phase
- 14.3.5. Analysis by Trial Status
- 14.3.6. Analysis of Patients Enrolled by Trial Status
- 14.3.7. Analysis by Target Patient Population
- 14.3.8. Analysis by Patient Gender
- 14.3.9. Analysis by Type of Sponsor / Collaborator
- 14.3.10. Analysis by Study Design
- 14.3.10.1. Analysis by Type of Patient Allocation Model Used
- 14.3.10.2. Analysis by Type of Trial Masking Adopted
- 14.3.10.3. Analysis by Type of Trial Intervention Model
- 14.3.10.4. Analysis by Trial Purpose
- 14.3.11. Most Active Players: Analysis by Number of Clinical Trials Sponsored / Collaborated
- 14.3.12. Analysis by Geography
- 14.3.12.1. Analysis of Clinical Trials by Geography
- 14.3.12.2. Analysis of Clinical Trials by Geography and Trial Status
- 14.3.12.3. Analysis of Patients Enrolled by Geography and Trial Status
- 14.3.12.4. Analysis of Clinical Trials by Geography, Trial Status and Trial Phase
15. PARTNERSHIPS AND COLLABORATIONS
- 15.1. Chapter Overview
- 15.2. Partnership Models
- 15.3. Adeno-associated Viral Vector Based Therapy Developers: Partnerships and Collaborations
- 15.3.1. Analysis by Year of Partnership
- 15.3.2. Analysis by Type of Partnership
- 15.3.3. Analysis by Year and Type of Partnership
- 15.3.4. Analysis by Year of Partnership and Type of Partner
- 15.3.5. Analysis by Type of Partnership and Type of Partner
- 15.3.6. Analysis by Therapeutic Area
- 15.3.7. Most Active Players: Analysis by Number of Partnerships
- 15.3.8. Analysis by Geography
- 15.3.8.1. Analysis by Country
- 15.3.8.2. Analysis by Region
- 15.4. Adeno-associated Viral Vector Manufacturers: Partnerships and Collaborations
- 15.4.1. Analysis by Year of Partnership
- 15.4.2. Analysis by Type of Partnership
- 15.4.3. Analysis by Year and Type of Partnership
- 15.4.4. Analysis by Year of Partnership and Type of Partner
- 15.4.5. Analysis by Type of Partnership and Type of Partner
- 15.4.6. Analysis by Therapeutic Area
- 15.4.7. Analysis by Application Area
- 15.4.8. Most Active Players: Analysis by Number of Partnerships
- 15.4.9. Analysis by Geography
- 15.4.9.1. Analysis by Country
- 15.4.9.2. Analysis by Region
16. LIEKLY PARTNER ANALYSIS
- 16.1. Chapter Overview
- 16.2. Adeno-associated Viral Vector Based Therapy Developers: Likely Partners
- 16.2.1. Methodology and Key Parameters
- 16.2.2. Adeno-associated Viral Vector Based Therapy Developers: Likely Partner Analysis
- 16.2.2.1. Most Likely Partners
- 16.2.2.2. Likely Partners
- 16.2.2.3. Less Likely Partners
- 16.2.2.4. Least Likely Partners
17. PATENT ANALYSIS
- 17.1. Chapter Overview
- 17.2. Scope and Methodology
- 17.3. Adeno-associated Viral Vector Market: Patent Analysis
- 17.3.1. Analysis by Patent Application Year
- 17.3.2. Analysis by Patent Publication Year
- 17.3.3. Analysis by Type of Patent and Publication Year
- 17.3.4. Analysis by Patent Jurisdiction
- 17.3.5. Analysis by CPC Symbols
- 17.3.6. Analysis by Type of Applicant
- 17.3.7. Leading Industry Players: Analysis by Number of Patents
- 17.3.8. Leading Non-Industry Players: Analysis by Number of Patents
- 17.3.9. Leading Patent Assignees: Analysis by Number of Patents
- 17.4. Patent Benchmarking Analysis
- 17.4.1. Analysis by Patent Characteristics
- 17.5. Patent Valuation
- 17.6. Leading Patents by Number of Citations
18. START-UP HEALTH INDEXING
- 18.1. Chapter Overview
- 18.2. Start-ups Developing Adeno-associated Viral Vector Based Therapies
- 18.2.1. Analysis by Location of Headquarters
- 18.3. Benchmarking of Start-ups
- 18.3.1. Analysis by Pipeline Strength
- 18.3.2. Analysis by Pipeline Maturity
- 18.3.3. Analysis by Indication Diversity
- 18.3.4. Analysis by Patent Strength
- 18.3.5. Analysis by Partnership Activity
- 18.3.6. Start-ups Health Indexing: Roots Analysis Perspective
19. OUTSOURCING: GO / NO-GO FRAMEWORK
- 19.1. Chapter Overview
- 19.2. Outsourcing: Go / No-Go Framework
- 19.3. Adeno-associated Viral Vector Developers Outsourcing: Go / No-Go Framework
- 19.3.1. Key Assumptions and Parameters
- 19.3.2. Methodology
- 19.3.3. Results and Interpretations
- 19.3.3.1. Adeno-associated Viral Vector Based Therapy Developers: Benchmarking of Small Companies
- 19.3.3.2. Adeno-associated Viral Vector Based Therapy Developers: Benchmarking of Mid-sized Companies
- 19.3.3.3. Adeno-associated Viral Vector Based Therapy Developers: Benchmarking of Large Companies
- 19.4. Concluding Remarks
SECTION VI: MARKET OPPORTUNITY ANALYSIS
20. GLOBAL ADENO-ASSOCIATED VIRAL VECTOR BASED THERAPEUTICS MARKET
- 20.1. Chapter Overview
- 20.2. Assumptions and Methodology
- 20.3. Global Adeno-associated Viral Vector Based Therapeutics Market: Historical Trends (since 2021) and Forecasted Estimates (till 2035)
- 20.3.1. Scenario Analysis
- 20.3.1.1. Conservative Scenario
- 20.3.1.2. Optimistic Scenario
- 20.3.1. Scenario Analysis
- 20.4. Key Market Segmentations
21. ADENO-ASSOCIATED VIRAL VECTOR BASED THERAPEUTICS MARKET, BY THERAPEUTIC AREA
- 21.1. Chapter Overview
- 21.2. Assumptions and Methodology
- 21.3. Adeno-associated Viral Vector Based Therapeutics Market: Distribution by Therapeutic Area
- 21.3.1. Adeno-associated Viral Vector Based Therapeutics Market for Muscle-related Disorders: Historical Trends (since 2023) and Forecasted Estimates (till 2035)
- 21.3.2. Adeno-associated Viral Vector
Based Therapeutics Market for Genetic Disorders: Historical Trends (since 2021) and Forecasted Estimates (till 2035)
- 21.3.3. Adeno-associated Viral Vector Based Therapeutics Market for Hematological Disorders: Historical Trends (since 2022) and Forecasted Estimates (till 2035)
- 21.3.4. Adeno-associated Viral Vector Based Therapeutics Market for Ophthalmic Disorders: Historical Trends (since 2021) and Forecasted Estimates (till 2035)
- 21.3.5. Adeno-associated Viral Vector Based Therapeutics Market for Dermatological Disorders: Forecasted Estimates (till 2035)
- 21.3.6. Adeno-associated Viral Vector Based Therapeutics Market for Metabolic Disorders: Forecasted Estimates (till 2035)
- 21.4. Data Triangulation and Validation
22. ADENO-ASSOCIATED VIRAL VECTOR BASED THERAPEUTICS MARKET, BY TYPE OF THERAPY
- 22.1. Chapter Overview
- 22.2. Key Assumptions and Methodology
- 22.3. Adeno-associated Viral Vector Based Therapeutics Market: Distribution by Type of Therapy
- 22.3.1. Adeno-associated Viral Vector Based Therapeutics Market for Gene Augmentation Therapies, Historical Trends (since 2021) and Forecasted Estimates (till 2035)
- 22.3.2. Adeno-associated Viral Vector Based Therapeutics Market for Gene Regulation Therapies, Forecasted Estimates (till 2035)
- 22.4. Data Triangulation and Validation
23. ADENO-ASSOCIATED VIRAL VECTOR BASED THERAPEUTICS MARKET, BY ROUTE OF ADMINISTRATION
- 23.1. Chapter Overview
- 23.2. Key Assumptions and Methodology
- 23.3. Adeno-associated Viral Vector Based Therapeutics Market: Distribution by Route of Administration
- 23.3.1. Adeno-associated Viral Vector Based Therapeutics Market for Intravenous Route: Historical Trends (since 2021) and Forecasted Estimates (till 2035)
- 23.3.2. Adeno-associated Viral Vector Based Therapeutics Market for Subretinal Route: Historical Trends (since 2021) and Forecasted Estimates (till 2035)
- 23.3.3. Adeno-associated Viral Vector Based Therapeutics Market for Intravitreal Route: Historical Trends (since 2022) and Forecasted Estimates (till 2035)
- 23.3.4. Adeno-associated Viral Vector Based Therapeutics Market for Other Routes: Historical Trends (since 2022) and Forecasted Estimates (till 2035)
- 23.4. Data Triangulation and Validation
24. ADENO-ASSOCIATED VIRAL VECTOR BASED THERAPEUTICS MARKET, BY GEOGRAPHICAL REGIONS
- 24.1. Chapter Overview
- 24.2. Key Assumptions and Methodology
- 24.3. Adeno-associated Viral Vector Based Therapeutics Market: Distribution by Geographical Regions
- 24.3.1. Adeno-associated Viral Vector Based Therapeutics Market in North America: Historical Trends (since 2021) and Forecasted Estimates (till 2035)
- 24.3.2. Adeno-associated Viral Vector Based Therapeutics Market in Europe: Historical Trends (since 2021) and Forecasted Estimates (till 2035)
- 24.3.3. Adeno-associated Viral Vector
Based Therapeutics Market in Asia-Pacific: Historical Trends (since 2021) and Forecasted Estimates (till 2035)
- 24.3.4. Adeno-associated Viral Vector Based Therapeutics Market in Latin America and Rest of the World: Historical Trends (since 2021) and Forecasted Estimates (till 2035)
- 24.4. Data Triangulation and Validation
25. ADENO-ASSOCIATED VIRAL VECTOR BASED THERAPEUTICS MARKET: SALES FORECAST OF THERAPIES
- 25.1. Chapter Overview
- 25.2. Key Assumptions and Methodology
- 25.3. Commercialized Adeno-associated Vector Based Therapeutics: Sales Forecast
- 25.3.1. Luxturna
- 25.3.1.1. Sales Forecast
- 25.3.1.2. Net Present Value
- 25.3.1.3. Value Creation Analysis
- 25.3.2. Hemgenix
- 25.3.2.1. Sales Forecast
- 25.3.2.2. Net Present Value
- 25.3.2.3. Value Creation Analysis
- 25.3.3. Zolgensma
- 25.3.3.1. Sales Forecast
- 25.3.3.2. Net Present Value
- 25.3.3.3. Value Creation Analysis
- 25.3.4. Roctavian
- 25.3.4.1. Sales Forecast
- 25.3.4.2. Net Present Value
- 25.3.4.3. Value Creation Analysis
- 25.3.5. Elevidys
- 25.3.5.1. Sales Forecast
- 25.3.5.2. Net Present Value
- 25.3.5.3. Value Creation Analysis
- 25.3.6. Upstaza
- 25.3.6.1. Sales Forecast
- 25.3.6.2. Net Present Value
- 25.3.6.3. Value Creation Analysis
- 25.3.7. EB 101
- 25.3.7.1. Sales Forecast
- 25.3.7.2. Net Present Value
- 25.3.7.3. Value Creation Analysis
- 25.3.8. BBM H901
- 25.3.8.1. Sales Forecast
- 25.3.8.2. Net Present Value
- 25.3.8.3. Value Creation Analysis
- 25.3.1. Luxturna
- 25.4. Phase III Adeno-Associated Vector Based Therapeutics: Sales Forecast
- 25.4.1. AGTC 501
- 25.4.1.1. Sales Forecast
- 25.4.2. Lumevoq
- 25.4.2.1. Sales Forecast
- 25.4.3. NFS-01
- 25.4.3.1. Sales Forecast
- 25.4.4. RGX-314
- 25.4.4.1. Sales Forecast
- 25.4.5. SPK-8011
- 25.4.5.1. Sales Forecast
- 25.4.6. Giroctocogene fitelparvovec
- 25.4.6.1. Sales Forecast
- 25.4.7. RGX-121
- 25.4.7.1. Sales Forecast
- 25.4.7.2. Net Present Value
- 25.4.7.3. Value Creation Analysis
- 25.4.8. DTx-401
- 25.4.8.1. Sales Forecast
- 25.4.9. DTx-301
- 25.4.9.1. Sales Forecast
- 25.4.10. ABO-102
- 25.4.10.1. Sales Forecast
- 25.4.11. AAV-RPE65
- 25.4.11.1. Sales Forecast
- 25.4.12. Ixoberogene Soroparvovec
- 25.4.12.1. Sales Forecast
- 25.4.13. OCU400
- 25.4.13.1. Sales Forecast
- 25.4.1. AGTC 501
26. GLOBAL ADENO-ASSOCIATED VIRAL VECTOR MANUFACTURING MARKET
- 26.1. Chapter Overview
- 26.2. Assumptions and Methodology
- 26.3. Global Adeno-associated Viral Vector Manufacturing Market: Historical Trends (since 2021) and Forecasted Estimates (till 2035)
- 26.3.1. Scenario Analysis
- 26.3.1.1. Conservative Scenario
- 26.3.1.2. Optimistic Scenario
- 26.3.1. Scenario Analysis
- 26.4. Key Market Segmentations
27. ADENO-ASSOCIATED VIRAL VECTOR MANUFACTURING MARKET, BY STAGE OF DEVELOPMENT
- 27.1. Chapter Overview
- 27.2. Key Assumptions and Methodology
- 27.3. Adeno-associated Viral Vector Manufacturing Market: Distribution by Stage of Development, 2021, 2025 and 2035
- 27.3.1. Adeno-associated Viral Vector Manufacturing Market for Commercial Stage Products: Historical Trends (since 2021) and Forecasted Estimates (till 2035)
- 27.3.2. Adeno-associated Viral Vector Manufacturing Market for Clinical Stage Products: Historical Trends (since 2021) and Forecasted Estimates (till 2035)
- 27.3.3. Adeno-associated Viral Vector Manufacturing Market for Preclinical Stage Products: Historical Trends (since 2021) and Forecasted Estimates (till 2035)
- 27.4. Data Triangulation and Validation
28. ADENO-ASSOCIATED VIRAL VECTOR MANUFACTURING MARKET, BY THERAPEUTIC AREA
- 28.1. Chapter Overview
- 28.2. Key Assumptions and Methodology
- 28.3. Adeno-associated Viral Vector Manufacturing Market: Distribution by Therapeutic Area, 2021, 2025 and 2035
- 28.3.1. Adeno-associated Viral Vector Manufacturing Market for Oncological Disorders: Historical Trends (since 2021) and Forecasted Estimates (till 2035)
- 28.3.2. Adeno-associated Viral Vector Manufacturing Market for Rare Disorders: Historical Trends (since 2021) and Forecasted Estimates (till 2035)
- 28.3.3. Adeno-associated Viral Vector Manufacturing Market for Musculoskeletal Disorders: Historical Trends (since 2021) and Forecasted Estimates (till 2035)
- 28.3.4. Adeno-associated Viral Vector Manufacturing Market for Genetic Disorders: Historical Trends (since 2021) and Forecasted Estimates (till 2035)
- 28.3.5. Adeno-associated Viral Vector Manufacturing Market for Hematological Disorders: Historical Trends (since 2021) and Forecasted Estimates (till 2035)
- 28.3.6. Adeno-associated Viral Vector Manufacturing Market for Neurological Disorders: Historical Trends (since 2021) and Forecasted Estimates (till 2035)
- 28.3.7. Adeno-associated Viral Vector Manufacturing Market for Metabolic Disorders: Historical Trends (since 2021) and Forecasted Estimates (till 2035)
- 28.3.8. Adeno-associated Viral Vector Manufacturing Market for Sensory Disorders: Historical Trends (since 2021) and Forecasted Estimates (till 2035)
- 28.3.9. Adeno-associated Viral Vector Manufacturing Market for Ophthalmic Disorders: Historical Trends (since 2021) and Forecasted Estimates (till
2035)
- 28.3.10. Adeno-associated Viral Vector Manufacturing Market for Dermatological Disorders: Historical Trends (since 2025) and Forecasted Estimates (till 2035)
- 28.3.11. Adeno-associated Viral Vector Manufacturing Market for Others: Historical Trends (since 2021) and Forecasted Estimates (till 2035)
- 28.4. Data Triangulation and Validation
29. ADENO-ASSOCIATED VIRAL VECTOR MANUFACTURING MARKET, BY GEOGRAPHICAL REGIONS
- 29.1. Chapter Overview
- 29.2. Key Assumptions and Methodology
- 29.3. Adeno-associated Viral Vector Manufacturing Market: Distribution by Geographical Regions, 2021, 2025 and 2035
- 29.3.1. Adeno-associated Viral Vector Manufacturing Market in North America: Historical Trends (since 2021) and Forecasted Estimates (till 2035)
- 29.3.2. Adeno-associated Viral Vector Manufacturing Market in Europe: Historical Trends (since 2021) and Forecasted Estimates (till 2035)
- 29.3.3. Adeno-associated Viral Vector Manufacturing Market in Asia-Pacific: Historical Trends (since 2021) and Forecasted Estimates (till 2035)
- 29.3.4. Adeno-associated Viral Vector Manufacturing Market in Middle East and North Africa: Historical Trends (since 2021) and Forecasted Estimates (till 2035)
- 29.3.5. Adeno-associated Viral Vector Manufacturing Market in Latin America and Rest of the World: Historical Trends (since 2021) and Forecasted Estimates (till 2035)
- 29.4. Market Dynamics Assessment
- 29.4.1. Penetration Growth (P-G) Matrix
- 29.5. Data Triangulation and Validation
30. ADENO-ASSOCIATED VIRAL VECTOR MANUFACTURING MARKET BY COMMERCIAL, CLINICAL AND PRECLINICAL STAGE PRODUCTS
- 30.1. Chapter Overview
- 30.2. Key Assumptions and Methodology
- 30.3. Key Market Segmentations
- 30.4. Adeno-associated Viral Vector Manufacturing Market for Commercial Stage Products: Historical Trends (since 2021) and Forecasted Estimates (till 2035)
- 30.4.1. Adeno-associated Viral Vector Manufacturing Market for Commercial Stage Products: Distribution by Therapeutic Area
- 30.4.2. Adeno-associated Viral Vector Manufacturing Market for Commercial Stage Products: Distribution by Route of Administration
- 30.4.3. Adeno-associated Viral Vector Manufacturing Market for Commercial Stage Products: Distribution by Geographical Regions
- 30.5. Adeno-associated Viral Vector Manufacturing Market for Clinical Stage Products: Historical Trends (since 2021) and Forecasted Estimates (till 2035)
- 30.5.1. Adeno-associated Viral Vector Manufacturing Market for Clinical Stage Products: Distribution by Phase of Development
- 30.5.2. Adeno-associated Viral Vector Manufacturing Market for Clinical Stage Products: Distribution by Therapeutic
Area
- 30.5.3. Adeno-associated Viral Vector Manufacturing Market for Clinical Stage Products: Distribution by Geographical Regions
- 30.6. Adeno-associated Viral Vector Manufacturing Market for Preclinical Stage Products, Historical Trends (since 2021) and Forecasted Estimates (till 2035)
- 30.6.1. Adeno-associated Viral Vector Manufacturing Market for Preclinical Stage Products: Distribution by Therapeutic Area
- 30.6.2. Adeno-associated Viral Vector Manufacturing Market for Preclinical Stage Products: Distribution by Animal Model Used
- 30.6.3. Adeno-associated Viral Vector Manufacturing Market for Preclinical Stage Products: Distribution by Geographical Regions
SECTION VII: OTHER EXCLUSIVE INSIGHTS
31. CONCLUDING INSIGHTS
32. EXECUTIVE INSIGHTS
SECTION VIII: APPENDICES
33. APPENDIX I: TABULATED DATA
34. APPENDIX II: LIST OF COMPANIES AND ORGANIZATIONS
List of Tables
- Table 7.1 Adeno-associated Viral Vector Based Therapy Market: Information on Developer, Status of Development, Target Indication, Therapeutic Area, Type of Gene / Molecule Targeted, Gene Delivery Method, Route of Administration and Type of Therapy
- Table 7.2 Adeno-associated Viral Vector Based Therapy Market: Information on Special Designation Awarded
- Table 7.3 List of Adeno-associated Viral Vector Based Therapy Developers
- Table 8.1 Adeno-associated Viral Vector Manufacturers: Information on Year of Establishment, Company Size, Location of Headquarters and Type of Product Manufactured
- Table 8.2 Adeno-associated Viral Vector Manufacturers: Information on Type of Vector Manufactured, Scale of Operation and Type of Manufacturer
- Table 8.3 Adeno-associated Viral Vector Manufacturers: Information on Location of Manufacturing Facility and Application Area
- Table 9.1 Adeno-associated Viral Vector Manufacturing Technologies / Platforms: Information on Technology Provider, Type of Vector Manufactured and Type of Viral Vector Manufactured
- Table 9.2 Adeno-associated Viral Vector Manufacturing Technologies / Platforms: Information on Scale of Operation, Application Area and Therapeutic Area
- Table 9.3 Adeno-associated Viral Vector Manufacturing Technology / Platform Providers: Information on Year of Establishment, Company Size and Headquarters
- Table 10.1 Company Competitiveness Scores Allotted to Manufacturers Headquartered in North America (Peer Group I)
- Table 10.2 Company Competitiveness Scores Allotted to Manufacturers based in Europe (Peer Group II)
- Table 10.3 Company Competitiveness Scores Allotted to Manufacturers based in Asia-Pacific (Peer Group III)
- Table 12.1 List of Marketed Adeno-associated Vector Based Therapies Profiled
- Table 12.2 Sarepta Therapeutics: Company Overview
- Table 12.3 Elevidys: Current Status of Development
- Table 12.4 uniQure: Company Overview
- Table 12.5 Hemgenix: Current Status of Development
- Table 12.6 PTC Therapeutics: Company Overview
- Table 12.7 KEBILIDI: Current Status of Development
- Table 12.8 Spark Therapeutics: Company Overview
- Table 12.9 Luxturna: Current Status of Development
- Table 12.10 BioMarin Pharmaceutical: Company Overview
- Table 12.11 Roctavian: Current Status of Development
- Table 12.12 Novartis: Company Overview
- Table 12.13 Zolgensma: Current Status of Development
- Table 13.1 AAV Vector Service Providers: List of Companies Profiled
- Table 13.2 Astellas Pharma: Company Overview
- Table 13.3 Astellas Pharma: Vector Manufacturing Related Capabilities
- Table 13.4 Astellas Pharma: Recent Developments and Future Outlook
- Table 13.5 Charles River Laboratories: Company Overview
- Table 13.6 Charles River Laboratories: Vector Manufacturing Related Capabilities
- Table 13.7 Charles River Laboratories: Recent Developments and Future Outlook
- Table 13.8 Cytiva: Company Overview
- Table 13.9 Cytiva: Vector Manufacturing Related Capabilities
- Table 13.10 Cytiva: Recent Developments and Future Outlook
- Table 13.11 Lonza: Company Overview
- Table 13.12 Lonza: Vector Manufacturing Related Capabilities
- Table 13.13 Lonza: Recent Developments and Future Outlook
- Table 13.14 Patheon Pharma Services: Company Overview
- Table 13.15 Patheon Pharma Services: Vector Manufacturing Related Capabilities
- Table 13.16 Thermo Fisher Scientific (Parent Company of Patheon Pharma Services): Recent Developments and Future Outlook
- Table 13.17 Sanofi: Company Overview
- Table 13.18 Sanofi: Vector Manufacturing Related Capabilities
- Table 13.19 Sanofi: Recent Developments and Future Outlook
- Table 13.20 WuXi AppTec: Company Overview
- Table 13.21 WuXi AppTec: Vector Manufacturing Related Capabilities
- Table 13.22 WuXi AppTec: Recent Developments and Future Outlook
- Table 15.1 Adeno-associated Viral Vector Based Therapy Developers: List of Partnerships and Collaborations, since 2022
- Table 15.2 Adeno-associated Viral Vector Based Therapy Developers: Information on Therapeutic Area
- Table 15.3 Adeno-associated Viral Vector Based Therapy Developers: Information on Type of Agreement
- Table 15.4 Adeno-associated Viral Vector Manufacturers: List of Partnerships and Collaborations, since 2022
- Table 15.5 Adeno-associated Viral Vector Manufacturers: Information on Therapeutic Area
- Table 15.6 Adeno-associated Viral Vector Manufacturers: Information on Application Area
- Table 15.7 Adeno-associated Viral Vector Manufacturers: Information on Type of Agreement
- Table 16.1 Adeno-associated Viral Vector Based Therapy Manufacturers: Most Likely Partners
- Table 16.2 Adeno-associated Viral Vector Based Therapy Manufacturers: Likely Partners
- Table 16.3 Adeno-associated Viral Vector Based Therapy Manufacturers: Less Likely Partners
- Table 16.4 Adeno-associated Viral Vector Based Therapy Manufacturers: Least Likely Partners
- Table 17.1 Patent Analysis: Top CPC Sections
- Table 17.2 Patent Analysis: Top CPC Symbols
- Table 17.3 Patent Analysis: Top CPC Codes
- Table 17.4 Patent Analysis: Summary of Benchmarking Analysis
- Table 17.5 Patent Analysis: Categorization based on Weighted Valuation Scores
- Table 17.6 Patent Portfolio: List of Leading Patents (by Highest Relative Valuation)
- Table 17.7 Patent Portfolio: List of Leading Patents (by Number of Citations)
- Table 18.1 List of Start-ups Developing Adeno-associated Viral Vectors
- Table 25.1 Luxturna: Net Present Value (USD Million)
- Table 25.2 Luxturna: Value Creation Analysis (USD Million)
- Table 25.3 Hemgenix: Net Present Value (USD Million)
- Table 25.4 Hemgenix: Value Creation Analysis (USD Million)
- Table 25.5 Zolgensma: Net Present Value (USD Million)
- Table 25.6 Zolgensma: Value Creation Analysis (USD Million)
- Table 25.7 Roctavian: Net Present Value (USD Million)
- Table 25.8 Roctavian: Value Creation Analysis (USD Million)
- Table 25.9 Elevidys: Net Present Value (USD Million)
- Table 25.10 Elevidys: Value Creation Analysis (USD Million)
- Table 25.11 Upstaza: Net Present Value (USD Million)
- Table 25.12 Upstaza: Value Creation Analysis (USD Million)
- Table 25.13 EB 101: Net Present Value (USD Million)
- Table 25.14 EB 101: Value Creation Analysis (USD Million)
- Table 25.15 BBM H901: Net Present Value (USD Million)
- Table 25.16 BBM H901: Value Creation Analysis (USD Million)
- Table 25.17 RGX-121: Net Present Value (USD Million)
- Table 25.18 RGX-121: Value Creation Analysis (USD Million)
- Table 32.1 Andelyn Bioscience: Organization Snapshot
- Table 32.2 University of Florida: Organization Snapshot
- Table 32.3 Boston College: Organization Snapshot
- Table 33.1 Adeno-associated Viral Vector Based Therapies: Distribution by Status of Development
- Table 33.2 Adeno-associated Viral Vector Based Therapies: Distribution by Therapeutic Area
- Table 33.3 Adeno-associated Viral Vector Based Therapies: Distribution by Status of Development and Therapeutic Area
- Table 33.4 Adeno-associated Viral Vector Based Therapies: Distribution by Type of Gene / Molecule Targeted
- Table 33.5 Adeno-associated Viral Vector Based Therapies: Distribution by Type of Therapy
- Table 33.6 Adeno-associated Viral Vector Based Therapies: Distribution by Type of Gene Delivery Method Used
- Table 33.7 Adeno-associated Viral Vector Based Therapies: Distribution by Route of Administration
- Table 33.8 Adeno-associated Viral Vector Based Therapies: Distribution by Special Designation Awarded
- Table 33.9 Adeno-associated Viral Vector Based Therapy Developers: Distribution by Year of Establishment
- Table 33.10 Adeno-associated Viral Vector Based Therapy Developers: Distribution by Company Size
- Table 33.11 Adeno-associated Viral Vector Based Therapy Developers: Distribution by Location of Headquarters (Region)
- Table 33.12 Adeno-associated Viral Vector Based Therapy Developers: Distribution by Company Size and Location of Headquarters (Region)
- Table 33.13 Most Active Developers: Distribution by Number of Therapies Developed
- Table 33.14 Adeno-associated Viral Vector Manufacturers: Distribution by Year of Establishment
- Table 33.15 Adeno-associated Viral Vector Manufacturers: Distribution by Company Size
- Table 33.16 Adeno-associated Viral Vector Manufacturers: Distribution by Location of Headquarters (Region)
- Table 33.17 Adeno-associated Viral Vector Manufacturers: Distribution by Type of Product Manufactured
- Table 33.18 Adeno-associated Viral Vector Manufacturers: Distribution by Type of Vector Manufactured
- Table 33.19 Adeno-associated Viral Vector Manufacturers: Distribution by Scale of Operation
- Table 33.20 Adeno-associated Viral Vector Manufacturers: Distribution by Type of Manufacturer
- Table 33.21 Adeno-associated Viral Vector Manufacturers: Distribution by Location of Manufacturing Facilities (Region)
- Table 33.22 Adeno-associated Viral Vector Manufacturers: Distribution by Location of Manufacturing Facilities (Country)
- Table 33.23 Adeno-associated Viral Vector Manufacturers: Distribution by Application Area
- Table 33.24 Adeno-associated Viral Vector Manufacturing Technologies / Platforms: Distribution by Type of Vector Manufactured
- Table 33.25 Adeno-associated Viral Vector Manufacturing Technologies / Platforms: Distribution by Type of Viral Vector Manufactured
- Table 33.26 Adeno-associated Viral Vector Manufacturing Technologies / Platforms: Distribution by Scale of Operation
- Table 33.27 Adeno-associated Viral Vector Manufacturing Technologies / Platforms: Distribution by Application Area
- Table 33.28 Adeno-associated Viral Vector Manufacturing Technologies / Platforms: Distribution by Therapeutic Area
- Table 33.29 Adeno-associated Viral Vector Technology / Platform Providers: Distribution by Year of Establishment
- Table 33.30 Adeno-associated Viral Vector Technology / Platform Providers: Distribution by Company Size
- Table 33.31 Adeno-associated Viral Vector Technology / Platform Providers: Distribution by Location of Headquarters (Region)
- Table 33.32 Adeno-associated Viral Vector Technology / Platform Providers: Distribution by Location of Headquarters (Country)
- Table 33.33 Adeno-associated Viral Vector Technology / Platform Providers: Distribution by Company Size and Location of Headquarters
- Table 33.34 Most Active Players: Distribution by Number of Technologies / Platforms
- Table 33.35 Astellas Pharma: Annual Revenues, since FY 2021 (YEN Billion)
- Table 33.36 Charles River Laboratories: Annual Revenues, since FY 2021 (USD Billion)
- Table 33.37 Lonza: Annual Revenues, since FY 2021 (CHF Billion)
- Table 33.38 Thermo Fisher Scientific (Parent Company of Patheon Pharma Services): Annual Revenues, since FY 2021 (USD Billion)
- Table 33.39 Sanofi: Annual Revenues, since FY 2021 (EUR Billion)
- Table 33.40 WuXi AppTec: Annual Revenues, since FY 2021 (RMB Billion)
- Table 33.41 Clinical Trial Analysis: Cumulative Year-wise Trend by Trial Registration Year. Since 2020
- Table 33.42 Clinical Trial Analysis: Distribution of Patients Enrolled by Trial Registration Year, since 2020
- Table 33.43 Clinical Trial Analysis: Distribution by Trial Phase
- Table 33.44 Clinical Trial Analysis: Distribution by Trial Phase and Number of Patients Enrolled
- Table 33.45 Clinical Trial Analysis: Distribution by Trial Status
- Table 33.46 Clinical Trial Analysis: Cumulative Year-wise Trend by Trial Status
- Table 33.47 Clinical Trial Analysis: Distribution by Enrolled Patient Population and Trial Status
- Table 33.48 Clinical Trial Analysis: Distribution by Target Patient Population
- Table 33.49 Clinical Trial Analysis: Distribution by Patient Gender
- Table 33.50 Clinical Trial Analysis: Distribution by Type of Sponsor / Collaborator
- Table 33.51 Clinical Trial Analysis: Distribution by Type of Patient Allocation Model Used
- Table 33.52 Clinical Trial Analysis: Distribution by Type of Trial Masking Adopted
- Table 33.53 Clinical Trial Analysis: Distribution by Type of Intervention Model
- Table 33.54 Clinical Trial Analysis: Distribution by Trial Purpose
- Table 33.55 Most Active Industry Players: Distribution by Number of Clinical Trials Sponsored / Collaborated
- Table 33.56 Most Active Non-Industry Players: Distribution by Number of Clinical Trials Sponsored / Collaborated
- Table 33.57 Clinical Trial Analysis: Distribution of Clinical Trials by Geography
- Table 33.58 Clinical Trial Analysis: Distribution of Clinical Trials by Geography and Trial Status
- Table 33.59 Clinical Trial Analysis: Distribution of Patients Enrolled by Geography and Trial Status
- Table 33.60 Clinical Trial Analysis: Distribution of Clinical Trials by Geography, Trial Status and Trial Phase
- Table 33.61 Adeno-associated Viral Vector Based Therapy Developers: Cumulative Year-wise Trend, since 2017
- Table 33.62 Adeno-associated Viral Vector Based Therapy Developers: Distribution by Type of Partnership
- Table 33.63 Adeno-associated Viral Vector Based Therapy Developers: Distribution by Year of Partnership and Type of Partnership, since 2022
- Table 33.64 Adeno-associated Viral Vector Based Therapy Developers: Distribution by Year of Partnership and Type of Partner, since 2022
- Table 33.65 Adeno-associated Viral Vector Based Therapy Developers: Distribution by Type of Partnership and Type of Partner
- Table 33.66 Adeno-associated Viral Vector Based Therapy Developers: Distribution by Therapeutic Area
- Table 33.67 Most Active Players: Distribution by Number of Partnerships
- Table 33.68 Adeno-associated Viral Vector Based Therapy Developers: Distribution by Country
- Table 33.69 Adeno-associated Viral Vector Based Therapy Developers: Distribution by Region
- Table 33.70 Adeno-associated Viral Vector Manufacturers: Cumulative Year-wise Trend, since 2017
- Table 33.71 Adeno-associated Viral Vector Manufacturers: Distribution by Type of Partnership
- Table 33.72 Adeno-associated Viral Vector Manufacturers: Distribution by Year and Type of Partnership, since 2022
- Table 33.73 Adeno-associated Viral Vector Manufacturers: Distribution by Year of Partnership and Type of Partner
- Table 33.74 Adeno-associated Viral Vector Manufacturers: Distribution by Type of Partnership and Type of Partner
- Table 33.75 Adeno-associated Viral Vector Manufacturers: Distribution by Therapeutic Area
- Table 33.76 Adeno-associated Viral Vector Manufacturers: Distribution by Application Area
- Table 33.77 Most Active Players: Distribution by Number of Partnerships
- Table 33.78 Adeno-associated Viral Vector Manufacturers: Distribution by Country
- Table 33.79 Adeno-associated Viral Vector Manufacturers: Distribution by Region
- Table 33.80 Patent Analysis: Distribution by Type of Patent
- Table 33.81 Patent Analysis: Distribution by Patent Application Year, since pre-2019
- Table 33.82 Patent Analysis: Distribution by Publication Year, since 2021
- Table 33.83 Patent Analysis: Type of Patent and Publication Year
- Table 33.84 Patent Analysis: Distribution by Patent Jurisdiction
- Table 33.85 Patent Analysis: Cumulative Year-wise Distribution by Type of Applicant, since 2021
- Table 33.86 Leading Industry Players: Distribution by Number of Patents
- Table 33.87 Leading Non-Industry Players: Distribution by Number of Patents
- Table 33.88 Leading Patent Assignees: Distribution by Number of Patents
- Table 33.89 Patent Valuation: Distribution of Patents by Age
- Table 33.90 Adeno-associated Viral Vectors: Patent Valuation
- Table 33.91 Start-up Health Indexing: Distribution by Location of Headquarters
- Table 33.92 Start-up Health Indexing: Distribution by Pipeline Strength
- Table 33.93 Start-up Health Indexing: Distribution by Pipeline Maturity
- Table 33.94 Start-up Health Indexing: Distribution by Indication Diversity
- Table 33.95 Analysis of Start-ups: Distribution by Patent Strength
- Table 33.96 Start-up Health Indexing: Distribution by Partnership Activity
- Table 33.97 Global Adeno-associated Viral Vector Based Therapeutics Market, Historical Trends (since 2021) and Forecasted Estimates (till 2035) (USD Million)
- Table 33.98 Global Adeno-associated Viral Vector Based Therapeutics Market, Forecasted Estimates (till 2035), Conservative Scenario (USD Million)
- Table 33.99 Global Adeno-associated Viral Vector Based Therapeutics Market Forecasted Estimates (till 2035) Optimistic Scenario (USD Million)
- Table 33.100 Adeno-associated Viral Vector Based Therapeutics Market: Distribution by Therapeutic Area
- Table 33.101 Adeno-associated Viral Vector Based Therapeutics Market for Muscle-related Disorders, Historical Trends (since 2023) and Forecasted Estimates (till 2035), Conservative, Base and Optimistic Scenarios (USD Million)
- Table 33.102 Adeno-associated Viral Vector Based Therapeutics Market for Genetic Disorders, Historical Trends (since 2021) and Forecasted Estimates (till 2035), Conservative, Base and Optimistic Scenarios (USD Million)
- Table 33.103 Adeno-associated Viral Vector Based Therapeutics Market for Hematological Disorders, Historical Trends (since 2023) and Forecasted Estimates (till 2035), Conservative, Base and Optimistic Scenarios (USD Million)
- Table 33.104 Adeno-associated Viral Vector Based Therapeutics Market for Ophthalmic Disorders, Historical Trends (since 2021) and Forecasted Estimates (till 2035), Conservative, Base and Optimistic Scenarios (USD Million)
- Table 33.105 Adeno-associated Viral Vector Based Therapeutics Market for Dermatological Disorders, Forecasted Estimates (till 2035), Conservative, Base and Optimistic Scenarios (USD Million)
- Table 33.106 Adeno-associated Viral Vector Based Therapeutics Market for Metabolic Disorders, Forecasted Estimates (till 2035), Conservative, Base and Optimistic Scenarios (USD Million)
- Table 33.107 Adeno-associated Viral Vector Based Therapeutics Market: Distribution by Type of Therapy
- Table 33.108 Adeno-associated Viral Vector Based Therapeutics Market for Gene Augmentation Therapy, Historical Trends (since 2021) and Forecasted Estimates (till 2035), Conservative, Base and Optimistic Scenarios (USD Million)
- Table 33.109 Adeno-associated Viral Vector Based Therapeutics Market for Gene Regulation Therapy, Forecasted Estimates (till 2035), Conservative, Base and Optimistic Scenarios (USD Million)
- Table 33.110 Adeno-associated Viral Vector Based Therapeutics Market: Distribution by Route of Administration
- Table 33.111 Adeno-associated Viral Vector Based Therapeutics Market for Intravenous Route, Historical Trends (since 2021) and Forecasted Estimates (till 2035), Conservative, Base and Optimistic Scenarios (USD Million)
- Table 33.112 Adeno-associated Viral Vector Based Therapeutics Market for Subretinal Route, Historical Trends (since 2021) and Forecasted Estimates (till 2035), Conservative, Base and Optimistic Scenarios (USD Million)
- Table 33.113 Adeno-associated Viral Vector Based Therapeutics Market for Intravitreal Route, Historical Trends (since 2022) and Forecasted Estimates (till 2035), Conservative, Base and Optimistic Scenarios (USD Million)
- Table 33.114 Adeno-associated Viral Vector Based Therapeutics Market for Other Routes, Historical Trends (since 2022) and Forecasted Estimates (till 2035), Conservative, Base and Optimistic Scenarios (USD Million)
- Table 33.115 Adeno-associated Viral Vector Based Therapeutics Market: Distribution by Geographical Regions
- Table 33.116 Adeno-associated Viral Vector Based Therapeutics Market in North America, Historical Trends (since 2021) and Forecasted Estimates (till 2035), Conservative, Base and Optimistic Scenarios (USD Million)
- Table 33.117 Adeno-associated Viral Vector Based Therapeutics Market in Europe, Forecasted Historical Trends (since 2021) and Forecasted Estimates (till 2035), Conservative, Base and Optimistic Scenarios (USD
- Table 33.118 Adeno-associated Viral Vector Based Therapeutics Market in Asia-Pacific, Historical Trends (since 2021) and Forecasted Estimates (till 2035), Conservative, Base and Optimistic Scenarios (USD Million)
- Table 33.119 Adeno-associated Viral Vector Based Therapeutics Market for Latin America and Rest of the World, Historical Trends (since 2021) and Forecasted Estimates (till 2035), Conservative, Base and Optimistic Scenarios (USD Million)
- Table 33.120 Adeno-associated Vector Based Therapeutics Market: Luxturna Sales Forecast, till 2035 (USD Million)
- Table 33.121 Adeno-associated Vector Based Therapeutics Market: Hemgenix Sales Forecast, till 2035 (USD Million)
- Table 33.122 Adeno-associated Vector Based Therapeutics Market: Zolgensma Sales Forecast, till 2035 (USD Million)
- Table 33.123 Adeno-associated Vector Based Therapeutics Market: Roctavian Sales Forecast, till 2035 (USD Million)
- Table 33.124 Adeno-associated Vector Based Therapeutics Market: Elevidys Sales Forecast, till 2035 (USD Million)
- Table 33.125 Adeno-associated Vector Based Therapeutics Market: Upstaza Sales Forecast, till 2035 (USD Million)
- Table 33.126 Adeno-associated Vector Based Therapeutics Market: EB 101 Sales Forecast, till 2035 (USD Million)
- Table 33.127 Adeno-associated Vector Based Therapeutics Market: BBM H901 Sales Forecast, till 2035 (USD Million)
- Table 33.128 Adeno-associated Vector Based Therapeutics Market: AGTC 501 Sales Forecast, till 2035 (USD Million)
- Table 33.129 Adeno-associated Vector Based Therapeutics Market: Lumevoq Sales Forecast, till 2025 (USD Million)
- Table 33.130 Adeno-associated Vector Based Therapeutics Market: NFS-01 Sales Forecast, till 2035 (USD Million)
- Table 33.131 Adeno-associated Vector Based Therapeutics Market: RGX-314 Sales Forecast, till 2035 (USD Million)
- Table 33.132 Adeno-associated Vector Based Therapeutics Market: SPK-8011 Sales Forecast, till 2035 (USD Million)
- Table 33.133 Adeno-associated Vector Based Therapeutics Market: Giroctocogene fitelparvovec Sales Forecast, till 2035 (USD Million)
- Table 33.134 Adeno-associated Vector Based Therapeutics Market: RGX-121 Sales Forecast, till 2035 (USD Million)
- Table 33.135 Adeno-associated Vector Based Therapeutics Market: DTx-401 Sales Forecast, till 2035 (USD Million)
- Table 33.136 Adeno-associated Vector Based Therapeutics Market: DTx-301 Sales Forecast, till 2035 (USD Million)
- Table 33.137 Adeno-associated Vector Based Therapeutics Market: ABO-102 Sales Forecast, till 2035 (USD Million)
- Table 33.138 Adeno-associated Vector Based Therapeutics Market: AAV-RPE65 Sales Forecast, till 2035 (USD Million)
- Table 33.139 Adeno-associated Vector Based Therapeutics Market: Ixoberogene Soroparvovec Sales Forecast, till 2035 (USD Million)
- Table 33.140 Adeno-associated Vector Based Therapeutics Market: OCU400 Sales Forecast, till 2035 (USD Million)
- Table 33.141 Global Adeno-associated Viral Vector Based Manufacturing Market, Historical Trends (since 2021) and Forecasted Estimates (till 2035) (USD Million)
- Table 33.142 Global Adeno-associated Viral Vector Based Manufacturing Market, Forecasted Estimates (till 2035), Conservative Scenario (USD Million)
- Table 33.143 Global Adeno-associated Viral Vector Based Manufacturing Market Forecasted Estimates (till 2035) Optimistic Scenario (USD Million)
- Table 33.144 Adeno-associated Viral Vector Based Manufacturing Market: Distribution by Stage of Development
- Table 33.145 Adeno-associated Viral Vector Based Manufacturing Market for Commercial Stage Products, Historical Trends (since 2021) and Forecasted Estimates (till 2035), Conservative, Base and Optimistic Scenarios (USD Million)
- Table 33.146 Adeno-associated Viral Vector Based Manufacturing Market for Clinical Stage Products, Historical Trends (since 2021) and Forecasted Estimates (till 2035), Conservative, Base and Optimistic Scenarios (USD Million)
- Table 33.147 Adeno-associated Viral Vector Based Manufacturing Market for Preclinical Stage Products, Historical Trends (since 2021) and Forecasted Estimates (till 2035), Conservative, Base and Optimistic Scenarios (USD Million)
- Table 33.148 Adeno-associated Viral Vector Based Manufacturing Market: Distribution by Therapeutic Area
- Table 33.149 Adeno-associated Viral Vector Based Manufacturing Market for Oncological Disorders, Historical Trends (since 2021) and Forecasted Estimates (till 2035), Conservative, Base and Optimistic Scenarios (USD Million)
- Table 33.150 Adeno-associated Viral Vector Based Manufacturing Market for Rare Disorders, Historical Trends (since 2021) and Forecasted Estimates (till 2035), Conservative, Base and Optimistic Scenarios (USD Million)
- Table 33.151 Adeno-associated Viral Vector Based Manufacturing Market for Musculoskeletal Disorders, Historical Trends (since 2021) and Forecasted Estimates (till 2035), Conservative, Base and Optimistic Scenarios (USD Million)
- Table 33.152 Adeno-associated Viral Vector Based Manufacturing Market for Genetic Disorders, Historical Trends (since 2021) and Forecasted Estimates (till 2035), Conservative, Base and Optimistic Scenarios (USD Million)
- Table 33.153 Adeno-associated Viral Vector Based Manufacturing Market for Hematological Disorders, Historical Trends (since 2021) and Forecasted Estimates (till 2035), Conservative, Base and Optimistic Scenarios (USD Million)
- Table 33.154 Adeno-associated Viral Vector Based Manufacturing Market for Neurological Disorders, Historical Trends (since 2021) and Forecasted Estimates (till 2035), Conservative, Base and Optimistic Scenarios (USD Million)
- Table 33.155 Adeno-associated Viral Vector Based Manufacturing Market for Metabolic Disorders, Historical Trends (since 2021) and Forecasted Estimates (till 2035), Conservative, Base and Optimistic Scenarios (USD Million)
- Table 33.156 Adeno-associated Viral Vector Based Manufacturing Market for Sensory Disorders, Historical Trends (since 2021) and Forecasted Estimates (till 2035), Conservative, Base and Optimistic Scenarios (USD Million)
- Table 33.157 Adeno-associated Viral Vector Based Manufacturing Market for Ophthalmic Disorders, Historical Trends (since 2021) and Forecasted Estimates (till 2035), Conservative, Base and Optimistic Scenarios (USD Million)
- Table 33.158 Adeno-associated Viral Vector Based Manufacturing Market for Dermatological Disorders, Forecasted Estimates (till 2035), Conservative, Base and Optimistic Scenarios (USD Million)
- Table 33.159 Adeno-associated Viral Vector Based Manufacturing Market for Others, Historical Trends (since 2021) and Forecasted Estimates (till 2035), Conservative, Base and Optimistic Scenarios (USD Million)
- Table 33.160 Adeno-associated Viral Vector Based Manufacturing Market: Distribution by Geographical Regions
- Table 33.161 Adeno-associated Viral Vector Based Manufacturing Market in North America, Historical Trends (since 2021) and Forecasted Estimates (till 2035), Conservative, Base and Optimistic Scenarios (USD Million)
- Table 33.162 Adeno-associated Viral Vector Based Manufacturing Market in Europe, Historical Trends (since 2021) and Forecasted Estimates (till 2035), Conservative, Base and Optimistic Scenarios (USD Million)
- Table 33.163 Adeno-associated Viral Vector Based Manufacturing Market in Asia-Pacific, Historical Trends (since 2021) and Forecasted Estimates (till 2035), Conservative, Base and Optimistic Scenarios (USD Million)
- Table 33.164 Adeno-associated Viral Vector Based Manufacturing Market in Middle east and North Africa, Historical Trends (since 2021) and Forecasted Estimates (till 2035), Conservative, Base and Optimistic Scenarios (USD Million)
- Table 33.165 Adeno-associated Viral Vector Based Manufacturing Market in Latin America and Rest of the World, Historical Trends (since 2021) and Forecasted Estimates (till 2035), Conservative, Base and Optimistic Scenarios (USD Million)
- Table 33.166 Adeno-associated Viral Vector Based Manufacturing Market: Distribution by Commercial, Clinical and Preclinical Stage Products
- Table 33.167 Adeno-associated Viral Vector Based Manufacturing Market for Commercial Stage Products, Historical Trends (since 2021) and Forecasted Estimates (till 2035), Conservative, Base and Optimistic Scenarios (USD Million)
- Table 33.168 Adeno-associated Viral Vector Based Manufacturing Market for Commercial Stage Products: Distribution by Therapeutic Area
- Table 33.169 Adeno-associated Viral Vector Based Manufacturing Market for Commercial Stage Products: Distribution by Route of Administration
- Table 33.170 Adeno-associated Viral Vector Based Manufacturing Market for Commercial Stage Products: Distribution by Geographical Regions
- Table 33.171 Adeno-associated Viral Vector Based Manufacturing Market for Clinical Stage Products, Historical Trends (since 2021) and Forecasted Estimates (till 2035), Conservative, Base and Optimistic Scenarios (USD Million)
- Table 33.172 Adeno-associated Viral Vector Based Manufacturing Market for Clinical Stage Products: Distribution by Phase of Development
- Table 33.173 Adeno-associated Viral Vector Based Manufacturing Market for Clinical Stage Products: Distribution by Therapeutic Area
- Table 33.174 Adeno-associated Viral Vector Based Manufacturing Market for Clinical Stage Products: Distribution by Geographical Regions
- Table 33.175 Adeno-associated Viral Vector Based Manufacturing Market for Preclinical Stage Products, Historical Trends (since 2021) and Forecasted Estimates (till 2035), Conservative, Base and Optimistic Scenarios (USD Million)
- Table 33.176 Adeno-associated Viral Vector Based Manufacturing Market for Preclinical Stage Products: Distribution by Therapeutic Area
- Table 33.177 Adeno-associated Viral Vector Based Manufacturing Market for Preclinical Stage Products: Distribution by Animal Model Used
- Table 33.178 Adeno-associated Viral Vector Based Manufacturing Market for Preclinical Stage Products: Distribution by Geographical Region
List of Figures
- Figure 2.1 Research Methodology: Project Methodology
- Figure 2.2 Research Methodology: Data Sources for Secondary Research
- Figure 2.3 Research Methodology: Robust Quality Control
- Figure 3.1 Market Dynamics: Forecast Methodology
- Figure 3.2 Market Dynamics: Market Assessment Framework
- Figure 4.1 Lessons Learnt from Past Recessions
- Figure 5.1 Executive Summary: Market Landscape
- Figure 5.2 Executive Summary: Market Trends
- Figure 5.3 Executive Summary: Market Forecast and Opportunity Analysis
- Figure 6.1 Classification of Vectors
- Figure 6.2 Structure of Adeno-associated Viral Vector
- Figure 6.3 Lytic Cycle of Adeno-associated Viral Vector
- Figure 6.4 Lysogenic Cycle of Adeno-associated Viral Vector
- Figure 7.1 Adeno-associated Viral Vector Based Therapies: Distribution by Status of Development
- Figure 7.2 Adeno-associated Viral Vector Based Therapies: Distribution by Therapeutic Area
- Figure 7.3 Adeno-associated Viral Vector Based Therapies: Distribution by Status of Development and Therapeutic Area
- Figure 7.4 Adeno-associated Viral Vector Based Therapies: Distribution by Type of Gene / Molecule Targeted
- Figure 7.5 Adeno-associated Viral Vector Based Therapies: Distribution by Type of Therapy
- Figure 7.6 Adeno-associated Viral Vector Based Therapies: Distribution by Type of Gene Delivery Method Used
- Figure 7.7 Adeno-associated Viral Vector Based Therapies: Distribution by Route of Administration
- Figure 7.8 Adeno-associated Viral Vector Based Therapies: Distribution by Special Designation Awarded
- Figure 7.9 Adeno-associated Viral Vector Based Therapy Developers: Distribution by Year of Establishment
- Figure 7.10 Adeno-associated Viral Vector Based Therapy Developers: Distribution by Company Size
- Figure 7.11 Adeno-associated Viral Vector Based Therapy Developers: Distribution by Location of Headquarters (Region)
- Figure 7.12 Adeno-associated Viral Vector Based Therapy Developers: Distribution by Company Size and Location of Headquarters (Region)
- Figure 7.13 Most Active Developers: Distribution by Number of Therapies Developed
- Figure 8.1 Adeno-associated Viral Vector Manufacturers: Distribution by Year of Establishment
- Figure 8.2 Adeno-associated Viral Vector Manufacturers: Distribution by Company Size
- Figure 8.3 Adeno-associated Viral Vector Manufacturers: Distribution by Location of Headquarters
- Figure 8.4 Adeno-associated Viral Vector Manufacturers: Distribution by Type of Product Manufactured
- Figure 8.5 Adeno-associated Viral Vector Manufacturers: Distribution by Type of Vector Manufactured
- Figure 8.6 Adeno-associated Viral Vector Manufacturers: Distribution by Scale of Operation
- Figure 8.7 Adeno-associated Viral Vector Manufacturers: Distribution by Type of Manufacturer
- Figure 8.8 Adeno-associated Viral Vector Manufacturers: Distribution by Type of Manufacturer and Company Size
- Figure 8.9 Adeno-associated Viral Vector Manufacturers: Distribution by Location of Manufacturing Facilities (Region)
- Figure 8.10 Adeno-associated Viral Vector Manufacturers: Distribution by Location of Manufacturing Facilities (Country)
- Figure 8.11 Adeno-associated Viral Vector Manufacturers: Distribution by Application Area
- Figure 9.1 Adeno-associated Viral Vector Manufacturing Technologies / Platforms: Distribution by Type of Vector Manufactured
- Figure 9.2 Adeno-associated Viral Vector Manufacturing Technologies / Platforms: Distribution by Type of Viral Vector Manufactured
- Figure 9.3 Adeno-associated Viral Vector Manufacturing Technologies / Platforms: Distribution by Scale of Operation
- Figure 9.4 Adeno-associated Viral Vector Manufacturing Technologies / Platforms: Distribution by Application Area
- Figure 9.5 Adeno-associated Viral Vector Manufacturing Technologies / Platforms: Distribution by Therapeutic Area
- Figure 9.6 Adeno-associated Viral Vector Technology / Platform Providers: Distribution by Year of Establishment
- Figure 9.7 Adeno-associated Viral Vector Technology Platform Providers: Distribution by Company Size
- Figure 9.8 Adeno-associated Viral Vector Technology / Platform Providers: Distribution by Location of Headquarters (Region)
- Figure 9.9 Adeno-associated Viral Vector Technology / Platform Providers: Distribution by Location of Headquarters (Country)
- Figure 9.10 Adeno-associated Viral Vector Technology / Platform Providers: Distribution by Company Size and Location of Headquarters
- Figure 9.11 Most Active Players: Distribution by Number of Technologies / Platforms
- Figure 10.1 Company Competitiveness Analysis: Overview of Peer Group I
- Figure 10.2 Company Competitiveness Analysis: Overview of Peer Group II
- Figure 10.3 Company Competitiveness Analysis: Overview of Peer Group III
- Figure 10.4 Company Competitiveness Analysis: Adeno-associated Viral Vector Manufacturers Headquartered in North America (Peer Group I)
- Figure 10.5 Company Competitiveness Analysis: Adeno-associated Viral Vector Manufacturers Headquartered in Europe (Peer Group II)
- Figure 10.6 Company Competitiveness Analysis: Adeno-associated Viral Vector Manufacturers Headquartered in Asia-Pacific (Peer Group III)
- Figure 11.1 Technology Competitiveness Analysis: Overview of Peer Group I
- Figure 11.2 Technology Competitiveness Analysis: Overview of Peer Group II
- Figure 11.3 Technology Competitiveness Analysis: Adeno-associated Viral Vector Technologies / Platforms Provided by Companies Headquartered in North America (Peer Group I)
- Figure 11.4 Technology Competitiveness Analysis: Adeno-associated Viral Vector Technologies / Platforms Provided by Companies Headquartered in Europe and Asia-Pacific (Peer Group II)
- Figure 12.1 Elevidys: Development Timeline
- Figure 12.2 Hemgenix: Development Timeline
- Figure 12.3 KEBILIDI: Development Timeline
- Figure 12.4 Luxturna: Development Timeline
- Figure 12.5 Roctavian: Development Timeline
- Figure 12.6 Zolgensma: Development Timeline
- Figure 13.1 Astellas Pharma: Annual Revenues, since FY 2021 (YEN Billion)
- Figure 13.2 Charles River Laboratories: Annual Revenues, since FY 2021 (USD Billion)
- Figure 13.3 Lonza: Annual Revenues, since FY 2021 (CHF Billion)
- Figure 13.4 Thermo Fisher Scientific (Parent Company of Patheon Pharma Services): Annual Revenues, since FY 2021 (USD Billion)
- Figure 13.5 Sanofi: Annual Revenues, since FY 2021 (EUR Billion)
- Figure 13.6 WuXi AppTec: Annual Revenues, since FY 2021 (RMB Billion)
- Figure 14.1 Clinical Trial Analysis: Cumulative Distribution by Trial Registration Year, since 2020
- Figure 14.2 Clinical Trial Analysis: Distribution of Patients Enrolled by Trial Registration Year, since 2020
- Figure 14.3 Clinical Trial Analysis: Distribution by Trial Phase
- Figure 14.4 Clinical Trial Analysis: Distribution of Patients Enrolled by Trial Phase
- Figure 14.5 Clinical Trial Analysis: Distribution by Trial Status
- Figure 14.6 Clinical Trial Analysis: Cumulative Year-wise Trend by Trial Status
- Figure 14.7 Clinical Trial Analysis: Distribution of Patient Enrolled by Trial Status
- Figure 14.8 Clinical Trial Analysis: Distribution by Target Patient Population
- Figure 14.9 Clinical Trial Analysis: Distribution by Patient Gender
- Figure 14.10 Clinical Trial Analysis: Distribution by Type of Sponsor / Collaborator
- Figure 14.11 Clinical Trial Analysis: Distribution by Type of Patient Allocation Model Used
- Figure 14.12 Clinical Trial Analysis: Distribution by Type of Trial Masking Adopted
- Figure 14.13 Clinical Trial Analysis: Distribution by Type of Intervention Model
- Figure 14.14 Clinical Trial Analysis: Distribution by Trial Purpose
- Figure 14.15 Most Active Industry Players: Distribution by Number of Clinical Trials Sponsored / Collaborated
- Figure 14.16 Most Active Non-Industry Players: Distribution by Number of Clinical Trials Sponsored / Collaborated
- Figure 14.17 Clinical Trial Analysis: Distribution of Clinical Trials by Geography
- Figure 14.18 Clinical Trial Analysis: Distribution of Clinical Trials by Geography and Trial Status
- Figure 14.19 Clinical Trial Analysis: Distribution of Patients Enrolled by Geography and Trial Status
- Figure 14.20 Clinical Trial Analysis: Distribution of Clinical Trials by Geography, Trial Status and Trial Phase
- Figure 15.1 Adeno-associated Viral Vector Based Therapy Developers: Cumulative Year-wise Trend, since 2017
- Figure 15.2 Adeno-associated Viral Vector Based Therapy Developers: Distribution by Type of Partnership
- Figure 15.3 Adeno-associated Viral Vector Based Therapy Developers: Distribution by Year and Type of Partnership, since 2022
- Figure 15.4 Adeno-associated Viral Vector Based Therapy Developers: Distribution by Year of Partnership and Type of Partner, since 2022
- Figure 15.5 Adeno-associated Viral Vector Based Therapy Developers: Distribution by Type of Partnership and Type of Partner
- Figure 15.6 Adeno-associated Viral Vector Based Therapy Developers: Distribution by Therapeutic Area
- Figure 15.7 Most Active Players: Distribution by Number of Partnerships
- Figure 15.8 Adeno-associated Viral Vector Based Therapy Developers: Distribution by Country
- Figure 15.9 Adeno-associated Viral Vector Based Therapy Developers: Distribution by Region
- Figure 15.10 Adeno-associated Viral Vector Manufacturers: Cumulative Year-wise Trend, since 2017
- Figure 15.11 Adeno-associated Viral Vector Manufacturers: Distribution by Type of Partnership
- Figure 15.12 Adeno-associated Viral Vector Manufacturers: Distribution by Year and Type of Partnership, since 2022
- Figure 15.13 Adeno-associated Viral Vector Manufacturers: Distribution by Year of Partnership and Type of Partner, since 2022
- Figure 15.14 Adeno-associated Viral Vector Manufacturers: Distribution by Type of Partnership and Type of Partner
- Figure 15.15 Adeno-associated Viral Vector Manufacturers: Distribution by Therapeutic Area
- Figure 15.16 Adeno-associated Viral Vector Manufacturers: Distribution by Application Area
- Figure 15.17 Most Active Players: Distribution by Number of Partnerships
- Figure 15.18 Adeno-associated Viral Vector Manufacturers: Distribution by Country
- Figure 15.19 Adeno-associated Viral Vector Manufacturers: Distribution by Region
- Figure 17.1 Patent Analysis: Distribution by Type of Patent
- Figure 17.2 Patent Analysis: Distribution by Patent Application Year, since pre-2019
- Figure 17.3 Patent Analysis: Distribution by Publication Year, since 2021
- Figure 17.4 Patent Analysis: Type of Patent and Publication Year, since 2021
- Figure 17.5 Patent Analysis: Distribution by Patent Jurisdiction
- Figure 17.6 Patent Analysis: Distribution by CPC Symbols
- Figure 17.7 Patent Analysis: Cumulative Year-wise Distribution by Type of Applicant, since 2021
- Figure 17.8 Leading Industry Players: Distribution by Number of Patents
- Figure 17.9 Leading Non-Industry Players: Distribution by Number of Patents
- Figure 17.10 Leading Patent Assignees: Distribution by Number of Patents
- Figure 17.11 Patent Benchmarking Analysis: Distribution by Patent Characteristics (CPC Codes) by Leading Industry Players
- Figure 17.12 Patent Benchmarking Analysis: Distribution of Leading Industry Players by Patent Characteristics (CPC Codes)
- Figure 17.13 Patent Valuation: Distribution of Patents by Age
- Figure 17.14 AAV Vector Market: Patent Valuation
- Figure 18.1 Start-up Health Indexing: Distribution by Location of Headquarters
- Figure 18.2 Start-up Health Indexing: Distribution by Pipeline Strength
- Figure 18.3 Start-up Health Indexing: Distribution by Pipeline Maturity
- Figure 18.4 Start-up Health Indexing: Distribution by Indication Diversity
- Figure 18.5 Start-up Health Indexing: Distribution by Patent Strength
- Figure 18.6 Start-up Health Indexing: Distribution by Partnership Activity
- Figure 18.7 Start-up Health Indexing: Roots Analysis Perspective
- Figure 18.8 Leading Start-ups: Spider Web Analysis
- Figure 19.1 Outsourcing: Go / No Go Framework
- Figure 19.2 Outsourcing: Go / No Go Framework for Adeno-associated Viral Vector Based Therapy Developers
- Figure 19.3 Adeno-associated Viral Vector Based Therapy Developers: Benchmarking of Small Companies
- Figure 19.4 Adeno-associated Viral Vector Based Therapy Developers: Benchmarking of Mid-sized Companies
- Figure 19.5 Adeno-associated Viral Vector Based Therapy Developers: Benchmarking of Large Companies
- Figure 20.1 Global Adeno-associated Viral Vector Based Therapeutics Market, Historical Trends (since 2021) and Forecasted Estimates (till 2035) (USD Million)
- Figure 20.2 Global Adeno-associated Viral Vector Based Therapeutics Market, Forecasted Estimates (till 2035): Conservative Scenario (USD Million)
- Figure 20.3 Adeno-associated Viral Vector Based Therapeutics Market, Forecasted Estimates (till 2035): Optimistic Scenario (USD Million)
- Figure 21.1 Adeno-associated Viral Vector Based Therapeutics Market: Distribution by Therapeutic Area
- Figure 21.2 Adeno-associated Viral Vector Based Therapeutics Market for Muscle-related Disorders: Historical Trends (since 2023) and Forecasted Estimates (till 2035) (USD Million)
- Figure 21.3 Adeno-associated Viral Vector Based Therapeutics Market for Genetic Disorders: Historical Trends (since 2021) and Forecasted Estimates (till 2035) (USD Million)
- Figure 21.4 Adeno-associated Viral Vector Based Therapeutics Market for Hematological Disorders: Historical Trends (since 2022) and Forecasted Estimates (till 2035) (USD Million)
- Figure 21.5 Adeno-associated Viral Vector Based Therapeutics Market for Ophthalmic Disorders: Historical Trends (since 2021) and Forecasted Estimates (till 2035) (USD Million)
- Figure 21.6 Adeno-associated Viral Vector Based Therapeutics Market for Dermatological Disorders: Forecasted Estimates (till 2035) (USD Million)
- Figure 21.7 Adeno-associated Viral Vector Based Therapeutics Market for Metabolic Disorders: Historical Trends (since 2022) and Forecasted Estimates (till 2035) (USD Million)
- Figure 22.1 Adeno-associated Viral Vector Based Therapeutics Market: Distribution by Type of Therapy
- Figure 22.2 Adeno-associated Viral Vector Based Therapeutics Market for Gene Augmentation Therapies: Historical Trends (since 2021) and Forecasted Estimates (till 2035) (USD Million)
- Figure 22.3 Adeno-associated Viral Vector Based Therapeutics Market for Gene Regulation Therapy: Forecasted Estimates (till 2035) (USD Million)
- Figure 23.1 Adeno-associated Viral Vector Based Therapeutics Market: Distribution by Route of Administration
- Figure 23.2 Adeno-associated Viral Vector Based Therapeutics Market for Intravenous Route: Historical Trends (since 2021) and Forecasted Estimates (till 2035) (USD Million)
- Figure 23.3 Adeno-associated Viral Vector Based Therapeutics Market for Subretinal Route: Historical Trends (since 2021) and Forecasted Estimates (till 2035) (USD Million)
- Figure 23.4 Adeno-associated Viral Vector Based Therapeutics Market for Intravitreal Route: Historical Trends (since 2022) and Forecasted Estimates (till 2035) (USD Million)
- Figure 23.5 Adeno-associated Viral Vector Based Therapeutics Market for Other Routes: Historical Trends (since 2022) and Forecasted Estimates (till 2035) (USD Million)
- Figure 24.1 Adeno-associated Viral Vector Based Therapeutics Market: Distribution by Geographical Regions
- Figure 24.2 Adeno-associated Viral Vector Based Manufacturing Market in North America, Historical Trends (since 2021) and Forecasted Estimates (till 2035) (USD Million)
- Figure 24.3 Adeno-associated Viral Vector Based Manufacturing Market in Europe, Historical Trends (since 2021) and Forecasted Estimates (till 2035) (USD Million)
- Figure 24.4 Adeno-associated Viral Vector Based Manufacturing Market in Asia-Pacific, Historical Trends (since 2021) and Forecasted Estimates (till 2035) (USD Million)
- Figure 24.5 Adeno-associated Viral Vector Based Manufacturing Market in Latin America and Rest of the World, Historical Trends (since 2021) and Forecasted Estimates (till 2035) (USD Million)
- Figure 25.1 Adeno-associated Vector Based Therapeutics Market: Luxturna Sales Forecast, till 2035 (USD Million)
- Figure 25.2 Adeno-associated Vector Based Therapeutics Market: Hemgenix Sales Forecast, till 2035 (USD Million)
- Figure 25.3 Adeno-associated Vector Based Therapeutics Market: Zolgensma Sales Forecast, till 2035 (USD Million)
- Figure 25.4 Adeno-associated Vector Based Therapeutics Market: Roctavian Sales Forecast, till 2035 (USD Million)
- Figure 25.5 Adeno-associated Vector Based Therapeutics Market: Elevidys Sales Forecast, till 2035 (USD Million)
- Figure 25.6 Adeno-associated Vector Based Therapeutics Market: Upstaza Sales Forecast, till 2035 (USD Million)
- Figure 25.7 Adeno-associated Vector Based Therapeutics Market: EB 101 Sales Forecast, till 2035 (USD Million)
- Figure 25.8 Adeno-associated Vector Based Therapeutics Market: BBM H901 Sales Forecast, till 2035 (USD Million)
- Figure 25.9 Adeno-associated Vector Based Therapeutics Market: AGTC 501 Sales Forecast, till 2035 (USD Million)
- Figure 25.10 Adeno-associated Vector Based Therapeutics Market: Lumevoq Sales Forecast, till 2025 (USD Million)
- Figure 25.11 Adeno-associated Vector Based Therapeutics Market: NFS-01 Sales Forecast, till 2035 (USD Million)
- Figure 25.12 Adeno-associated Vector Based Therapeutics Market: RGX-314 Sales Forecast, till 2035 (USD Million)
- Figure 25.13 Adeno-associated Vector Based Therapeutics Market: SPK-8011 Sales Forecast, till 2035 (USD Million)
- Figure 25.14 Adeno-associated Vector Based Therapeutics Market: Giroctocogene fitelparvovec Sales Forecast, till 2035 (USD Million)
- Figure 25.15 Adeno-associated Vector Based Therapeutics Market: RGX-121 Sales Forecast, till 2035 (USD Million)
- Figure 25.16 Adeno-associated Vector Based Therapeutics Market: DTx-401 Sales Forecast, till 2035 (USD Million)
- Figure 25.17 Adeno-associated Vector Based Therapeutics Market: DTx-301 Sales Forecast, till 2035 (USD Million)
- Figure 25.18 Adeno-associated Vector Based Therapeutics Market: ABO-102 Sales Forecast, till 2035 (USD Million)
- Figure 25.19 Adeno-associated Vector Based Therapeutics Market: AAV-RPE65 Sales Forecast, till 2035 (USD Million)
- Figure 25.20 Adeno-associated Vector Based Therapeutics Market: Ixoberogene Soroparvovec Sales Forecast, till 2035 (USD Million)
- Figure 25.21 Adeno-associated Vector Based Therapeutics Market: OCU400 Sales Forecast, till 2035 (USD Million)
- Figure 26.1 Global Adeno-associated Viral Vector Based Manufacturing Market, Historical Trends (since 2021) and Forecasted Estimates (till 2035) (USD Million)
- Figure 26.2 Global Adeno-associated Viral Vector Based Manufacturing Market, Forecasted Estimates (till 2035): Conservative Scenario (USD Million)
- Figure 26.3 Global Adeno-associated Viral Vector Based Manufacturing Market Forecasted Estimates (till 2035): Optimistic Scenario (USD Million)
- Figure 27.1 Adeno-associated Viral Vector Based Manufacturing Market: Distribution by Stage of Development
- Figure 27.2 Adeno-associated Viral Vector Based Manufacturing Market for Commercial Stage Products, Historical Trends (since 2021) and Forecasted Estimates (till 2035) (USD Million)
- Figure 27.3 Adeno-associated Viral Vector Based Manufacturing Market for Clinical Stage Products, Historical Trends (since 2021) and Forecasted Estimates (till 2035) (USD Million)
- Figure 27.4 Adeno-associated Viral Vector Based Manufacturing Market for Preclinical Stage Products, Historical Trends (since 2021) and Forecasted Estimates (till 2035) (USD Million)
- Figure 28.1 Adeno-associated Viral Vector Based Manufacturing Market: Distribution by Therapeutic Area, 2021, 2025 and 2035
- Figure 28.2 Adeno-associated Viral Vector Based Manufacturing Market for Oncological Disorders, Historical Trends (since 2021) and Forecasted Estimates (till 2035) (USD Million)
- Figure 28.3 Adeno-associated Viral Vector Based Manufacturing Market for Rare Disorders, Historical Trends (since 2021) and Forecasted Estimates (till 2035) (USD Million)
- Figure 28.4 Adeno-associated Viral Vector Based Manufacturing Market for Musculoskeletal Disorders, Historical Trends (since 2021) and Forecasted Estimates (till 2035) (USD Million)
- Figure 28.5 Adeno-associated Viral Vector Based Manufacturing Market for Genetic Disorders, Historical Trends (since 2021) and Forecasted Estimates (till 2035) (USD Million)
- Figure 28.6 Adeno-associated Viral Vector Based Manufacturing Market for Hematological Disorders, Historical Trends (since 2021) and Forecasted Estimates (till 2035) (USD Million)
- Figure 28.7 Adeno-associated Viral Vector Based Manufacturing Market for Neurological Disorders, Historical Trends (since 2021) and Forecasted Estimates (till 2035) (USD Million)
- Figure 28.8 Adeno-associated Viral Vector Based Manufacturing Market for Metabolic Disorders, Historical Trends (since 2021) and Forecasted Estimates (till 2035) (USD Million)
- Figure 28.9 Adeno-associated Viral Vector Based Manufacturing Market for Sensory Disorders, Historical Trends (since 2021) and Forecasted Estimates (till 2035) (USD Million)
- Figure 28.10 Adeno-associated Viral Vector Based Manufacturing Market for Ophthalmic Disorders, Historical Trends (since 2021) and Forecasted Estimates (till 2035) (USD Million)
- Figure 28.11 Adeno-associated Viral Vector Based Manufacturing Market for Dermatological Disorders, Forecasted Estimates (till 2035) (USD Million)
- Figure 28.12 Adeno-associated Viral Vector Based Manufacturing Market for Others, Historical Trends (since 2021) and Forecasted Estimates (till 2035) (USD Million)
- Figure 29.1 Adeno-associated Viral Vector Based Manufacturing Market: Distribution by Geographical Regions
- Figure 29.2 Adeno-associated Viral Vector Based Manufacturing Market in North America, Historical Trends (since 2021) and Forecasted Estimates (till 2035) (USD Million)
- Figure 29.3 Adeno-associated Viral Vector Based Manufacturing Market in Europe, Historical Trends (since 2021) and Forecasted Estimates (till 2035) (USD Million)
- Figure 29.4 Adeno-associated Viral Vector Based Manufacturing Market in Asia-Pacific, Historical Trends (since 2021) and Forecasted Estimates (till 2035) (USD Million)
- Figure 29.5 Adeno-associated Viral Vector Based Manufacturing Market in Middle East and North Africa, Historical Trends (since 2021) and Forecasted Estimates (till 2035) (USD Million)
- Figure 29.6 Adeno-associated Viral Vector Based Manufacturing Market in Latin America and Rest of the World, Historical Trends (since 2021) and Forecasted Estimates (till 2035) (USD Million)
- Figure 29.7 Penetration Growth (P-G) Matrix: Geographical Regions
- Figure 30.1 Adeno-associated Viral Vector Based Manufacturing Market for Commercial Stage Products, Historical Trends (since 2021) and Forecasted Estimates (till 2035) (USD Million)
- Figure 30.2 Adeno-associated Viral Vector Based Manufacturing Market for Commercial Stage Products: Distribution by Therapeutic Area
- Figure 30.3 Adeno-associated Viral Vector Based Manufacturing Market for Commercial Stage Products: Distribution by Route of Administration
- Figure 30.4 Adeno-associated Viral Vector Based Manufacturing Market for Commercial Stage Products: Distribution by Geographical Regions
- Figure 30.5 Adeno-associated Viral Vector Based Manufacturing Market for Clinical Stage Products, Historical Trends (since 2021) and Forecasted Estimates (till 2035) (USD Million)
- Figure 30.6 Adeno-associated Viral Vector Based Manufacturing Market for Clinical Stage Products: Distribution by Phase of Development
- Figure 30.7 Adeno-associated Viral Vector Based Manufacturing Market for Clinical Stage Products: Distribution by Therapeutic Area
- Figure 30.8 Adeno-associated Viral Vector Based Manufacturing Market for Clinical Stage Products: Distribution by Geographical Regions
- Figure 30.9 Adeno-associated Viral Vector Based Manufacturing Market for Preclinical Stage Products, Historical Trends (since 2021) and Forecasted Estimates (till 2035) (USD Million)
- Figure 30.10 Adeno-associated Viral Vector Based Manufacturing Market for Preclinical Stage Products: Distribution by Therapeutic Area
- Figure 30.11 Adeno-associated Viral Vector Based Manufacturing Market for Preclinical Stage Products: Distribution by Animal Model Used
- Figure 30.12 Adeno-associated Viral Vector Based Manufacturing Market for Preclinical Stage Products: Distribution by Geographical Regions
- Figure 31.1 Concluding Remarks: Adeno-Associated Viral Vector Based Therapies Market Landscape
- Figure 31.2 Concluding Remarks: Adeno-Associated Viral Vector Based Manufacturers and Technologies / Platforms Landscape
- Figure 31.3 Concluding Remarks: Clinical Trial Analysis
- Figure 31.4 Concluding Remarks: Partnerships and Collaborations
- Figure 31.5 Concluding Remarks: Patent Analysis
- Figure 31.6 Concluding Remarks: Adeno-Associated Viral Vector-based Therapy Market Forecast
- Figure 31.7 Concluding Remarks: Adeno-Associated Viral Vector Manufacturing Market Forecast
 病毒載體市場規模、佔有率和成長分析:按載體類型、應用、適應症、最終用戶和地區分類-2026-2033年產業預測
 病毒載體合作與授權協議(2016-2026)
 病毒載體市場:按載體類型、治療領域、生產階段、應用和最終用戶分類-2026-2032年全球市場預測AAV包裝服務市場:按容器類型、包裝材料、尺寸、交貨方式、應用和最終用戶分類 - 全球預測 2026-2032
 病毒載體生產市場分析及預測(至2035年):依類型、產品類型、服務、技術、應用、最終用戶、製程、階段、設備分類
 全球病毒載體生產市場規模、佔有率、趨勢和成長分析報告(2026-2034年)
 病毒載體市場規模、佔有率和趨勢分析報告:按載體類型、應用、最終用途、地區和細分市場預測(2026-2033 年)腺病毒純化試劑盒市場按技術、規格、等級、應用和最終用戶分類-全球預測(2026-2032 年)
 AAV載體轉染試劑盒:全球市佔率與排名、總收入與需求預測(2025-2031年)
 非病毒轉染試劑市場:產業趨勢及全球預測-按非病毒轉染方法類型、應用領域、最終用戶及重點地區劃分