


 |
市場調查報告書
商品編碼
1762538
即用型醫藥包裝市場:產業趨勢及全球預測 - 依容器類型、封蓋類型、製造材料及主要地區劃分Ready to Use Pharmaceutical Packaging Market : Industry Trends and Global Forecasts - Distribution by Type of Container, Type of Closure, Material of Fabrication and Key Geographical Regions |
||||||
即用型醫藥包裝市場:概覽
預計2035年,全球即用型醫藥包裝市場規模將從目前的95億美元成長至251億美元,預測期間內年複合成長率為9.2%。
市場區隔包括以下參數的市場規模與機會分析:
容器類型
- 無菌藥筒
- 無菌注射器
- 無菌小瓶
封蓋類型
- 瓶蓋
- 柱塞
- 密封件
- 瓶塞
- 尖端蓋/針套
製造材料
- 鋁
- 玻璃
- 塑膠
- 橡膠
主要地區
- 北美
- 歐洲
- 亞洲
- 拉丁美洲
- 中東和北非
- 世界其他地區
藥品包裝市場的成長與趨勢
多年來,美國食品藥物管理局(FDA)已確認,平均每年約有 50 種藥品獲得 FDA 批准。此外,研究表明,全球每年消耗超過 10萬噸藥品。不斷成長的藥品供應線無意中導致了對初級和二級藥品包裝解決方案的需求相應增加。然而,傳統的初級包裝面臨若干挑戰,包括生產計畫延遲和嚴格的法規。這導致業內人士將重點轉向無菌/RTU(即用型)初級包裝解決方案。
RTU 藥品初級包裝已成為傳統初級包裝的一種有前景的替代方案,為簡化藥品填充和封口操作增添了顯著的價值。這些包裝組件省去了整個灌裝和封口製造過程中的多個步驟(主要是清潔、滅菌和容器準備),有助於提高營運效率,符合現有的監管標準。此外,RTU 包裝系統經過預處理,可去除熱原(人體攝入後會引起發燒的物質),並確保藥物成分符合藥典標準。由於醫用聚合物的其他一些優勢,RTU 容器封蓋系統在製藥業逐漸普及。
即用型藥品包裝市場:關鍵洞察
本報告分析了即用型藥品包裝市場的現狀,並探討了潛在的成長機會。主要調查結果包括:
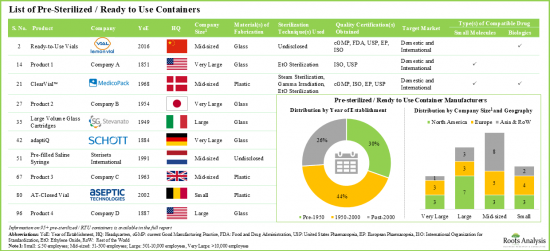
- 目前,近50家製造商銷售或開發超過95種類型的無菌/即用型容器,其中相當一部分是在2000年之前問世的。
- 近45%的即用容器以小瓶形式提供,其中大多數產品採用環氧乙烷(EtO)滅菌。
- 全球各地的不同公司生產約85種無菌/即用型瓶蓋,其中約60%的總部位於亞洲。
- 各種即用型瓶蓋可與小瓶、注射器和卡式瓶等各種類型的容器相容,為生物製劑和小分子製劑提供最佳的包裝解決方案。
- 為了獲得競爭優勢,從事即用型容器和封蓋製造的公司目前正致力於在各自的產品中融入先進功能。
- 約有40家公司聲稱提供具有不同自由度的機器人,以提高各種製藥操作的生產力和靈活性。
- 從合作活動中可以明顯看出,利害關係人對即用型容器和封蓋領域的興趣日益濃厚。
- 基於知識資本,提出了一個獨特的框架,使利害關係人能夠評估進入無菌/即用型初級包裝產業的可行性。
- 預計未來幾年,小瓶將佔無菌/即用型容器需求的近55%。
- 預計即用型初級包裝市場未來幾年將以 9.2%的年複合成長率成長,主要得益於無菌/RTU 容器帶來的收入。
- RTU 藥品包裝的預測機會可能分佈在不同類型的初級包裝系統、製造材料和主要地理區域。
- 由於對能夠滿足複雜藥品要求的先進包裝材料和技術的需求不斷成長,該行業存在多種成長機會。
即用型藥品包裝市場:主要細分市場
依容器類型,市場細分為無菌卡式瓶、無菌注射器和無菌小瓶。目前,無菌注射器市場在全球即用型醫藥包裝市場。此外,無菌小瓶細分市場的即用型醫藥包裝預計在預測期內將展現最高的市場成長潛力。
依封蓋類型,市場細分為瓶蓋、柱塞、密封件、瓶塞和針頭蓋/針頭護罩。目前,柱塞區隔在全球即用型醫藥包裝市場中佔有最大佔有率。然而,預計瓶蓋區隔在預測期內的年複合成長率將更高。
依製造材料細分,市場細分為鋁、玻璃、塑膠和橡膠。目前,塑膠區隔在全球即用型醫藥包裝市場中所佔比例最高,其次是玻璃區隔,預計在預測期內玻璃區隔將以更高的年複合成長率成長。
依主要地區劃分,市場細分為北美、歐洲、亞洲、拉丁美洲、中東和非洲以及世界其他地區。目前,亞洲在全球即用型醫藥包裝市場佔據主導地位,佔據最大的收入佔有率。此外,亞洲市場未來年複合成長率可能更高。
醫藥包裝市場參與者
- APG Pharma
- Aptar
- Daikyo Seiko
- Datwyler
- DWK Life Sciences
- Ningbo Zhengli Pharmaceutical Packaging
- SCHOTT
- Stevanto
- West Pharmaceutical Services
目錄
第1章 簡介
第2章 研究方法
第3章 經濟及其他專案特定考量
- 章節概述
- 市場動態
第4章 執行摘要
- 章節概述
第5章 導論
- 章節概述
- 藥品包裝與填充
- 即用型內包裝
- 結論
第6章 無菌/即用型容器:市場格局
- 章節概述
- 無菌/即用型容器:市場格局
- 無菌/即用型容器:製造商格局
第7章 無菌/即用型封蓋:市場格局
- 章節概述
- 無菌/即用型封蓋:市場格局
- 無菌/即用型封蓋:製造商格局
第8章 關鍵洞察
- 章節概述
- 無菌/即用型容器:關鍵洞察
- 無菌/即用型封蓋:關鍵洞察
第9章 產品競爭力分析:無菌/即用型容器
- 章節概述
- 無菌/即用型容器:產品競爭力分析
第10章 產品競爭力分析:無菌/即用型瓶蓋
- 章節概述
- 無菌/即用型瓶蓋:產品競爭力分析
第11章 公司簡介
- 章節概述
- APG Pharma Packaging
- Aptar
- Daikyo Seiko
- Datwyler
- DWK Life Sciences
- Ningbo Zhengli Pharmaceutical Packaging
- SCHOTT
- Stevanato
- West Pharmaceutical Services
第12章 合作夥伴關係與合作
- 章節概述
- 合作夥伴關係模式
- 無菌/即用型藥品包裝:夥伴關係與合作
第13章 市場進入決策架構
- 章節概述
- 關鍵假設與研究方法
- 影響市場進入決策的關鍵參數
- 結論
第14章 需求分析
- 章節概述
- 範圍與研究方法
- 全球無菌/即用型藥品包裝需求:依容器類型
- 全球無菌/即用型藥品包裝需求:依封口類型
- 全球無菌/即用型藥品包裝需求:依製造材料
- 全球無菌/即用型藥品包裝需求:依主要地區
第15章 市場影響分析:驅動因素、限制因素、機會與挑戰
第16章 全球無菌/即用型醫藥包裝市場
- 章節概述
- 假設與研究方法
- 全球無菌/即用型醫藥包裝市場的歷史趨勢(2018年至今)及預測(至2035年)
- 主要市場細分
- 動態資料分析shboard
第17章 無菌/即用型藥品包裝市場:依容器類型
- 章節概述
- 關鍵假設與研究方法
- 無菌/即用型藥品包裝市場:依容器型式
- 資料三角測量與驗證
第18章 無菌/即用型藥品包裝市場:依封蓋類型
- 章節概述
- 關鍵假設與研究方法
- 無菌/即用型藥品包裝市場:依封蓋類型
- 資料三角測量與驗證
第19章 無菌/即用型藥品包裝市場:依製造材料
- 章節概述
- 關鍵假設與研究方法
- 無菌/即用型藥品包裝市場:依製造材料
- 資料三角測量與驗證
第20章 無菌/即用型藥品包裝市場:依主要地區
- 章節概述
- 關鍵假設與研究方法
- 北美
- 歐洲
- 亞洲
- 拉丁美洲
- 中東和北非
- 世界其他地區
- 資料三角測量與驗證
第21章 藥品包裝的新興趨勢
- 章節概述
- 新興趨勢
- 結論
第22章 案例研究:藥品包裝中的機器人技術
- 第概述
- 製藥業的機器人技術
- 為製藥業提供機器人的公司
- 為藥品包裝提供設備整合機器人系統的公司
- 結論
第23章 結論
第24章 高層洞察
第25章 附錄1:表格資料
第26章 附錄2:公司與組織清單
READY TO USE PHARMACEUTICAL PACKAGING MARKET: OVERVIEW
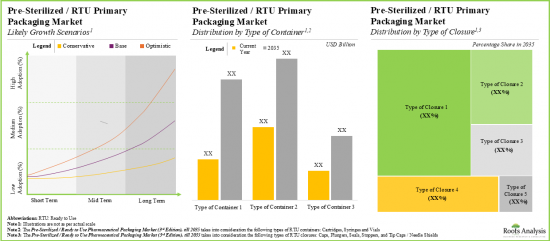
As per Roots Analysis, the global ready-to-use pharmaceutical packaging market is estimated to grow from USD 9.5 billion in the current year to USD 25.1 billion by 2035, at a CAGR of 9.2% during the forecast period, till 2035.
The market sizing and opportunity analysis has been segmented across the following parameters:
Type of Container
- Sterile Cartridges
- Sterile Syringes
- Sterile Vials
Type of Closure
- Caps
- Plungers
- Seals
- Stoppers
- Tip Caps / Needle Shields
Material of Fabrication
- Aluminum
- Glass
- Plastic
- Rubber
Key Geographical Regions
- North America
- Europe
- Asia
- Latin America
- Middle East and North Africa
- Rest of the World
READY TO USE PHARMACEUTICAL PACKAGING MARKET: GROWTH AND TRENDS
Over the years, it has been identified that on an average, around 50 drugs are approved by the US Food and Drug Administration (US FDA) annually. Further, studies indicate that more than 100,000 tons of pharmaceutical products are consumed globally per year. The growing pipeline of pharmaceutical drug products has inadvertently led to an increase in the demand for their associated primary and secondary pharmaceutical packaging solutions. However, traditional primary packing is fraught with several challenges, including delayed production timelines and stringent regulations. This has prompted the industry stakeholders to shift their focus towards pre-sterilized / ready to use (RTU) primary packaging solutions.
The ready to use of pharmaceutical primary packaging has emerged as a promising alternative to conventional primary packaging, adding significant value to streamline pharmaceutical fill / finish operations. These packaging components eliminate multiple steps in the overall fill finished manufacturing (mainly washing, sterilizing and preparing containers), thereby, helping improve operational efficiencies in compliance with existing regulatory standards. Further, RTU packaging systems are pre-treated in order to remove pyrogens (substances that can induce fever when introduced into the body) to ensure that the drug components meet pharmacopeial standards. Owing to several other benefits offered by medical polymers, RTU container-closure systems have gradually gained popularity in the pharmaceutical industry.
READY TO USE PHARMACEUTICAL PACKAGING MARKET: KEY INSIGHTS
The report delves into the current state of the ready-to-use pharmaceutical packaging market and identifies potential growth opportunities within industry. Some key findings from the report include:
- Presently, over 95 pre-sterilized / ready-to-use containers are available or being developed by close to 50 manufacturers; a relatively larger proportion of these players were established before 2000.
- Nearly 45% of the ready-to-use containers are being offered as vials; majority of these products are sterilized using ethylene oxide (EtO).
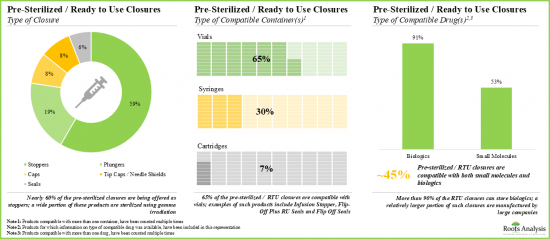
- Around 85 pre-sterilized / RTU closures are being manufactured by players across the globe; ~60% of these firms are headquartered in Asia.
- A wide range of RTU closures are compatible with different types of containers, including vials, syringes and cartridges, providing optimal packaging solutions for biologics and small molecules.
- In pursuit of gaining a competitive edge, companies engaged in the manufacturing of RTU containers and closures are presently focusing on the integration of advanced features into their respective product offerings.
- Around 40 companies claim to offer robotic machinery, with different degrees of freedom, to enhance the productivity and flexibility of various pharmaceutical operations.
- The rising interest of stakeholders in the RTU containers and closures domain is also evident from the partnership activity; in fact, the maximum number of collaborations were inked in the last two years.
- Based on our intellectual capital, we have proposed a proprietary framework enabling stakeholders to evaluate the viability of entering the pre-sterilized / RTU primary packaging industry.
- Vials are expected to account for close to 55% of the demand for pre-sterilized / ready to use containers in the foreseen future.
- The RTU primary packaging market is anticipated to grow at a CAGR of 9.2% over the next few years, primarily driven by the revenues generated from pre-sterilized / ready to use containers.
- The projected opportunity of RTU pharmaceutical packaging is likely to be distributed across different types of primary packaging systems, materials of fabrication and key geographical regions.
- Several growth opportunities exist in the industry owing to the increasing demand for advanced packaging materials and technologies that can accommodate the requirements of complex drug products.
READY TO USE PHARMACEUTICAL PACKAGING MARKET: KEY SEGMENTS
Sterile Syringes Segment holds the Largest Share of the Ready to Use Pharmaceutical Packaging Market
Based on the type of container, the market is segmented into sterile cartridges, sterile syringes and sterile vials. At present, the sterile syringes segment holds the maximum share of the global ready-to-use pharmaceutical packaging market. Further, the ready-to-use pharmaceutical packaging market for the sterile vials segment is expected to show the highest market growth potential during the forecast period.
By Type of Closure, Caps Segment is Expected to Grow at a Faster Pace During the Forecast Period
Based on the type of closure, the market is segmented into caps, plungers, seals, stoppers and tip caps / needle shields. At present, the plungers segment holds the maximum share of the global ready-to-use pharmaceutical packaging market. However, the market for caps segment is expected to grow at a higher CAGR during the forecast period.
By Material of Fabrication, Plastic Segment Accounts for the Largest Share of the Global Ready to Use Pharmaceutical Packaging Market
Based on the material of fabrication, the market is segmented into aluminum, glass, plastic and rubber. Currently, the plastic segment captures the highest proportion of the global ready-to-use pharmaceutical packaging market. This is followed by the glass segment which is expected to grow at a higher CAGR during the forecast period.
Asia Accounts for the Largest Share of the Market
Based on key geographical regions, the market is segmented into North America, Europe, Asia, Latin America, Middle East and North Africa, and Rest of the World. Currently, Asia dominates the global ready-to-use pharmaceutical packaging market and accounts for the largest revenue share. Further, the market in Asia is likely to grow at a higher CAGR in the coming future.
Example Players in the Ready to Use Pharmaceutical Packaging Market
- APG Pharma
- Aptar
- Daikyo Seiko
- Datwyler
- DWK Life Sciences
- Ningbo Zhengli Pharmaceutical Packaging
- SCHOTT
- Stevanto
- West Pharmaceutical Services
READY TO USE PHARMACEUTICAL PACKAGING MARKET: RESEARCH COVERAGE
- Market Sizing and Opportunity Analysis: The report features an in-depth analysis of the global ready-to-use pharmaceutical packaging market, focusing on key market segments, including [A] type of container, [B] type of closure, [C] material of fabrication and [D] key geographical regions.
- Pre-Sterilized / Ready to Use Containers Market Landscape: A comprehensive evaluation of the pre-sterilized / ready to use containers, based on several relevant parameters, such as [A] type of container, [B] material(s) of fabrication, [C] container color, [D] type of compatible drug(s), [E] scale of operation, [F] packaging format(s), [G] sterilization technique(s) used, [H] quality certification(s) obtained, [I] target market, [J] availability of additional coating and RTU kits. Additionally, a comprehensive evaluation of pre-sterilized / ready to use container manufacturers, based on parameters, such as [A] year of establishment, [B] company size (in terms of number of employees) and [C] location of headquarters.
- Pre-Sterilized / Ready to Use Closures Market Landscape: A comprehensive evaluation of the pre-sterilized / ready to use closures, based on several relevant parameters, such as [A] type of closure, [B] material(s) of fabrication, [C] type of compatible container(s), [D] type of compatible drug(s), [E] sterilization technique(s) used, [F] available finish format(s), [G] quality certification(s) obtained, [H] target market and [I] availability of additional coating. Additionally, a comprehensive evaluation of pre-sterilized / ready to use closure manufacturers, based on parameters, such as [A] year of establishment, [B] company size (in terms of number of employees) and [C] location of headquarters.
- Key Insights: In-depth analysis of market trends in the pre-sterilized / ready to use containers and closures domain, based on relevant parameters, such as [A] type of container and scale of operation, [B] type of container and packaging format(s), [C] type of container and material(s) of fabrication, [D] type of container and container color, [E] type of container and sterilization technique(s) used, [F] type of container and type of compatible drug(s), [G] material(s) of fabrication and sterilization technique(s) used, [H] type of closure and material(s) of fabrication, [I] type of closure and sterilization technique(s) used, [J] type of closure and available finish format(s), and [K] type of closure and type of compatible drug(s).
- Product Competitiveness Analysis for Pre-Sterilized / Ready to Use Containers: A comprehensive competitive analysis of various types of pre-sterilized / ready to use containers, examining factors, such as [A] company strength and [B] product competitiveness.
- Product Competitiveness Analysis for Pre-Sterilized / Ready to Use Closures: A comprehensive competitive analysis of various types of pre-sterilized / ready to use closures, examining factors, such as [A] company strength and [B] product competitiveness.
- Company Profiles: In-depth profiles of key players that are engaged in offering pre-sterilized / ready-to-use containers and closures, focusing on [A] overview of the company, [B] financial information (if available), [C] product portfolio and [D] recent developments and an informed future outlook.
- Partnerships and Collaborations: An insightful analysis of the deals inked by stakeholders in the ready-to-use pharmaceutical packaging market, based on several parameters, such as [A] year of partnership, [B] type of partnership. [C] type of partner, [D] focus area, [E] type of packaging system, [F] type of packaging material, [G] most active players and [H] geography.
- Market Entry Decision Making Framework: A comprehensive framework to identify the unmet needs and assist players in entering the pre-sterilized / RTU primary packaging domain, focusing on various factors, such as [A] product reach, [B] market activity, [C] product differentiation, [D] competitiveness and [E] manufacturing complexity.
- Demand Analysis: A detailed assessment of the current and future demand for pre-sterilized / ready to use containers and closures, based on various relevant parameters, such as [A] type of primary packaging system and [B] material of fabrication used.
- Market Impact Analysis: A thorough analysis of various factors, such as drivers, restraints, opportunities, and existing challenges that are likely to impact market growth.
- Case Study: A detailed discussion on the use of robotic machinery in pharmaceutical manufacturing and fill / finish operations, featuring the various advantages of employing automation / automated technologies in such processes.
KEY QUESTIONS ANSWERED IN THIS REPORT
- How many companies are currently engaged in this market?
- Which are the leading companies in this market?
- What factors are likely to influence the evolution of this market?
- What is the current and future market size?
- What is the CAGR of this market?
- How is the current and future market opportunity likely to be distributed across key market segments?
REASONS TO BUY THIS REPORT
- The report provides a comprehensive market analysis, offering detailed revenue projections of the overall market and its specific sub-segments. This information is valuable to both established market leaders and emerging entrants.
- Stakeholders can leverage the report to gain a deeper understanding of the competitive dynamics within the market. By analyzing the competitive landscape, businesses can make informed decisions to optimize their market positioning and develop effective go-to-market strategies.
- The report offers stakeholders a comprehensive overview of the market, including key drivers, barriers, opportunities, and challenges. This information empowers stakeholders to stay abreast of market trends and make data-driven decisions to capitalize on growth prospects.
ADDITIONAL BENEFITS
- Complimentary PPT Insights Packs
- Complimentary Excel Data Packs for all Analytical Modules in the Report
- 15% Free Content Customization
- Detailed Report Walkthrough Session with Research Team
- Free Updated report if the report is 6-12 months old or older
TABLE OF CONTENTS
1. PREFACE
- 1.1. Introduction
- 1.2. Key Market Insights
- 1.3. Project Objectives
- 1.4. Scope of the Report
- 1.5. Inclusions and Exclusions
- 1.6. Key Questions Answered
- 1.7. Chapter Outlines
2. RESEARCH METHODOLOGY
- 2.1. Chapter Overview
- 2.2. Research Assumptions
- 2.3. Project Methodology
- 2.4. Forecast Methodology
- 2.5. Robust Quality Control
- 2.7. Key Considerations
- 2.7.1. Demographics
- 2.7.2. Economic Factors
- 2.7.3. Government Regulations
- 2.7.4. Supply Chain
- 2.7.5. COVID Impact / Related Factors
- 2.7.6. Market Access
- 2.7.7. Healthcare Policies
- 2.7.8. Industry Consolidation
- 2.7.9. Key Market Segmentations
3. ECONOMIC AND OTHER PROJECT SPECIFIC CONSIDERATIONS
- 3.1. Chapter Overview
- 3.2. Market Dynamics
- 3.2.1. Time Period
- 3.2.1.1. Historical Trends
- 3.2.1.2. Current and Future Estimates
- 3.2.2. Currency Coverage
- 3.2.2.1. Overview of Major Currencies Affecting the Market
- 3.2.2.2. Impact of Currency Fluctuations on the Industry
- 3.2.3. Foreign Exchange Impact
- 3.2.3.1. Evaluation of Foreign Exchange Rates and Their Impact on Market
- 3.2.3.2. Strategies for Mitigating Foreign Exchange Risk
- 3.2.4. Recession
- 3.2.4.1. Historical Analysis of Past Recessions and Lessons Learnt
- 3.2.4.2. Assessment of Current Economic Conditions and Potential Impact on the Market
- 3.2.5. Inflation
- 3.2.5.1. Measurement and Analysis of Inflationary Pressures in the Economy
- 3.2.5.2. Potential Impact of Inflation on the Market Evolution
- 3.2.1. Time Period
4. EXECUTIVE SUMMARY
- 4.1. Chapter Overview
5. INTRODUCTION
- 5.1. Chapter Overview
- 5.2. Pharmaceutical Packaging and Filling
- 5.2.1. Need for Pharmaceutical Packaging
- 5.2.2. Types of Pharmaceutical Packaging
- 5.2.3. Limitations of Traditional Primary Packaging
- 5.2.4. Innovation in Pharmaceutical Packaging
- 5.3. Ready to Use Primary Packaging
- 5.3.1. Sterilization Techniques used in Primary Packaging
- 5.3.2. Advantages of Ready to Use Primary Packaging
- 5.3.3. Cost Saving Opportunities in Ready to Use Primary Packaging
- 5.3.4. Current Demand for Ready to Use Primary Packaging
- 5.4. Concluding Remarks
6. PRE-STERILIZED / READY TO USE CONTAINERS: MARKET LANDSCAPE
- 6.1. Chapter Overview
- 6.2. Pre-Sterilized / Ready to Use Containers: Overall Market Landscape
- 6.2.1. Analysis by Type of Container
- 6.2.2. Analysis by Material(s) of Fabrication
- 6.2.3. Analysis by Container Color
- 6.2.4. Analysis by Type of Compatible Drug(s)
- 6.2.5. Analysis by Scale of Operation
- 6.2.6. Analysis by Packaging Format(s)
- 6.2.7. Analysis by Sterilization Technique(s) Used
- 6.2.8. Analysis by Quality Certification(s) Obtained
- 6.2.9. Analysis by Target Market
- 6.2.10. Analysis by Availability of Additional Coating
- 6.2.11. Analysis by Availability of RTU Kits
- 6.3. Pre-Sterilized / Ready to Use Containers: Manufacturer Landscape
- 6.3.1. Analysis by Year of Establishment
- 6.3.2. Analysis by Company Size
- 6.3.3. Analysis by Location of Headquarters
- 6.3.4. Leading Manufacturers: Analysis by Number of Products
7. PRE-STERILIZED / READY TO USE CLOSURES: MARKET LANDSCAPE
- 7.1. Chapter Overview
- 7.2. Pre-Sterilized / Ready to Use Closures: Overall Market Landscape
- 7.2.1. Analysis by Type of Closure
- 7.2.2. Analysis by Material(s) of Fabrication
- 7.2.3. Analysis by Type of Compatible Container(s)
- 7.2.4. Analysis by Type of Compatible Drug(s)
- 7.2.5. Analysis by Sterilization Technique(s) Used
- 7.2.6. Analysis by Available Finish Format(s)
- 7.2.7. Analysis by Quality Certification(s) Obtained
- 7.2.8. Analysis by Target Market
- 7.2.9. Analysis by Availability of Additional Coating
- 7.3. Pre-Sterilized / Ready to Use Closures: Manufacturer Landscape
- 7.3.1. Analysis by Year of Establishment
- 7.3.2. Analysis by Company Size
- 7.3.3. Analysis by Location of Headquarters
- 7.3.4. Leading Manufacturers: Analysis by Number of Products
8. KEY INSIGHTS
- 8.1. Chapter Overview
- 8.2. Pre-Sterilized / Ready to Use Containers: Key Insights
- 8.2.1. Analysis by Type of Container and Scale of Operation
- 8.2.2. Analysis by Type of Container and Packaging Format(s)
- 8.2.3. Analysis by Type of Container and Material(s) of Fabrication
- 8.2.4. Analysis by Type of Container and Container Color
- 8.2.5. Analysis by Type of Container and Sterilization Technique(s) Used
- 8.2.6. Analysis by Type of Container and Type of Compatible Drug(s)
- 8.2.7. Analysis by Material(s) of Fabrication and Sterilization Technique(s) Used
- 8.3. Pre-Sterilized / Ready to Use Closures: Key Insights
- 8.3.1. Analysis by Type of Closure and Material(s) of Fabrication
- 8.3.2. Analysis by Type of Closure and Sterilization Technique(s) Used
- 8.3.3. Analysis by Type of Closure and Available Finish Format(s)
- 8.3.4. Analysis by Type of Closure and Type of Compatible Drug(s)
9. PRODUCT COMPETITIVENESS ANALYSIS: PRE-STERILIZED / READY TO USE CONTAINERS
- 9.1. Chapter Overview
- 9.2. Pre-Sterilized / Ready to Use Containers: Product Competitiveness Analysis
- 9.2.1. Assumptions and Key Parameters
- 9.2.2. Methodology
- 9.2.3. Product Competitiveness Analysis: Vials
- 9.2.4. Product Competitiveness Analysis: Syringes
- 9.2.5. Product Competitiveness Analysis: Bags
- 9.2.6. Product Competitiveness Analysis: Cartridges
10. PRODUCT COMPETITIVENESS ANALYSIS: PRE-STERILIZED / READY TO USE CLOSURES
- 10.1. Chapter Overview
- 10.2. Pre-Sterilized / Ready to Use Closures: Product Competitiveness Analysis
- 10.2.1. Assumptions and Key Parameters
- 10.2.2. Methodology
- 10.2.3. Product Competitiveness Analysis: Stoppers
- 10.2.4. Product Competitiveness Analysis: Plungers
- 10.2.5. Product Competitiveness Analysis: Caps
- 10.2.6. Product Competitiveness Analysis: Tip Caps / Needle Shields
- 10.2.7. Product Competitiveness Analysis: Seals
11. COMPANY PROFILES
- 11.1. Chapter Overview
- 11.2. APG Pharma Packaging
- 11.2.1. Company Overview
- 11.2.2. Product Portfolio
- 11.2.2.1. Ready to Use Closures
- 11.2.3. Recent Developments and Future Outlook
- 11.3. Aptar
- 11.3.1. Company Overview
- 11.3.2. Financial Information
- 11.3.3. Product Portfolio
- 11.3.3.1. Ready to Use Closures
- 11.3.4. Recent Developments and Future Outlook
- 11.4. Daikyo Seiko
- 11.4.1. Company Overview
- 11.4.2. Product Portfolio
- 11.4.2.1. Ready to Use Containers
- 11.4.2.2. Ready to Use Closures
- 11.4.3. Recent Developments and Future Outlook
- 11.5. Datwyler
- 11.5.1. Company Overview
- 11.5.2. Financial Information
- 11.5.3. Product Portfolio
- 11.5.3.1. Ready to Use Closures
- 11.5.4. Recent Developments and Future Outlook
- 11.6. DWK Life Sciences
- 11.6.1. Company Overview
- 11.6.2. Product Portfolio
- 11.6.2.1. Ready to Use Containers
- 11.6.2.2. Ready to Use Closures
- 11.6.3. Recent Developments and Future Outlook
- 11.7. Ningbo Zhengli Pharmaceutical Packaging
- 11.7.1. Company Overview
- 11.7.2. Product Portfolio
- 11.7.2.1. Ready to Use Containers
- 11.7.3. Recent Developments and Future Outlook
- 11.8. SCHOTT
- 11.8.1. Company Overview
- 11.8.2. Financial Information
- 11.8.3. Product Portfolio
- 11.8.3.1. Ready to Use Containers
- 11.8.3.2. Ready to Use Closures
- 11.8.4. Recent Developments and Future Outlook
- 11.9. Stevanato
- 11.9.1. Company Overview
- 11.9.2. Product Portfolio
- 11.9.2.1. Ready to Use Containers
- 11.9.2.2. Ready to Use Closures
- 11.9.3. Recent Developments and Future Outlook
- 11.10. West Pharmaceutical Services
- 11.10.1. Company Overview
- 11.10.2. Financial Information
- 11.10.3. Product Portfolio
- 11.10.3.1. Ready to Use Containers
- 11.10.3.2. Ready to Use Closures
- 11.10.4. Recent Developments and Future Outlook
12. PARTNERSHIPS AND COLLABORATIONS
- 12.1. Chapter Overview
- 12.2. Partnership Models
- 12.3. Pre-Sterilized / Ready to Use Pharmaceutical Packaging: Partnerships and Collaborations
- 12.3.1. Analysis by Year of Partnership
- 12.3.2. Analysis by Type of Partnership
- 12.3.3. Analysis by Year and Type of Partnership
- 12.3.4. Analysis by Type of Partner
- 12.3.5. Analysis by Year of Partnership and Type of Partner
- 12.3.6. Analysis by Type of Partnership and Type of Partner
- 12.3.7. Analysis by Purpose of Partnership
- 12.3.8. Analysis by Type of Packaging System
- 12.3.9. Analysis by Type of Packaging Material
- 12.3.10. Most Active Players: Analysis by Number of Partnerships
- 12.3.11. Analysis by Geography
- 12.3.11.1. Intercontinental and Intracontinental Deals
13. MARKET ENTRY DECISION MAKING FRAMEWORK
- 13.1. Chapter Overview
- 13.2. Key Assumptions and Methodology
- 13.3. Key Parameters Impacting Market Entry Decision Making
- 13.3.1. Product Reach
- 13.3.2. Product Differentiation
- 13.3.3. Market Activity
- 13.3.4. Product Competitiveness
- 13.3.5. Manufacturing Complexity
- 13.4. Concluding Remarks
14. DEMAND ANALYSIS
- 14.1. Chapter Overview
- 14.2. Scope and Methodology
- 14.3. Global Demand for Pre-Sterilized / Ready to Use Pharmaceutical Packaging: Distribution by Type of Container
- 14.3.1. Pre-Sterilized / Ready to Use Vials, Historical Trends (Since 2018) and Forecasted Estimates (Till 2035)
- 14.3.2. Pre-Sterilized / Ready to Use Syringes, Historical Trends (Since 2018) and Forecasted Estimates (Till 2035)
- 14.3.3. Pre-Sterilized / Ready to Use Cartridges, Historical Trends (Since 2018) and Forecasted Estimates (Till 2035)
- 14.4. Global Demand for Pre-Sterilized / Ready to Use Pharmaceutical Packaging: Distribution by Type of Closure
- 14.4.1. Pre-Sterilized / Ready to Use Caps, Historical Trends (Since 2018) and Forecasted Estimates (Till 2035)
- 14.4.2. Pre-Sterilized / Ready to Use Plungers, Historical Trends (Since 2018) and Forecasted Estimates (Till 2035)
- 14.4.3. Pre-Sterilized / Ready to Use Seals, Historical Trends (Since 2018) and Forecasted Estimates (Till 2035)
- 14.4.4. Pre-Sterilized / Ready to Use Stoppers, Historical Trends (Since 2018) and Forecasted Estimates (Till 2035)
- 14.4.5. Pre-Sterilized / Ready to Use Tip Caps / Needle Shields, Historical Trends (Since 2018) and Forecasted Estimates (Till 2035)
- 14.5. Global Demand for Pre-Sterilized / Ready to Use Pharmaceutical Packaging: Distribution by Material of Fabrication
- 14.5.1. Pre-Sterilized / Ready to Use Aluminum Containers and Closures, Historical Trends (Since 2018) and Forecasted Estimates (Till 2035)
- 14.5.2. Pre-Sterilized / Ready to Use Glass Containers and Closures, Historical Trends (Since 2018) and Forecasted Estimates (Till 2035)
- 14.5.3. Pre-Sterilized / Ready to Use Plastic Containers and Closures, Historical Trends (Since 2018) and Forecasted Estimates (Till 2035)
- 14.5.4. Pre-Sterilized / Ready to Use Rubber Containers and Closures, Historical Trends (Since 2018) and Forecasted Estimates (Till 2035)
- 14.6. Global Demand for Pre-Sterilized / Ready to Use Pharmaceutical Packaging: Distribution by Key Geographical Region
- 14.6.1. Pre-Sterilized / Ready to Use Pharmaceutical Packaging in North America, Historical Trends (Since 2018) and Forecasted Estimates (Till 2035)
- 14.6.2. Pre-Sterilized / Ready to Use Pharmaceutical Packaging in Europe, Historical Trends (Since 2018) and Forecasted Estimates (Till 2035)
- 14.6.3. Pre-Sterilized / Ready to Use Pharmaceutical Packaging in Asia, Historical Trends (Since 2018) and Forecasted Estimates (Till 2035)
- 14.6.4. Pre-Sterilized / Ready to Use Pharmaceutical Packaging in Latin America, Historical Trends (Since 2018) and Forecasted Estimates (Till 2035)
- 14.6.5. Pre-Sterilized / Ready to Use Pharmaceutical Packaging in Middle East and North Africa, Historical Trends (Since 2018) and Forecasted Estimates (Till 2035)
- 14.6.6. Pre-Sterilized / Ready to Use Pharmaceutical Packaging in Rest of the World, Historical Trends (Since 2018) and Forecasted Estimates (Till 2035)
15. MARKET IMPACT ANALYSIS: DRIVERS, RESTRAINTS, OPPORTUNITIES AND CHALLENGES
- 15.1. Chapter Overview
- 15.2. Market Drivers
- 15.3. Market Restraints
- 15.4. Market Opportunities
- 15.5. Market Challenges
- 15.6. Conclusion
16. GLOBAL PRE-STERILIZED / READY TO USE PHARMACEUTICAL PACKAGING MARKET
- 16.1. Chapter Overview
- 16.2. Assumptions and Methodology
- 16.3. Global Pre-Sterilized / Ready to Use Pharmaceutical Packaging Market, Historical Trends (Since 2018) and Forecasted Estimates (Till 2035)
- 16.3.1. Scenario Analysis
- 16.3.1.1. Conservative Scenario
- 16.3.1.2. Optimistic Scenario
- 16.3.1. Scenario Analysis
- 16.4. Key Market Segmentations
- 16.5. Dynamic Dashboard
17. PRE-STERILIZED / READY TO USE PHARMACEUTICAL PACKAGING MARKET, BY TYPE OF CONTAINER
- 17.1. Chapter Overview
- 17.2. Key Assumptions and Methodology
- 17.3. Pre-Sterilized / Ready to use Pharmaceutical Packaging Market: Distribution by Type of Container
- 17.3.1. Vials: Historical Trends (Since 2018) and Forecasted Estimates (Till 2035)
- 17.3.2. Syringes: Historical Trends (Since 2018) and Forecasted Estimates (Till 2035)
- 17.3.3. Cartridges: Historical Trends (Since 2018) and Forecasted Estimates (Till 2035)
- 17.4. Data Triangulation and Validation
18. PRE-STERILIZED / READY TO USE PHARMACEUTICAL PACKAGING MARKET, BY TYPE OF CLOSURE
- 18.1. Chapter Overview
- 18.2. Key Assumptions and Methodology
- 18.3. Pre-Sterilized / Ready to Use Pharmaceutical Packaging Market: Distribution by Type of Closure
- 18.3.1. Caps: Historical Trends (Since 2018) and Forecasted Estimates (Till 2035)
- 18.3.2. Plungers: Historical Trends (Since 2018) and Forecasted Estimates (Till 2035)
- 18.3.3. Seals: Historical Trends (Since 2018) and Forecasted Estimates (Till 2035)
- 18.3.4. Stoppers: Historical Trends (Since 2018) and Forecasted Estimates (Till 2035)
- 18.3.5. Tip Caps / Needle Shields: Historical Trends (Since 2018) and Forecasted Estimates (Till 2035)
- 18.4. Data Triangulation and Validation
19. PRE-STERILIZED / READY TO USE PHARMACEUTICAL PACKAGING MARKET, BY MATERIAL OF FABRICATION
- 19.1. Chapter Overview
- 19.2. Key Assumptions and Methodology
- 19.3. Aluminum Containers and Closures: Historical Trends (Since 2018) and Forecasted Estimates (Till 2035)
- 19.4. Glass Containers and Closures: Historical Trends (Since 2018) and Forecasted Estimates (Till 2035)
- 19.5. Plastic Containers and Closures: Historical Trends (Since 2018) and Forecasted Estimates (Till 2035)
- 19.6. Rubber Containers and Closures: Historical Trends (Since 2018) and Forecasted Estimates (Till 2035)
- 19.7. Data Triangulation and Validation
20. PRE-STERILIZED / READY TO USE PHARMACEUTICAL PACKAGING MARKET, BY KEY GEOGRAPHICAL REGION
- 20.1. Chapter Overview
- 20.2. Key Assumptions and Methodology
- 20.3. North America: Historical Trends (Since 2018) and Forecasted Estimates (Till 2035)
- 20.3.1. Pre-Sterilized / Ready to Use Pharmaceutical Packaging Market for Containers
- 20.3.2. Pre-Sterilized / Ready to Use Pharmaceutical Packaging Market for Closures
- 20.4. Europe: Historical Trends (Since 2018) and Forecasted Estimates (Till 2035)
- 20.4.1. Pre-Sterilized / Ready to Use Pharmaceutical Packaging Market for Containers
- 20.4.2. Pre-Sterilized / Ready to Use Pharmaceutical Packaging Market for Closures
- 20.5. Asia: Historical Trends (Since 2018) and Forecasted Estimates (Till 2035)
- 20.5.1. Pre-Sterilized / Ready to Use Pharmaceutical Packaging Market for Containers
- 20.5.2. Pre-Sterilized / Ready to Use Pharmaceutical Packaging Market for Closures
- 20.6. Latin America: Historical Trends (Since 2018) and Forecasted Estimates (Till 2035)
- 20.6.1. Pre-Sterilized / Ready to Use Pharmaceutical Packaging Market for Containers
- 20.6.2. Pre-Sterilized / Ready to Use Pharmaceutical Packaging Market for Closures
- 20.7. Middle East and North Africa: Historical Trends (Since 2018) and Forecasted Estimates (Till 2035)
- 20.7.1. Pre-Sterilized / Ready to Use Pharmaceutical Packaging Market for Containers
- 20.7.2. Pre-Sterilized / Ready to Use Pharmaceutical Packaging Market for Closures
- 20.8. Rest of the World: Historical Trends (Since 2018) and Forecasted Estimates (Till 2035)
- 20.8.1. Pre-Sterilized / Ready to Use Pharmaceutical Packaging Market for Containers
- 20.8.2. Pre-Sterilized / Ready to Use Pharmaceutical Packaging Market for Closures
- 20.9. Data Triangulation and Validation
21. EMERGING TRENDS IN PHARMACEUTICAL PACKAGING
- 21.1. Chapter Overview
- 21.2. Emerging Trends
- 21.2.1. Preference for Self-Medication of Drugs, Through the Use of Modern Drug Delivery Devices
- 21.2.2. Development of Improved Packaging Components and Efforts to Optimize Manufacturing Costs
- 21.2.3. Availability of Modular Facilities
- 21.2.4. Growing Demand and Preference for Personalized Therapies
- 21.2.5. Rise in Provisions for Automating Fill / Finish Operations
- 21.2.6. Surge in Partnership Activity
- 21.2.7. Increase in Initiatives Undertaken by Industry Stakeholders in Developing Regions
- 21.3. Concluding Remarks
22. CASE STUDY: ROBOTICS IN PHARMACEUTICAL PACKAGING
- 22.1. Chapter Overview
- 22.2. Role of Robotics in Pharmaceutical Industry
- 22.2.1. Key Considerations for Selecting a Robotic System
- 22.2.2. Advantages of Robotic Systems
- 22.2.3. Disadvantages of Robotic Systems
- 22.3. Companies Providing Robots for Use in Pharmaceutical Industry
- 22.4. Companies Providing Equipment Integrated Robotic Systems in Pharmaceutical Packaging
- 22.4.1. Aseptic Technologies
- 22.4.1.1. Crystal L1 Robot Line
- 22.4.1.2. Crystal SL1 Robot Line
- 22.4.2. AST
- 22.4.2.1. ASEPTiCELL
- 22.4.2.2. GENiSYS R
- 22.4.2.3. GENiSYS C
- 22.4.2.4. GENiSYS Lab
- 22.4.3. Bosch Packaging Technology
- 22.4.3.1. ATO
- 22.4.4. Dara Pharma
- 22.4.4.1. SYX-E Cartridge + RABS
- 22.4.5. Fedegari
- 22.4.5.1. Fedegari Isolator
- 22.4.6. IMA
- 22.4.6.1. INJECTA
- 22.4.6.2. STERI LIF3
- 22.4.7. Steriline
- 22.4.7.1. Robotic Nest Filling Machine (RNFM)
- 22.4.7.2. Robotic Vial Filling Machine (RVFM)
- 22.4.7.3. Robotic Vial Capping Machine (RVCM)
- 22.4.8. Vanrx Pharmasystems
- 22.4.8.1. Microcell Vial Filler
- 22.4.8.2. SA25 Aseptic Filling Workcell
- 22.4.1. Aseptic Technologies
- 22.5. Concluding Remarks
23. CONCLUSION
- 23.1. Chapter Overview
24. EXECUTIVE INSIGHTS
- 24.1. Chapter Overview
- 24.2. Company A
- 24.2.1. Company Snapshot
- 24.2.2. Interview Transcript: Business Development Specialist
- 24.3. Company B
- 24.3.1. Company Snapshot
- 24.3.2. Interview Transcript: Founder and Managing Director
- 24.4. Company C
- 24.4.1. Company Snapshot
- 24.4.2. Interview Transcript: Business Development and Technology Director
- 24.5. Company D
- 24.5.1. Company Snapshot
- 24.5.2. Interview Transcript: Former Facilitator
- 24.6. Company E
- 24.6.1. Company Snapshot
- 24.6.2. Interview Transcript: Former Project Manager of Business Development
25. APPENDIX 1: TABULATED DATA
26. APPENDIX 2: LIST OF COMPANIES AND ORGANIZATION
List of Tables
- Table 5.1 Compatibility of Polymers with Ethylene Oxide Sterilization
- Table 5.2 Advantages and Disadvantages of Different Sterilization Techniques
- Table 6.1 Pre-Sterilized / Ready to Use Containers: Information on Type of Container, Material(s) of Fabrication, Container Color and Type of Compatible Drug(s)
- Table 6.2 Pre-Sterilized / Ready to Use Containers: Information on Scale of Operation, Packaging Format(s) and Sterilization Technique(s) Used
- Table 6.3 Pre-Sterilized / Ready to Use Containers: Information on Quality Certification(s) Obtained and Target Market
- Table 6.4 Pre-Sterilized / Ready to Use Containers: Information on Availability of Additional Coating and RTU Kits
- Table 6.5 Pre-Sterilized / Ready to Use Containers: List of Manufacturers
- Table 7.1 Pre-Sterilized / Ready to Use Closures: Information on Type of Closure, Material(s) of Fabrication, Type of Compatible Container(s), Type of Compatible Drug(s) and Sterilization Technique(s) Used
- Table 7.2 Pre-Sterilized / Ready to Use Closures: Information on Available Finish Format(s), Quality Certification(s) Obtained and Target Market
- Table 7.3 Pre-Sterilized / Ready to Use Closures: Information on Availability of Additional Coating
- Table 7.4 Pre-Sterilized / Ready to Use Closures: List of Manufacturers
- Table 11.1 Leading Ready to Use Container and Closure Manufacturers
- Table 11.2 APG Pharma Packaging: Company Snapshot
- Table 11.3 APG Pharma Packaging: Ready to Use Closures
- Table 11.4 Aptar: Company Snapshot
- Table 11.5 Aptar: Ready to Use Closures
- Table 11.6 Aptar: Recent Developments and Future Outlook
- Table 11.7 Daikyo Seiko: Company Snapshot
- Table 11.8 Daikyo Seiko: Ready to Use Containers
- Table 11.9 Daikyo Seiko: Ready to Use Closures
- Table 11.10 Datwyler: Company Snapshot
- Table 11.11 Datwyler: Ready to Use Closures
- Table 11.12 Datwyler: Recent Developments and Future Outlook
- Table 11.13 DWK Life Sciences: Company Snapshot
- Table 11.14 DWK Life Sciences: Ready to Use Containers
- Table 11.15 DWK Life Sciences: Ready to Use Closures
- Table 11.16 DWK Life Sciences: Recent Developments and Future Outlook
- Table 11.17 Ningbo Zhengli Pharmaceutical Packaging: Company Snapshot
- Table 11.18 Ningbo Zhengli Pharmaceutical Packaging: Ready to Use Containers
- Table 11.19 Ningbo Zhengli Pharmaceutical Packaging: Recent Developments and Future Outlook
- Table 11.20 SCHOTT: Company Snapshot
- Table 11.21 SCHOTT: Ready to Use Containers
- Table 11.22 SCHOTT: Ready to Use Closures
- Table 11.23 SCHOTT: Recent Developments and Future Outlook
- Table 11.24 Stevanato: Company Snapshot
- Table 11.25 Stevanato: Ready to Use Containers
- Table 11.26 Stevanato: Ready to Use Closures
- Table 11.27 Stevanato: Recent Developments and Future Outlook
- Table 11.28 West Pharmaceutical Services: Company Snapshot
- Table 11.29 West Pharmaceutical Services: Ready to Use Containers
- Table 11.30 West Pharmaceutical Services: Ready to Use Closures
- Table 11.31 West Pharmaceutical Services: Recent Developments and Future Outlook
- Table 12.1 Pre-Sterilized / Ready to Use Containers and Closures: List of Partnerships and Collaborations, Since 2015
- Table 14.1 Global Demand for Pre-Sterilized / Ready to Use Pharmaceutical Packaging: Distribution by Type of Container
- Table 14.2 Global Demand for Pre-Sterilized / Ready to Use Pharmaceutical Packaging: Distribution by Type of Closure
- Table 14.3 Global Demand for Pre-Sterilized / Ready to Use Pharmaceutical Packaging: Distribution by Material of Fabrication
- Table 14.4 Global Demand for Pre-Sterilized / Ready to Use Pharmaceutical Packaging: Distribution by Key Geographical Regions
- Table 16.1 Tiered Pricing Structure for Pre-Sterilized / RTU Pharmaceutical Packaging across Different Geographies
- Table 22.1 List of Pharmaceutical Robotics Manufacturers
- Table 22.2 Aseptic Technologies: Company Overview
- Table 22.3 Aseptic Technologies: Key Specifications of Crystal L1 Robot Line
- Table 22.4 Aseptic Technologies: Key Specifications of Crystal SL1 Robot Line
- Table 22.5 AST: Company Overview
- Table 22.6 AST: Key Specifications of ASEPTiCell
- Table 22.7 AST: Key Specifications of GENiSYS R
- Table 22.8 AST: Key Specifications of GENiSYS C
- Table 22.9 AST: Key Specifications of GENiSYS Lab
- Table 22.10 Bosch Packaging Technology: Company Overview
- Table 22.11 Bosch Packaging Technology: Key Specifications of ATO
- Table 22.12 Dara Pharma: Company Overview
- Table 22.13 Dara Pharma: Key Specifications of SYX-E Cartridge + RABS
- Table 22.14 Fedegari: Company Overview
- Table 22.15 Fedegari: Key Specifications of Fedegari Isolator
- Table 22.16 IMA: Company Overview
- Table 22.17 IMA: Key Specifications of INJECTA
- Table 22.18 IMA: Key Specifications of STERI LIF3
- Table 22.19 Steriline: Company Overview
- Table 22.20 Steriline: Key Specifications of Robotic Nest Filling Machine
- Table 22.21 Steriline: Key Specifications of Robotic Vial Filling Machine
- Table 22.22 Steriline: Key Specifications of Robotic Vial Capping Machine)
- Table 22.23 Vanrx Pharmasystems: Company Overview
- Table 22.24 Vanrx Pharmasystems: Key Specifications of Microcell Vial Filler
- Table 22.25 Key Specifications of SA25 Aseptic Filling Workcell
- Table 24.1 Jinan Youlyy Industrial: Company Snapshot
- Table 24.2 Sagar Rubber: Company Snapshot
- Table 24.3 Aseptic Technologies: Company Snapshot
- Table 24.4 BioPhorum Operations: Company Snapshot
- Table 24.5 PYRAMID Laboratories: Company Snapshot
- Table 25.1 Pre-Sterilized / Ready to Use Containers: Distribution by Type of Container
- Table 25.2 Pre-Sterilized / Ready to Use Containers: Distribution by Material(s) of Fabrication
- Table 25.3 Pre-Sterilized / Ready to Use Containers: Distribution by Container Color
- Table 25.4 Pre-Sterilized / Ready to Use Containers: Distribution by Type of Compatible Drug(s)
- Table 25.5 Pre-Sterilized / Ready to Use Containers: Distribution by Scale of Operation
- Table 25.6 Pre-Sterilized / Ready to Use Containers: Distribution by Packaging Format(s)
- Table 25.7 Pre-Sterilized / Ready to Use Containers: Distribution by Sterilization Technique(s) Used
- Table 25.8 Pre-Sterilized / Ready to Use Containers: Distribution by Quality Certification(s) Obtained
- Table 25.9 Pre-Sterilized / Ready to Use Containers: Distribution by Target Market
- Table 25.10 Pre-Sterilized / Ready to Use Containers: Distribution by Availability of Additional Coating
- Table 25.11 Pre-Sterilized / Ready to Use Containers: Distribution by Availability of RTU Kits
- Table 25.12 Pre-Sterilized / Ready to Use Container Manufacturers: Distribution by Year of Establishment
- Table 25.13 Pre-Sterilized / Ready to Use Container Manufacturers: Distribution by Company Size
- Table 25.14 Pre-Sterilized / Ready to Use Container Manufacturers: Distribution by Location of Headquarters (Region-wise)
- Table 25.15 Pre-Sterilized / Ready to Use Container Manufacturers: Distribution by Location of Headquarters (Country-wise)
- Table 25.16 Leading Manufacturers: Distribution by Number of Products
- Table 25.17 Pre-Sterilized / Ready to Use Closures: Distribution by Type of Closure
- Table 25.18 Pre-Sterilized / Ready to Use Closures: Distribution by Material(s) of Fabrication
- Table 25.19 Pre-Sterilized / Ready to Use Closures: Distribution by Type of Compatible Container(s)
- Table 25.20 Pre-Sterilized / Ready to Use Closures: Distribution by Type of Compatible Drug(s)
- Table 25.21 Pre-Sterilized / Ready to Use Closures: Distribution by Sterilization Technique(s) Used
- Table 25.22 Pre-Sterilized / Ready to Use Closures: Distribution by Available Finish Format(s)
- Table 25.23 Pre-Sterilized / Ready to Use Closures: Distribution by Quality Certification(s) Obtained
- Table 25.24 Pre-Sterilized / Ready to Use Closures: Distribution by Target Market
- Table 25.25 Pre-Sterilized / Ready to Use Closures: Distribution by Availability of Additional Coating
- Table 25.26 Pre-Sterilized / Ready to Use Closure Manufacturers: Distribution by Year of Establishment
- Table 25.27 Pre-Sterilized / Ready to Use Closure Manufacturers: Distribution by Company Size
- Table 25.28 Pre-Sterilized / Ready to Use Closure Manufacturers: Distribution by Location of Headquarters (Region-wise)
- Table 25.29 Pre-Sterilized / Ready to Use Closure Manufacturers: Distribution by Location of Headquarters (Country-wise)
- Table 25.30 Leading Manufacturers: Distribution by Number of Products
- Table 25.31 Key Insights: Distribution by Type of Container and Scale of Operation
- Table 25.32 Key Insights: Distribution by Type of Container and Packaging Format(s)
- Table 25.33 Key Insights: Distribution by Type of Container and Material(s) of Fabrication
- Table 25.34 Key Insights: Distribution by Type of Container and Container Color
- Table 25.35 Key Insights: Distribution by Type of Container and Sterilization Technique(s) Used
- Table 25.36 Key Insights: Distribution by Type of Container and Type of Compatible Drug(s)
- Table 25.37 Key Insights: Distribution by Material(s) of Fabrication and Sterilization Technique(s) Used
- Table 25.38 Key Insights: Distribution by Type of Closure and Material(s) of Fabrication
- Table 25.39 Key Insights: Distribution by Type of Closure and Sterilization Technique(s) Used
- Table 25.40 Key Insights: Distribution by Type of Closure and Available Finish Format(s)
- Table 25.41 Key Insights: Distribution by Type of Closure and Type of Compatible Drug(s)
- Table 25.42 Aptar: Annual Revenues, Since 2016 (USD Billion)
- Table 25.43 Datwyler: Annual Revenues, Since 2016 (CHF Billion)
- Table 25.44 SCHOTT: Annual Revenues, Since 2019 (EUR Billion)
- Table 25.45 West Pharmaceutical Services: Annual Revenues, Since 2018 (USD Billion)
- Table 25.46 Partnerships and Collaborations: Cumulative Year-wise Trend, Since 2015
- Table 25.47 Partnerships and Collaborations: Distribution by Type of Partnership
- Table 25.48 Partnerships and Collaborations: Distribution by Year of Partnership and Type of Partnership
- Table 25.49 Partnerships and Collaborations: Distribution by Type of Partner
- Table 25.50 Partnerships and Collaborations: Distribution by Year of Partnership and Type of Partner, Since 2015
- Table 25.51 Partnerships and Collaborations: Distribution by Type of Partnership and Type of Partner
- Table 25.52 Partnerships and Collaborations: Distribution by Purpose(s) of Partnership
- Table 25.53 Partnerships and Collaborations: Distribution by Type of Packaging System
- Table 25.54 Partnerships and Collaborations: Distribution by Type of Packaging Material
- Table 25.55 Most Active Players: Distribution by Number of Partnerships
- Table 25.56 Partnerships and Collaborations: Local and International Agreements
- Table 25.57 Partnerships and Collaborations: Intercontinental and Intracontinental Agreements
- Table 25.58 Global Demand for Pre-Sterilized / Ready to Use Pharmaceutical Packaging, Till 2035: Distribution by Type of Container
- Table 25.59 Demand for Pre-Sterilized / Ready to Use Vials, Till 2035
- Table 25.60 Demand for Pre-Sterilized / Ready to Use Syringes, Till 2035
- Table 25.61 Demand for Pre-Sterilized / Ready to Use Cartridges, Till 2035
- Table 25.62 Demand for Pre-Sterilized / Ready to Use Pharmaceutical Packaging, Till 2035: Distribution by Type of Closure
- Table 25.63 Demand for Pre-Sterilized / Ready to Use Caps, Till 2035
- Table 25.64 Demand for Pre-Sterilized / Ready to Use Plungers, Till 2035
- Table 25.65 Demand for Pre-Sterilized / Ready to Use Seals, Till 2035
- Table 25.66 Demand for Pre-Sterilized / Ready to Use Stoppers, Till 2035
- Table 25.67 Demand for Pre-Sterilized / Ready to Use Tip Caps / Needle Shields, Till 2035
- Table 25.68 Global Demand for Pre-Sterilized / Ready to Use Pharmaceutical Packaging, Till 2035: Distribution by Material of Fabrication
- Table 25.69 Demand for Pre-Sterilized / Ready to Use Pharmaceutical Packaging for Aluminum Containers and Closures, Till 2035
- Table 25.70 Demand for Pre-Sterilized / Ready to Use Pharmaceutical Packaging for Glass Containers and Closures, Till 2035
- Table 25.71 Demand for Pre-Sterilized / Ready to Use Pharmaceutical Packaging for Plastic Containers and Closures, Till 2035
- Table 25.72 Demand for Pre-Sterilized / Ready to Use Pharmaceutical Packaging for Rubber Containers and Closures, Till 2035
- Table 25.73 Global Demand for Pre-Sterilized / Ready to Use Pharmaceutical Packaging, Till 2035: Distribution by Geography
- Table 25.74 Demand for Pre-Sterilized / Ready to Use Pharmaceutical Packaging in North America, Till 2035
- Table 25.75 Demand for Pre-Sterilized / Ready to Use Pharmaceutical Packaging in Europe, Till 2035
- Table 25.76 Demand for Pre-Sterilized / Ready to Use Pharmaceutical Packaging in Asia, Till 2035
- Table 25.77 Demand for Pre-Sterilized / Ready to Use Pharmaceutical Packaging in Latin America, Till 2035
- Table 25.78 Demand for Pre-Sterilized / Ready to Use Pharmaceutical Packaging in Middle East and North Africa, Till 2035
- Table 25.79 Demand for Pre-Sterilized / Ready to Use Pharmaceutical Packaging in Rest of the World, Till 2035
- Table 25.80 Global Pre-Sterilized / Ready to Use Pharmaceutical Packaging Market, Historical Trends (Since 2018) and Forecasted Estimates (Till 2035)
- Table 25.81 Global Pre-Sterilized / Ready to Use Pharmaceutical Packaging Market, Till 2035: Optimistic Scenario
- Table 25.82 Global Pre-Sterilized / Ready to Use Pharmaceutical Packaging Market, Till 2035: Conservative Scenario
- Table 25.83 Pre-Sterilized / Ready to Use Pharmaceutical Packaging Market for Vials: Historical Trends (Since 2018) and Forecasted Estimates (Till 2035)
- Table 25.84 Pre-Sterilized / Ready to Use Pharmaceutical Packaging Market for Syringes: Historical Trends (Since 2018) and Forecasted Estimates (Till 2035)
- Table 25.85 Pre-Sterilized / Ready to Use Pharmaceutical Packaging Market for Cartridges: Historical Trends (Since 2018) and Forecasted Estimates (Till 2035)
- Table 25.86 Pre-Sterilized / Ready to Use Pharmaceutical Packaging Market for Caps: Historical Trends (Since 2018) and Forecasted Estimates (Till 2035)
- Table 25.87 Pre-Sterilized / Ready to Use Pharmaceutical Packaging Market for Plungers: Historical Trends (Since 2018) and Forecasted Estimates (Till 2035)
- Table 25.88 Pre-Sterilized / Ready to Use Pharmaceutical Packaging Market for Seals: Historical Trends (Since 2018) and Forecasted Estimates (Till 2035)
- Table 25.89 Pre-Sterilized / Ready to Use Pharmaceutical Packaging Market for Stoppers: Historical Trends (Since 2018) and Forecasted Estimates (Till 2035)
- Table 25.90 Pre-Sterilized / Ready to Use Pharmaceutical Packaging Market for Tip Caps / Needle Shields: Historical Trends (Since 2018) and Forecasted Estimates (Till 2035)
- Table 25.91 Pre-Sterilized / Ready to Use Pharmaceutical Packaging Market for Aluminum Containers and Closures: Historical Trends (Since 2018) and Forecasted Estimates (Till 2035)
- Table 25.92 Pre-Sterilized / Ready to Use Pharmaceutical Packaging Market for Glass Containers and Closures: Historical Trends (Since 2018) and Forecasted Estimates (Till 2035)
- Table 25.93 Pre-Sterilized / Ready to Use Pharmaceutical Packaging Market for Plastic Containers and Closures: Historical Trends (Since 2018) and Forecasted Estimates (Till 2035)
- Table 25.94 Pre-Sterilized / Ready to Use Pharmaceutical Packaging Market for Rubber Containers and Closures: Historical Trends (Since 2018) and Forecasted Estimates (Till 2035)
- Table 25.95 Pre-Sterilized / Ready to Use Pharmaceutical Packaging Market in North America: Historical Trends (Since 2018) and Forecasted Estimates (Till 2035)
- Table 25.96 Pre-Sterilized / Ready to Use Pharmaceutical Packaging Market for Containers in North America: Historical Trends (Since 2018) and Forecasted Estimates (Till 2035)
- Table 25.97 Pre-Sterilized / Ready to Use Pharmaceutical Packaging Market for Closures in North America: Historical Trends (Since 2018) and Forecasted Estimates (Till 2035)
- Table 25.98 Pre-Sterilized / Ready to Use Pharmaceutical Packaging Market in Europe: Historical Trends (Since 2018) and Forecasted Estimates (Till 2035)
- Table 25.99 Pre-Sterilized / Ready to Use Pharmaceutical Packaging Market for Containers in Europe: Historical Trends (Since 2018) and Forecasted Estimates (Till 2035)
- Table 25.100 Pre-Sterilized / Ready to Use Pharmaceutical Packaging Market for Closures in Europe: Historical Trends (Since 2018) and Forecasted Estimates (Till 2035)
- Table 25.101 Pre-Sterilized / Ready to Use Pharmaceutical Packaging Market in Asia: Historical Trends (Since 2018) and Forecasted Estimates (Till 2035)
- Table 25.102 Pre-Sterilized / Ready to Use Pharmaceutical Packaging Market for Containers in Asia: Historical Trends (Since 2018) and Forecasted Estimates (Till 2035)
- Table 25.103 Pre-Sterilized / Ready to Use Pharmaceutical Packaging Market for Closures in Asia: Historical Trends (Since 2018) and Forecasted Estimates (Till 2035)
- Table 25.104 Pre-Sterilized / Ready to Use Pharmaceutical Packaging Market in Latin America: Historical Trends (Since 2018) and Forecasted Estimates (Till 2035)
- Table 25.105 Pre-Sterilized / Ready to Use Pharmaceutical Packaging Market for Containers in Latin America: Historical Trends (Since 2018) and Forecasted Estimates (Till 2035)
- Table 25.106 Pre-Sterilized / Ready to Use Pharmaceutical Packaging Market for Closures in Latin America: Historical Trends (Since 2018) and Forecasted Estimates (Till 2035)
- Table 25.107 Pre-Sterilized / Ready to Use Pharmaceutical Packaging Market in Middle East and North Africa: Historical Trends (Since 2018) and Forecasted Estimates (Till 2035)
- Table 25.108 Pre-Sterilized / Ready to Use Pharmaceutical Packaging Market for Containers in Middle East and North Africa: Historical Trends (Since 2018) and Forecasted Estimates (Till 2035)
- Table 25.109 Pre-Sterilized / Ready to Use Pharmaceutical Packaging Market for Closures in Middle East and North Africa: Historical Trends (Since 2018) and Forecasted Estimates (Till 2035)
- Table 25.110 Pre-Sterilized / Ready to Use Pharmaceutical Packaging Market in Rest of the World: Historical Trends (Since 2018) and Forecasted Estimates (Till 2035)
- Table 25.111 Pre-Sterilized / Ready to Use Pharmaceutical Packaging Market for Containers in Rest of the World: Historical Trends (Since 2018) and Forecasted Estimates (Till 2035)
- Table 25.112 Pre-Sterilized / Ready to Use Pharmaceutical Packaging Market for Closures in Rest of the World: Historical Trends (Since 2018) and Forecasted Estimates (Till 2035)
List of Figures
- Figure 2.1 Research Methodology: Research Methodology
- Figure 2.2 Research Methodology: Forecast Methodology
- Figure 2.3 Research Methodology: Robust Quality Control
- Figure 2.4 Research Methodology: Key Market Segmentation
- Figure 4.1 Executive Summary: Pre-Sterilized / Ready to Use Containers Market Landscape
- Figure 4.2 Executive Summary: Pre-Sterilized / Ready to Use Closures Market Landscape
- Figure 4.3 Executive Summary: Partnerships and Collaborations
- Figure 4.4 Executive Summary: Market Entry Decision Making Framework
- Figure 4.5 Executive Summary: Demand Analysis
- Figure 4.6 Executive Summary: Market Sizing and Opportunity Analysis
- Figure 5.1 Advantages of Pharmaceutical Packaging
- Figure 5.2 Type of Pharmaceutical Packaging
- Figure 5.3 Innovation in Pharmaceutical Packaging and Value Chain
- Figure 5.4 Ready to Use Enables Flexible, Flexible Aseptic Processing
- Figure 5.5 Advantages of Ready to Use Platform
- Figure 5.6 Drivers of Ready to Use Platform
- Figure 6.1 Pre-Sterilized / Ready to Use Containers: Distribution by Type of Container
- Figure 6.2 Pre-Sterilized / Ready to Use Containers: Distribution by Material(s) of Fabrication
- Figure 6.3 Pre-Sterilized / Ready to Use Containers: Distribution by Container Color
- Figure 6.4 Pre-Sterilized / Ready to Use Containers: Distribution by Type of Compatible Drug(s)
- Figure 6.5 Pre-Sterilized / Ready to Use Containers: Distribution by Scale of Operation
- Figure 6.6 Pre-Sterilized / Ready to Use Containers: Distribution by Packaging Format(s)
- Figure 6.7 Pre-Sterilized / Ready to Use Containers: Distribution by Sterilization Technique(s) Used
- Figure 6.8 Pre-Sterilized / Ready to Use Containers: Distribution by Quality Certification(s) Obtained
- Figure 6.9 Pre-Sterilized / Ready to Use Containers: Distribution by Target Market
- Figure 6.10 Pre-Sterilized / Ready to Use Containers: Distribution by Availability of Additional Coating
- Figure 6.11 Pre-Sterilized / Ready to Use Containers: Distribution by Availability of RTU Kits
- Figure 6.12 Pre-Sterilized / Ready to Use Container Manufacturers: Distribution by Year of Establishment
- Figure 6.13 Pre-Sterilized / Ready to Use Container Manufacturers: Distribution by Company Size
- Figure 6.14 Pre-Sterilized / Ready to Use Container Manufacturers: Distribution by Location of Headquarters (Region-wise)
- Figure 6.15 Pre-Sterilized / Ready to Use Container Manufacturers: Distribution by Location of Headquarters (Country-wise)
- Figure 6.16 Leading Manufacturers: Distribution by Number of Products
- Figure 7.1 Pre-Sterilized / Ready to Use Closures: Distribution by Type of Closure
- Figure 7.2 Pre-Sterilized / Ready to Use Closures: Distribution by Material(s) of Fabrication
- Figure 7.3 Pre-Sterilized / Ready to Use Closures: Distribution by Type of Compatible Container(s)
- Figure 7.4 Pre-Sterilized / Ready to Use Closures: Distribution by Type of Compatible Drug(s)
- Figure 7.5 Pre-Sterilized / Ready to Use Closures: Distribution by Sterilization Technique(s) Used
- Figure 7.6 Pre-Sterilized / Ready to Use Closures: Distribution by Available Finish Format(s)
- Figure 7.7 Pre-Sterilized / Ready to Use Closures: Distribution by Quality Certification(s) Obtained
- Figure 7.8 Pre-Sterilized / Ready to Use Closures: Distribution by Target Market
- Figure 7.9 Pre-Sterilized / Ready to Use Closures: Distribution by Availability of Additional Coating
- Figure 7.10 Pre-Sterilized / Ready to Use Closure Manufacturers: Distribution by Year of Establishment
- Figure 7.11 Pre-Sterilized / Ready to Use Closure Manufacturers: Distribution by Company Size
- Figure 7.12 Pre-Sterilized / Ready to Use Closure Manufacturers: Distribution by Location of Headquarters (Region-wise)
- Figure 7.13 Pre-Sterilized / Ready to Use Closure Manufacturers: Distribution by Location of Headquarters (Country-wise)
- Figure 7.14 Leading Manufacturers: Distribution by Number of Products
- Figure 8.1 Key Insights: Distribution by Type of Container and Scale of Operation
- Figure 8.2 Key Insights: Distribution by Type of Container and Packaging Format(s)
- Figure 8.3 Key Insights: Distribution by Type of Container and Material(s) of Fabrication
- Figure 8.4 Key Insights: Distribution by Type of Container and Container Color
- Figure 8.5 Key Insights: Distribution by Type of Container and Sterilization Technique(s) Used
- Figure 8.6 Key Insights: Distribution by Type of Container and Type of Compatible Drug(s)
- Figure 8.7 Key Insights: Distribution by Material(s) of Fabrication and Sterilization Technique(s) Used
- Figure 8.8 Key Insights: Distribution by Type of Closure and Material(s) of Fabrication
- Figure 8.9 Key Insights: Distribution by Type of Closure and Sterilization Technique(s) Used
- Figure 8.10 Key Insights: Distribution by Type of Closure and Available Finish Format(s)
- Figure 8.11 Key Insights: Distribution by Type of Closure and Type of Compatible Drug(s)
- Figure 9.1 Product Competitiveness Analysis: Vials
- Figure 9.2 Product Competitiveness Analysis: Syringes
- Figure 9.3 Product Competitiveness Analysis: Bags
- Figure 9.4 Product Competitiveness Analysis: Cartridges
- Figure 10.1 Product Competitiveness Analysis: Stoppers
- Figure 10.2 Product Competitiveness Analysis: Plungers
- Figure 10.3 Product Competitiveness Analysis: Caps
- Figure 10.4 Product Competitiveness Analysis: Tip Caps / Needle Shields
- Figure 10.5 Product Competitiveness Analysis: Seals
- Figure 11.1 Aptar: Annual Revenues, Since 2016 (USD Billion)
- Figure 11.2 Datwyler: Annual Revenues, Since 2016 (CHF Billion)
- Figure 11.3 SCHOTT: Annual Revenues, Since 2016 (EUR Billion)
- Figure 11.4 West Pharmaceutical Services: Annual Revenues, Since 2018 (USD Billion)
- Figure 12.1 Partnerships and Collaborations: Cumulative Year-wise Trend, Since 2015
- Figure 12.2 Partnerships and Collaborations: Distribution by Type of Partnership
- Figure 12.3 Partnerships and Collaborations: Distribution by Year and Type of Partnership
- Figure 12.4 Partnerships and Collaborations: Distribution by Type of Partner
- Figure 12.5 Partnerships and Collaborations: Distribution by Year of Partnership and Type of Partner, Since 2015
- Figure 12.6 Partnerships and Collaborations: Distribution by Type of Partnership and Type of Partner
- Figure 12.7 Partnerships and Collaborations: Distribution by Purpose of Partnership
- Figure 12.8 Partnerships and Collaborations: Distribution by Type of Packaging System
- Figure 12.9 Partnerships and Collaborations: Distribution by Type of Packaging Material
- Figure 12.10 Most Active Players: Distribution by Number of Partnerships
- Figure 12.11 Partnerships and Collaborations: Local and International Agreements
- Figure 12.12 Partnerships and Collaborations: Intercontinental and Intracontinental Agreements
- Figure 13.1 Spider Web Analysis: Product Reach
- Figure 13.2 Spider Web Analysis: Product Differentiation
- Figure 13.3 Spider Web Analysis: Market Activity
- Figure 13.4 Spider Web Analysis: Product Competitiveness
- Figure 13.5 Spider Web Analysis: Manufacturing Complexity
- Figure 13.6 Market Entry Decision Making Framework: Concluding Remarks
- Figure 14.1 Demand for Pre-Sterilized / Ready to Use Vials, Historical Trends (Since 2018) and Forecasted Estimates (Till 2035)
- Figure 14.2 Demand for Pre-Sterilized / Ready to Use Syringes, Historical Trends (Since 2018) and Forecasted Estimates (Till 2035)
- Figure 14.3 Demand for Pre-Sterilized / Ready to Use Cartridges, Historical Trends (Since 2018) and Forecasted Estimates (Till 2035)
- Figure 14.4 Demand for Pre-Sterilized / Ready to Use Caps, Historical Trends (Since 2018) and Forecasted Estimates (Till 2035)
- Figure 14.5 Demand for Pre-Sterilized / Ready to Use Plungers, Historical Trends (Since 2018) and Forecasted Estimates (Till 2035)
- Figure 14.6 Demand for Pre-Sterilized / Ready to Use Seals, Historical Trends (Since 2018) and Forecasted Estimates (Till 2035)
- Figure 14.7 Demand for Pre-Sterilized / Ready to Use Stoppers, Historical Trends (Since 2018) and Forecasted Estimates (Till 2035)
- Figure 14.8 Demand for Pre-Sterilized / Ready to Use Tip Caps / Needle Shields, Historical Trends (Since 2018) and Forecasted Estimates (Till 2035)
- Figure 14.9 Demand for Pre-Sterilized / Ready to Use Aluminum Containers and Closures, Historical Trends (Since 2018) and Forecasted Estimates (Till 2035)
- Figure 14.10 Demand for Pre-Sterilized / Ready to Use Glass Containers and Closures, Historical Trends (Since 2018) and Forecasted Estimates (Till 2035)
- Figure 14.11 Demand for Pre-Sterilized / Ready to Use Plastic Containers and Closures, Historical Trends (Since 2018) and Forecasted Estimates (Till 2035)
- Figure 14.12 Demand for Pre-Sterilized / Ready to Use Rubber Containers and Closures, Historical Trends (Since 2018) and Forecasted Estimates (Till 2035)
- Figure 14.13 Demand for Pre-Sterilized / Ready to Use Pharmaceutical Packaging in North America, Historical Trends (Since 2018) and Forecasted Estimates (Till 2035)
- Figure 14.14 Demand for Pre-Sterilized / Ready to Use Pharmaceutical Packaging in Europe, Historical Trends (Since 2018) and Forecasted Estimates (Till 2035)
- Figure 14.15 Demand for Pre-Sterilized / Ready to Use Pharmaceutical Packaging in Asia, Historical Trends (Since 2018) and Forecasted Estimates (Till 2035)
- Figure 14.16 Demand for Pre-Sterilized / Ready to Use Pharmaceutical Packaging in Latin America, Historical Trends (Since 2018) and Forecasted Estimates (Till 2035)
- Figure 14.17 Demand for Pre-Sterilized / Ready to Use Pharmaceutical Packaging in Middle East and North Africa, Historical Trends (Since 2018) and Forecasted Estimates (Till 2035)
- Figure 14.18 Demand for Pre-Sterilized / Ready to Use Pharmaceutical Packaging in Rest of the World, Historical Trends (Since 2018) and Forecasted Estimates (Till 2035)
- Figure 16.1 Percentage Distribution of Production and Processing Costs for Primary Packaging Components
- Figure 16.2 Global Pre-Sterilized / Ready to Use Pharmaceutical Packaging Market, Historical Trends (Since 2018) and Forecasted Estimates (Till 2035)
- Figure 16.3 Global Pre-Sterilized / Ready to Use Pharmaceutical Packaging Market: Conservative Scenario
- Figure 16.4 Global Pre-Sterilized / Ready to Use Pharmaceutical Packaging Market: Optimistic Scenario
- Figure 16.5 Dynamic Dashboard
- Figure 17.1 Pre-Sterilized / Ready to Use Pharmaceutical Packaging Market: Distribution by Type of Container (USD Billion)
- Figure 17.2 Pre-Sterilized / Ready to Use Pharmaceutical Packaging Market for Vials: Historical Trends (Since 2018) and Forecasted Estimates (Till 2035) (USD Billion)
- Figure 17.3 Pre-Sterilized / Ready to Use Pharmaceutical Packaging Market for Syringes: Historical Trends (Since 2018) and Forecasted Estimates (Till 2035) (USD Billion)
- Figure 17.4 Pre-Sterilized / Ready to Use Pharmaceutical Packaging Market for Cartridges: Historical Trends (Since 2018) and Forecasted Estimates (Till 2035) (USD Billion)
- Figure 18.1 Pre-Sterilized / Ready to Use Pharmaceutical Packaging Market: Distribution by Type of Closure (USD Billion)
- Figure 18.2 Pre-Sterilized / Ready to Use Pharmaceutical Packaging Market for Caps: Historical Trends (Since 2018) and Forecasted Estimates (Till 2035) (USD Billion)
- Figure 18.3 Pre-Sterilized / Ready to Use Pharmaceutical Packaging Market for Plungers: Historical Trends (Since 2018) and Forecasted Estimates (Till 2035) (USD Billion)
- Figure 18.4 Pre-Sterilized / Ready to Use Pharmaceutical Packaging Market for Seals: Historical Trends (Since 2018) and Forecasted Estimates (Till 2035) (USD Billion)
- Figure 18.5 Pre-Sterilized / Ready to Use Pharmaceutical Packaging Market for Stoppers: Historical Trends (Since 2018) and Forecasted Estimates (Till 2035) (USD Billion)
- Figure 18.6 Pre-Sterilized / Ready to Use Pharmaceutical Packaging Market for Tip Caps / Needle Shields: Historical Trends (Since 2018) and Forecasted Estimates (Till 2035) (USD Billion)
- Figure 19.1 Pre-Sterilized / Ready to Use Pharmaceutical Packaging Market for Aluminum Containers and Closures: Historical Trends (Since 2018) and Forecasted Estimates (Till 2035)
- Figure 19.2 Pre-Sterilized / Ready to Use Pharmaceutical Packaging Market for Glass Containers and Closures: Historical Trends (Since 2018) and Forecasted Estimates (Till 2035)
- Figure 19.3 Pre-Sterilized / Ready to Use Pharmaceutical Packaging Market for Plastic Containers and Closures: Historical Trends (Since 2018) and Forecasted Estimates (Till 2035)
- Figure 19.4 Pre-Sterilized / Ready to Use Pharmaceutical Packaging Market for Rubber Containers and Closures: Historical Trends (Since 2018) and Forecasted Estimates (Till 2035)
- Figure 20.1 Pre-Sterilized / Ready to Use Pharmaceutical Packaging Market in North America: Historical Trends (Since 2018) and Forecasted Estimates (Till 2035)
- Figure 20.2 Pre-Sterilized / Ready to Use Pharmaceutical Packaging Market for Containers in North America: Historical Trends (Since 2018) and Forecasted Estimates (Till 2035)
- Figure 20.3 Pre-Sterilized / Ready to Use Pharmaceutical Packaging Market for Closures in North America: Historical Trends (Since 2018) and Forecasted Estimates (Till 2035)
- Figure 20.4 Pre-Sterilized / Ready to Use Pharmaceutical Packaging Market in Europe: Historical Trends (Since 2018) and Forecasted Estimates (Till 2035)
- Figure 20.5 Pre-Sterilized / Ready to Use Pharmaceutical Packaging Market for Containers in Europe: Historical Trends (Since 2018) and Forecasted Estimates (Till 2035)
- Figure 20.6 Pre-Sterilized / Ready to Use Pharmaceutical Packaging Market for Closures in Europe: Historical Trends (Since 2018) and Forecasted Estimates (Till 2035)
- Figure 20.7 Pre-Sterilized / Ready to Use Pharmaceutical Packaging Market in Asia: Historical Trends (Since 2018) and Forecasted Estimates (Till 2035)
- Figure 20.8 Pre-Sterilized / Ready to Use Pharmaceutical Packaging Market for Containers in Asia: Historical Trends (Since 2018) and Forecasted Estimates (Till 2035)
- Figure 20.9 Pre-Sterilized / Ready to Use Pharmaceutical Packaging Market for Closures in Asia: Historical Trends (Since 2018) and Forecasted Estimates (Till 2035)
- Figure 20.10 Pre-Sterilized / Ready to Use Pharmaceutical Packaging Market in Latin America: Historical Trends (Since 2018) and Forecasted Estimates (Till 2035)
- Figure 20.11 Pre-Sterilized / Ready to Use Pharmaceutical Packaging Market for Containers in Latin America: Historical Trends (Since 2018) and Forecasted Estimates (Till 2035)
- Figure 20.12 Pre-Sterilized / Ready to Use Pharmaceutical Packaging Market for Closures in Latin America: Historical Trends (Since 2018) and Forecasted Estimates (Till 2035)
- Figure 20.13 Pre-Sterilized / Ready to Use Pharmaceutical Packaging Market in Middle East and North Africa: Historical Trends (Since 2018) and Forecasted Estimates (Till 2035)
- Figure 20.14 Pre-Sterilized / Ready to Use Pharmaceutical Packaging Market for Containers in Middle East and North Africa: Historical Trends (Since 2018) and Forecasted Estimates (Till 2035)
- Figure 20.15 Pre-Sterilized / Ready to Use Pharmaceutical Packaging Market for Closures in Middle East and North Africa: Historical Trends (Since 2018) and Forecasted Estimates (Till 2035)
- Figure 20.6 Pre-Sterilized / Ready to Use Pharmaceutical Packaging Market in Rest of the World: Historical Trends (Since 2018) and Forecasted Estimates (Till 2035)
- Figure 20.17 Pre-Sterilized / Ready to Use Pharmaceutical Packaging Market for Containers in Rest of the World: Historical Trends (Since 2018) and Forecasted Estimates (Till 2035)
- Figure 20.18 Pre-Sterilized / Ready to Use Pharmaceutical Packaging Market for Closures in Rest of the World: Historical Trends (Since 2018) and Forecasted Estimates (Till 2035)
- Figure 21.1 Emerging Trends in Pharmaceutical Packaging
- Figure 21.2 Future Growth Opportunities for Ready to Use Containers and Closures Based on Recent Trends
- Figure 22.1 Key Considerations for Selecting a Robotic System
- Figure 22.2 Pharmaceutical Manufacturing: Advantages of Robotic Systems
- Figure 22.3 Pharmaceutical Manufacturing: Disadvantages of Robotic Systems
- Figure 23.1 Concluding Remarks: Pre-Sterilized / Ready to Use Containers Market Landscape
- Figure 23.2 Concluding Remarks: Pre-Sterilized / Ready to Use Closures Market Landscape
- Figure 23.3 Concluding Remarks: Partnerships and Collaborations
- Figure 23.4 Concluding Remarks: Market Entry Decision Making Framework
- Figure 23.5 Concluding Remarks: Demand Analysis
- Figure 23.6 Concluding Remarks: Market Forecast
 抗體合約製造市場:產業趨勢及2035年全球預測 - 各製造抗體類型,各使用表現系統類型,各產業規模,各地區
 全球醫療CMO市場(2025年版)
 全球製藥契約製造市場(至 2030 年):按服務(藥物開發、製藥(原料藥、FDF - 腸外給藥、片劑、膠囊)、生技藥品(原料藥、FDF)、包裝和標籤、填充完成)和分子(小型、大型(ADC、CGT))
 量子運算的 ADC 和 DAC 市場規模、佔有率和趨勢分析報告:按類型、架構、量子位元類型、應用層、地區和細分市場預測,2025-2030 年
 契約製造市場按服務類型、產品、技術、用戶類型和最終用戶產業分類-2025-2030 年全球預測生物製藥契約製造市場(按服務類型、產品類型、生產階段、應用和組織規模)—2025-2030 年全球預測脂質CMO市場:產業趨勢及全球預測 - 依脂質類型、公司規模、業務規模和主要地區抗體受託製造的全球市場,規模,佔有率,趨勢,產業分析報告:各產品,來歷,各治療領域,各終端用戶,各地區 - 市場預測,2025年~2034年
 製藥和生物製藥合約製造市場-全球產業規模、佔有率、趨勢、機會和預測(按產品類型、服務、地區和競爭細分,2020-2030 年)
 契約製造:全球市場(~2030 年)