


 |
市場調查報告書
商品編碼
1752102
NFT市場 (~2035年):NFT類型·提供區分·平台·終端用戶·企業類型·各地區的分佈·產業趨勢·全球預測NFT Market, Till 2035: Distribution by Type of NFT, Type of Offerings, Type of Platforms, Type of End-User, Type of Enterprise and Geographical Regions: Industry Trends and Global Forecasts |
||||||
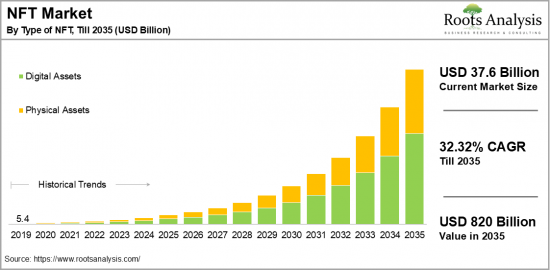
預計全球 NFT 市場規模將從目前的 376 億美元成長至 2035 年的 8,200 億美元,預測期內複合年增長率為 32.32%。
NFT的市場機會:各市場區隔
NFT類別
- 數位資產
- 物理資產
各提供種類
- 藝術
- 蒐集
- 遊戲資產
- 音樂NFT
- 不動產
- 其他
各平台
- 純 NFT 市場
- 網路零售業者
- 社群媒體平台
- 其他
各終端用戶
- 集電極
- 影響者/創作者
- 平台供應商
- NFT遊戲播放器
- 其他
類別企業
- 大企業
- 中小企業
各地區
- 北美
- 美國
- 加拿大
- 墨西哥
- 其他的北美各國
- 歐洲
- 奧地利
- 比利時
- 丹麥
- 法國
- 德國
- 愛爾蘭
- 義大利
- 荷蘭
- 挪威
- 俄羅斯
- 西班牙
- 瑞典
- 瑞士
- 英國
- 其他歐洲各國
- 亞洲
- 中國
- 印度
- 日本
- 新加坡
- 韓國
- 其他亞洲各國
- 南美
- 巴西
- 智利
- 哥倫比亞
- 委內瑞拉
- 其他的南美各國
- 中東·北非
- 埃及
- 伊朗
- 伊拉克
- 以色列
- 科威特
- 沙烏地阿拉伯
- 阿拉伯聯合大公國
- 其他的MENA各國
- 全球其他地區
- 澳洲
- 紐西蘭
- 其他的國家
NFT 市場:成長與趨勢
根據 "富比士" 報道,自 2017 年以來,NFT(非同質化代幣)的投資額已高達 1.74 億美元。在當今以科技為中心的生活中,一切都在不斷變化,個人收藏也不例外。現代社會正走向一個名為 NFT 的新平台。 NFT 可用於各種服務,包括藝術品、遊戲物品、音樂代幣和房地產。購買 NFT 時,會進行名為 "鑄造" 的程序,交易詳情會被記錄在區塊鏈上,讓買家感受到目標物品的權威性和所有權。
NFT 之所以越來越受歡迎,是因為其不可分割、所有權完整以及可追溯至過去所有者和來源等特性。此外,NFT 流動性極強,其日益增長的受歡迎程度也佐證了這一點。目前,NFT 的主要用戶是個人,但奢侈品牌、飲料製造商、媒體公司和創作者也對此保持關注。一個特別值得關注的案例是,2025 年 1 月,美國前第一夫人梅蘭妮亞·川普發布了一款名為 $MELANIA 的表情包幣,其市值隨即飆升至 22 億美元。
在快速發展的科技環境中,NFT 也對門票銷售和商品銷售產生了重大影響。 NFT 市場正在成為全球創新和數位轉型的關鍵要素。將人工智慧融入數位藝術,並輕鬆應用區塊鏈技術,對於充分發揮 NFT 的潛力至關重要,這不僅能增強 NFT 的認證和創作流程,還能提升其價值。尤其值得關注的優勢包括:實現資產的“民主化所有權”,並透過保證二級銷售的版稅收益來創造新的收入來源。在這些因素的支撐下,NFT 市場預計將在未來預測期內大幅成長。
本報告提供全球NFT的市場調查,彙整市場概要,背景,市場影響因素的分析,市場規模的轉變·預測,各種區分·各地區的詳細分析,競爭情形,主要企業簡介等資訊。
目錄
章節I:報告概要
第1章 序文
第2章 調查手法
第3章 市場動態
第4章 宏觀經濟指標
章節II:定性的洞察
第5章 摘要整理
第6章 簡介
第7章 法規Scenario
章節III:市場概要
第8章 主要企業的總括的資料庫
第9章 競爭情形
第10章 閒置頻段分析
第11章 企業的競爭力分析
第12章 NFT市場上Start-Ups生態系統
章節IV:企業簡介
第13章 企業簡介
- AppDupe
- Art Block
- Cloudflare
- Dapper lacs
- Dolphin Entertainment
- Gala Games
- Gemini Trust
- Onchain Labs
- OpenSea
- Ozone Networks
- PLBY Groups
- SuperRare
- Takung Art.
- The Sandbox
- YellowHeart
章節V:市場趨勢
第14章 大趨勢分析
第15章 未滿足需求分析
第16章 專利分析
第17章 最近的趨勢
章節VI:市場機會分析
第18章 全球NFT市場
第19章 NFT類別的市場機會
第20章 各提供種類的市場機會
第21章 各平台的市場機會
第22章 各終端用戶的市場機會
第23章 類別企業的市場機會
第24章 北美NFT的市場機會
第25章 歐洲的NFT的市場機會
第26章 亞洲的NFT的市場機會
第27章 中東·北非的NFT的市場機會
第28章 南美的NFT的市場機會
第29章 全球其他地區的NFT的市場機會
第30章 市場集中分析:各主要企業分佈
第31章 鄰近市場分析
章節VII:策略工具
第32章 變成勝利的關鍵的策略
第33章 波特的五力分析
第34章 SWOT分析
第35章 價值鏈分析
第36章 由於ROOTS的策略建議
章節VIII:其他的壟斷的洞察
第37章 來自1次調查的洞察
第38章 總論
章節IX:附錄
第39章 表格形式資料
第40章 企業·團體一覽
第41章 客制化的機會
第42章 ROOTS 訂閱服務
第43章 作者詳情
NFT Market Overview
As per Roots Analysis, the global NFT market size is estimated to grow from USD 37.6 billion in the current year to USD 820 billion by 2035, at a CAGR of 32.32% during the forecast period, till 2035.
The opportunity for NFT market has been distributed across the following segments:
Type of NFT
- Digital Assets
- Physical Assets
Type of Offering
- Arts
- Collectibles
- Gaming Assets
- Music NFTs
- Real Estate
- Others
Type of Platforms
- Dedicated NFT Marketplace
- Online Retailers
- Social Media Platforms
- Others
End-Users
- Collectors
- Influencers / Creators
- Platform Providers
- Players of NFT-Driven Games
- Others
Type of Enterprise
- Large
- Small and Medium Enterprise
Geographical Regions
- North America
- US
- Canada
- Mexico
- Other North American countries
- Europe
- Austria
- Belgium
- Denmark
- France
- Germany
- Ireland
- Italy
- Netherlands
- Norway
- Russia
- Spain
- Sweden
- Switzerland
- UK
- Other European countries
- Asia
- China
- India
- Japan
- Singapore
- South Korea
- Other Asian countries
- Latin America
- Brazil
- Chile
- Colombia
- Venezuela
- Other Latin American countries
- Middle East and North Africa
- Egypt
- Iran
- Iraq
- Israel
- Kuwait
- Saudi Arabia
- UAE
- Other MENA countries
- Rest of the World
- Australia
- New Zealand
- Other countries
NFT MARKET: GROWTH AND TRENDS
According to Forbes, an astonishing USD 174 million has been invested in NFTs since 2017. In today's tech-centric life, everything has become fluid, and personal collections are no exception; the modern world has gravitated toward a new platform known as non-fungible tokens (NFTs). These tokens cover a range of services, including art, gaming items, musical tokens, and real estate. During the acquisition process, NFT tokens undergo a procedure referred to as minting. Additionally, the transaction is recorded on a blockchain, providing the buyer with a sense of authority and ownership over the specific item purchased.
Their rising popularity stems from features such as indivisibility, offering complete ownership, and a traceable history that reveals previous owners and the original source of the non-fungible token. Moreover, they provide high liquidity, bolstered by their growing fame. While most active users are individuals, significant luxury brands, beverage companies, media outlets, and creators are also taking note. Notably, in January 2025, Melania Trump, the former First Lady of America, introduced the $MELANIA meme coin, which achieved a market cap of USD 2.2 billion shortly after its debut.
In the fast-evolving technological landscape, these tokens have made a substantial impact on ticketing and merchandise. The NFT marketplace is becoming an essential element in the global transition towards innovation and digital transformation, aiming for heightened AI technological efficiency. The integration of AI in digital art and the straightforward application of blockchain technology in NFTs has been crucial in realizing its full potential, enhancing both authentication and creation processes. Interestingly, one notable benefit of NFTs includes democratized ownership of assets and new revenue streams through guaranteed royalties on secondary sales. Driven by these factors, the NFT market is expected to witness a significant growth during the forecast period.
NFT MARKET: KEY SEGMENTS
Market Share by Type of NFT
Based on type of NFT, the global NFT market is segmented into digital assets and physical assets. According to our estimates, currently, digital assets segment captures the majority share of the market. This can be attributed to the strong interest in owning digital items among a substantial portion of the younger demographic worldwide. Further, the increasing popularity of digital platforms such as OpenSea and SuperRare is contributing to the growth of the digital non-fungible token industry.
However, the physical assets segment is anticipated to grow at a higher CAGR during the forecast period. This trend is driven by the rising interest in physical asset ownership, along with a notable demand for wall art and tangible merchandise globally.
Market Share by Type of Offering
Based on type of offering, the NFT market is segmented into arts, collectibles, gaming assets, music NFTs, real estate and others. According to our estimates, currently, collectibles segment captures the majority of the market and this trend is unlikely to change in future. However, the art segment is anticipated to grow at a higher CAGR during the forecast period, owing to the growing popularity of modern art, which is further enhancing investment opportunities in NFTs.
Market Share by Type of Platforms
Based on type of platforms, the NFT market is segmented into dedicated NFT marketplace, online retailers, social media platforms and others. According to our estimates, currently, dedicated NFT marketplace captures the majority share of the market. Additionally, this segment is anticipated to experience a higher compound annual growth rate (CAGR) during the forecast period. This growth can be attributed to its user-friendly tools for buying and selling items, innovative features, and specialized services tailored for NFTs.
Market Share by End-Users
Based on end-users, the NFT market is segmented into collectors, influencers / creators, platform providers, players of NFT-driven games and others. According to our estimates, currently, the collectors segment capture the majority share of the market and this trend is unlikely to change in future.
Market Share by Type of Enterprise
Based on type of enterprise, the NFT market is segmented into large and small and medium enterprise. According to our estimates, currently, large enterprises segment captures the majority share of the market. Companies like OpenSea and SuperRare are attracting more active users, particularly through their art-related initiatives. Furthermore, this trend is expected to continue in the near future, as large enterprises are more inclined to create new features that assist buyers and sellers on their platforms.
Market Share by Geographical Regions
Based on geographical regions, the NFT market is segmented into North America, Europe, Asia, Latin America, Middle East and North Africa, and the rest of the world. According to our estimates, currently, Asia captures the majority share of the market. However, the market in North America is anticipated to grow at a relatively higher CAGR during the forecast period.
Example Players in NFT Market
- AppDupe
- ArtBlock
- Cloudflare
- Dapper Labs
- Dolphin Entertainment
- Gala Games
- Gemini Trust
- OnChain Labs
- OpenSea
- PLBY Group
- SuperRare
- Takung Art
- The Sandbox
- YellowHeart
NFT MARKET: RESEARCH COVERAGE
The report on the NFT market features insights on various sections, including:
- Market Sizing and Opportunity Analysis: An in-depth analysis of the NFT market, focusing on key market segments, including [A] type of NFT, [B] type of offerings, [C] type of platforms, [D] type of end-user, [E] type of enterprise and [F] geographical regions.
- Competitive Landscape: A comprehensive analysis of the companies engaged in the NFT market, based on several relevant parameters, such as [A] year of establishment, [B] company size, [C] location of headquarters and [D] ownership structure.
- Company Profiles: Elaborate profiles of prominent players engaged in the NFT market, providing details on [A] location of headquarters, [B] company size, [C] company mission, [D] company footprint, [E] management team, [F] contact details, [G] financial information, [H] operating business segments, [I] service / product portfolio, [J] moat analysis, [K] recent developments, and an informed future outlook.
- Megatrends: An evaluation of ongoing megatrends in the NFT industry.
- Patent Analysis: An insightful analysis of patents filed / granted in the NFT domain, based on relevant parameters, including [A] type of patent, [B] patent publication year, [C] patent age and [D] leading players.
- Recent Developments: An overview of the recent developments made in the NFT market, along with analysis based on relevant parameters, including [A] year of initiative, [B] type of initiative, [C] geographical distribution and [D] most active players.
- Porter's Five Forces Analysis: An analysis of five competitive forces prevailing in the NFT market, including threats of new entrants, bargaining power of buyers, bargaining power of suppliers, threats of substitute products and rivalry among existing competitors.
- SWOT Analysis: An insightful SWOT framework, highlighting the strengths, weaknesses, opportunities and threats in the domain. Additionally, it provides Harvey ball analysis, highlighting the relative impact of each SWOT parameter.
KEY QUESTIONS ANSWERED IN THIS REPORT
- How many companies are currently engaged in NFT market?
- Which are the leading companies in this market?
- What factors are likely to influence the evolution of this market?
- What is the current and future market size?
- What is the CAGR of this market?
- How is the current and future market opportunity likely to be distributed across key market segments?
REASONS TO BUY THIS REPORT
- The report provides a comprehensive market analysis, offering detailed revenue projections of the overall market and its specific sub-segments. This information is valuable to both established market leaders and emerging entrants.
- Stakeholders can leverage the report to gain a deeper understanding of the competitive dynamics within the market. By analyzing the competitive landscape, businesses can make informed decisions to optimize their market positioning and develop effective go-to-market strategies.
- The report offers stakeholders a comprehensive overview of the market, including key drivers, barriers, opportunities, and challenges. This information empowers stakeholders to stay abreast of market trends and make data-driven decisions to capitalize on growth prospects.
ADDITIONAL BENEFITS
- Complimentary Excel Data Packs for all Analytical Modules in the Report
- 15% Free Content Customization
- Detailed Report Walkthrough Session with Research Team
- Free Updated report if the report is 6-12 months old or older
TABLE OF CONTENTS
SECTION I: REPORT OVERVIEW
1. PREFACE
- 1.1. Introduction
- 1.2. Market Share Insights
- 1.3. Key Market Insights
- 1.4. Report Coverage
- 1.5. Key Questions Answered
- 1.6. Chapter Outlines
2. RESEARCH METHODOLOGY
- 2.1. Chapter Overview
- 2.2. Research Assumptions
- 2.3. Database Building
- 2.3.1. Data Collection
- 2.3.2. Data Validation
- 2.3.3. Data Analysis
- 2.4. Project Methodology
- 2.4.1. Secondary Research
- 2.4.1.1. Annual Reports
- 2.4.1.2. Academic Research Papers
- 2.4.1.3. Company Websites
- 2.4.1.4. Investor Presentations
- 2.4.1.5. Regulatory Filings
- 2.4.1.6. White Papers
- 2.4.1.7. Industry Publications
- 2.4.1.8. Conferences and Seminars
- 2.4.1.9. Government Portals
- 2.4.1.10. Media and Press Releases
- 2.4.1.11. Newsletters
- 2.4.1.12. Industry Databases
- 2.4.1.13. Roots Proprietary Databases
- 2.4.1.14. Paid Databases and Sources
- 2.4.1.15. Social Media Portals
- 2.4.1.16. Other Secondary Sources
- 2.4.2. Primary Research
- 2.4.2.1. Introduction
- 2.4.2.2. Types
- 2.4.2.2.1. Qualitative
- 2.4.2.2.2. Quantitative
- 2.4.2.3. Advantages
- 2.4.2.4. Techniques
- 2.4.2.4.1. Interviews
- 2.4.2.4.2. Surveys
- 2.4.2.4.3. Focus Groups
- 2.4.2.4.4. Observational Research
- 2.4.2.4.5. Social Media Interactions
- 2.4.2.5. Stakeholders
- 2.4.2.5.1. Company Executives (CXOs)
- 2.4.2.5.2. Board of Directors
- 2.4.2.5.3. Company Presidents and Vice Presidents
- 2.4.2.5.4. Key Opinion Leaders
- 2.4.2.5.5. Research and Development Heads
- 2.4.2.5.6. Technical Experts
- 2.4.2.5.7. Subject Matter Experts
- 2.4.2.5.8. Scientists
- 2.4.2.5.9. Doctors and Other Healthcare Providers
- 2.4.2.6. Ethics and Integrity
- 2.4.2.6.1. Research Ethics
- 2.4.2.6.2. Data Integrity
- 2.4.3. Analytical Tools and Databases
- 2.4.1. Secondary Research
3. MARKET DYNAMICS
- 3.1. Forecast Methodology
- 3.1.1. Top-Down Approach
- 3.1.2. Bottom-Up Approach
- 3.1.3. Hybrid Approach
- 3.2. Market Assessment Framework
- 3.2.1. Total Addressable Market (TAM)
- 3.2.2. Serviceable Addressable Market (SAM)
- 3.2.3. Serviceable Obtainable Market (SOM)
- 3.2.4. Currently Acquired Market (CAM)
- 3.3. Forecasting Tools and Techniques
- 3.3.1. Qualitative Forecasting
- 3.3.2. Correlation
- 3.3.3. Regression
- 3.3.4. Time Series Analysis
- 3.3.5. Extrapolation
- 3.3.6. Convergence
- 3.3.7. Forecast Error Analysis
- 3.3.8. Data Visualization
- 3.3.9. Scenario Planning
- 3.3.10. Sensitivity Analysis
- 3.4. Key Considerations
- 3.4.1. Demographics
- 3.4.2. Market Access
- 3.4.3. Reimbursement Scenarios
- 3.4.4. Industry Consolidation
- 3.5. Robust Quality Control
- 3.6. Key Market Segmentations
- 3.7. Limitations
4. MACRO-ECONOMIC INDICATORS
- 4.1. Chapter Overview
- 4.2. Market Dynamics
- 4.2.1. Time Period
- 4.2.1.1. Historical Trends
- 4.2.1.2. Current and Forecasted Estimates
- 4.2.2. Currency Coverage
- 4.2.2.1. Overview of Major Currencies Affecting the Market
- 4.2.2.2. Impact of Currency Fluctuations on the Industry
- 4.2.3. Foreign Exchange Impact
- 4.2.3.1. Evaluation of Foreign Exchange Rates and Their Impact on Market
- 4.2.3.2. Strategies for Mitigating Foreign Exchange Risk
- 4.2.4. Recession
- 4.2.4.1. Historical Analysis of Past Recessions and Lessons Learnt
- 4.2.4.2. Assessment of Current Economic Conditions and Potential Impact on the Market
- 4.2.5. Inflation
- 4.2.5.1. Measurement and Analysis of Inflationary Pressures in the Economy
- 4.2.5.2. Potential Impact of Inflation on the Market Evolution
- 4.2.6. Interest Rates
- 4.2.6.1. Overview of Interest Rates and Their Impact on the Market
- 4.2.6.2. Strategies for Managing Interest Rate Risk
- 4.2.7. Commodity Flow Analysis
- 4.2.7.1. Type of Commodity
- 4.2.7.2. Origins and Destinations
- 4.2.7.3. Values and Weights
- 4.2.7.4. Modes of Transportation
- 4.2.8. Global Trade Dynamics
- 4.2.8.1. Import Scenario
- 4.2.8.2. Export Scenario
- 4.2.9. War Impact Analysis
- 4.2.9.1. Russian-Ukraine War
- 4.2.9.2. Israel-Hamas War
- 4.2.10. COVID Impact / Related Factors
- 4.2.10.1. Global Economic Impact
- 4.2.10.2. Industry-specific Impact
- 4.2.10.3. Government Response and Stimulus Measures
- 4.2.10.4. Future Outlook and Adaptation Strategies
- 4.2.11. Other Indicators
- 4.2.11.1. Fiscal Policy
- 4.2.11.2. art Spending
- 4.2.11.3. Gross Domestic Product (GDP)
- 4.2.11.4. Employment
- 4.2.11.5. Taxes
- 4.2.11.6. R&D Innovation
- 4.2.11.7. Stock Market Performance
- 4.2.11.8. Supply Chain
- 4.2.11.9. Cross-Border Dynamics
- 4.2.1. Time Period
SECTION II: QUALITATIVE INSIGHTS
5. EXECUTIVE SUMMARY
6. INTRODUCTION
- 6.1. Chapter Overview
- 6.2. Overview of NFT Market
- 6.2.1. Type of NFT
- 6.2.2. Type of Offering
- 6.2.3. Type of Platforms
- 6.2.4. Type of End-User
- 6.2.5. Type of Enterprise
- 6.3. Future Perspective
7. REGULATORY SCENARIO
SECTION III: MARKET OVERVIEW
8. COMPREHENSIVE DATABASE OF LEADING PLAYERS
9. COMPETITIVE LANDSCAPE
- 9.1. Chapter Overview
- 9.2. NFT: Overall Market Landscape
- 9.2.1. Analysis by Year of Establishment
- 9.2.2. Analysis by Company Size
- 9.2.3. Analysis by Location of Headquarters
- 9.2.4. Analysis by Ownership Structure
10. WHITE SPACE ANALYSIS
11. COMPANY COMPETITIVENESS ANALYSIS
12. STARTUP ECOSYSTEM IN THE NFT MARKET
- 12.1. NFT Market: Market Landscape of Startups
- 12.1.1. Analysis by Year of Establishment
- 12.1.2. Analysis by Company Size
- 12.1.3. Analysis by Company Size and Year of Establishment
- 12.1.4. Analysis by Location of Headquarters
- 12.1.5. Analysis by Company Size and Location of Headquarters
- 12.1.6. Analysis by Ownership Structure
- 12.2. Key Findings
SECTION IV: COMPANY PROFILES
13. COMPANY PROFILES
- 13.1. Chapter Overview
- 13.2. AppDupe*
- 13.2.1. Company Overview
- 13.2.2. Company Mission
- 13.2.3. Company Footprint
- 13.2.4. Management Team
- 13.2.5. Contact Details
- 13.2.6. Financial Performance
- 13.2.7. Operating Business Segments
- 13.2.8. Service / Product Portfolio (project specific)
- 13.2.9. MOAT Analysis
- 13.2.10. Recent Developments and Future Outlook
- 13.3. Art Block
- 13.4. Cloudflare
- 13.5. Dapper lacs
- 13.6. Dolphin Entertainment
- 13.7. Gala Games
- 13.8. Gemini Trust
- 13.9. Onchain Labs
- 13.10. OpenSea
- 13.11. Ozone Networks
- 13.12. PLBY Groups
- 13.13. SuperRare
- 13.14. Takung Art.
- 13.15. The Sandbox
- 13.16. YellowHeart
SECTION V: MARKET TRENDS
14. MEGA TRENDS ANALYSIS
15. UNMET NEED ANALYSIS
16. PATENT ANALYSIS
17. RECENT DEVELOPMENTS
- 17.1. Chapter Overview
- 17.2. Recent Funding
- 17.3. Recent Partnerships
- 17.4. Other Recent Initiatives
SECTION VI: MARKET OPPORTUNITY ANALYSIS
18. GLOBAL NFT MARKET
- 18.1. Chapter Overview
- 18.2. Key Assumptions and Methodology
- 18.3. Trends Disruption Impacting Market
- 18.4. Demand Side Trends
- 18.5. Supply Side Trends
- 18.6. Global NFT Market, Historical Trends (Since 2019) and Forecasted Estimates (Till 2035)
- 18.7. Multivariate Scenario Analysis
- 18.7.1. Conservative Scenario
- 18.7.2. Optimistic Scenario
- 18.8. Investment Feasibility Index
- 18.9. Key Market Segmentations
19. MARKET OPPORTUNITIES BASED ON TYPE OF NFT
- 19.1. Chapter Overview
- 19.2. Key Assumptions and Methodology
- 19.3. Revenue Shift Analysis
- 19.4. Market Movement Analysis
- 19.5. Penetration-Growth (P-G) Matrix
- 19.6. NFT Market for Physical Assets: Historical Trends (Since 2019) and Forecasted Estimates (Till 2035)
- 19.7. NFT Market for Digital Assets Historical Trends (Since 2019) and Forecasted Estimates (Till 2035)
- 19.8. Data Triangulation and Validation
- 19.8.1. Secondary Sources
- 19.8.2. Primary Sources
- 19.8.3. Statistical Modeling
20. MARKET OPPORTUNITIES BASED ON TYPE OF OFFERING
- 20.1. Chapter Overview
- 20.2. Key Assumptions and Methodology
- 20.3. Revenue Shift Analysis
- 20.4. Market Movement Analysis
- 20.5. Penetration-Growth (P-G) Matrix
- 20.6. NFT Market for Arts: Historical Trends (Since 2019) and Forecasted Estimates (Till 2035)
- 20.7. NFT Market for Collectibles: Historical Trends (Since 2019) and Forecasted Estimates (Till 2035)
- 20.8. NFT Market for Gaming assets: Historical Trends (Since 2019) and Forecasted Estimates (Till 2035)
- 20.9. NFT Market for Music NFTs: Historical Trends (Since 2019) and Forecasted Estimates (Till 2035)
- 20.10. NFT Market for Real Estate: Historical Trends (Since 2019) and Forecasted Estimates (Till 2035)
- 20.11. NFT Market for Others: Historical Trends (Since 2019) and Forecasted Estimates (Till 2035)
- 20.12. Data Triangulation and Validation
- 20.12.1. Secondary Sources
- 20.12.2. Primary Sources
- 20.12.3. Statistical Modeling
21. MARKET OPPORTUNITIES BASED ON TYPE OF PLATFORM
- 21.1. Chapter Overview
- 21.2. Key Assumptions and Methodology
- 21.3. Revenue Shift Analysis
- 21.4. Market Movement Analysis
- 21.5. Penetration-Growth (P-G) Matrix
- 21.6. NFT Market for Dedicated NFT Marketplace: Historical Trends (Since 2019) and Forecasted Estimates (Till 2035)
- 21.7. NFT Market for Online Retailers: Historical Trends (Since 2019) and Forecasted Estimates (Till 2035)
- 21.8. NFT Market for Social Media Platforms: Historical Trends (Since 2019) and Forecasted Estimates (Till 2035)
- 21.9. NFT Market for Others: Historical Trends (Since 2019) and Forecasted Estimates (Till 2035)
- 21.10. Data Triangulation and Validation
- 21.10.1. Secondary Sources
- 21.10.2. Primary Sources
- 21.10.3. Statistical Modeling
22. MARKET OPPORTUNITIES BASED ON TYPE OF END-USER
- 22.1. Chapter Overview
- 22.2. Key Assumptions and Methodology
- 22.3. Revenue Shift Analysis
- 22.4. Market Movement Analysis
- 22.5. Penetration-Growth (P-G) Matrix
- 22.6. NFT Market for Collectors: Historical Trends (Since 2019) and Forecasted Estimates (Till 2035)
- 22.7. NFT Market for Influencers/Creators: Historical Trends (Since 2019) and Forecasted Estimates (Till 2035)
- 22.8. NFT Market for Platform Providers: Historical Trends (Since 2019) and Forecasted Estimates (Till 2035)
- 22.9. NFT Market for Players of NFT Driven-Games: Historical Trends (Since 2019) and Forecasted Estimates (Till 2035)
- 22.10. NFT Market for Others: Historical Trends (Since 2019) and Forecasted Estimates (Till 2035)
- 22.11. Data Triangulation and Validation
- 22.11.1. Secondary Sources
- 22.11.2. Primary Sources
- 22.11.3. Statistical Modeling
23. MARKET OPPORTUNITIES BASED ON TYPE OF ENTERPRISE
- 23.1. Chapter Overview
- 23.2. Key Assumptions and Methodology
- 23.3. Revenue Shift Analysis
- 23.4. Market Movement Analysis
- 23.5. Penetration-Growth (P-G) Matrix
- 23.6. NFT Market for Large: Historical Trends (Since 2019) and Forecasted Estimates (Till 2035)
- 23.7. NFT Market for Small and Medium Enterprise: Historical Trends (Since 2019) and Forecasted Estimates (Till 2035)
- 23.8. Data Triangulation and Validation
- 23.8.1. Secondary Sources
- 23.8.2. Primary Sources
- 23.8.3. Statistical Modeling
24. MARKET OPPORTUNITIES NFT IN NORTH AMERICA
- 24.1. Chapter Overview
- 24.2. Key Assumptions and Methodology
- 24.3. Revenue Shift Analysis
- 24.4. Market Movement Analysis
- 24.5. Penetration-Growth (P-G) Matrix
- 24.6. NFT Market in North America: Historical Trends (Since 2019) and Forecasted Estimates (Till 2035)
- 24.6.1. NFT Market in the US: Historical Trends (Since 2019) and Forecasted Estimates (Till 2035)
- 24.6.2. NFT Market in Canada: Historical Trends (Since 2019) and Forecasted Estimates (Till 2035)
- 24.6.3. NFT Market in Mexico: Historical Trends (Since 2019) and Forecasted Estimates (Till 2035)
- 24.6.4. NFT Market in Other North American Countries: Historical Trends (Since 2019) and Forecasted Estimates (Till 2035)
- 24.7. Data Triangulation and Validation
25. MARKET OPPORTUNITIES FOR NFT IN EUROPE
- 25.1. Chapter Overview
- 25.2. Key Assumptions and Methodology
- 25.3. Revenue Shift Analysis
- 25.4. Market Movement Analysis
- 25.5. Penetration-Growth (P-G) Matrix
- 25.6. NFT Market in Europe: Historical Trends (Since 2019) and Forecasted Estimates (Till 2035)
- 25.6.1. NFT Market in Austria: Historical Trends (Since 2019) and Forecasted Estimates (Till 2035)
- 25.6.2. NFT Market in Belgium: Historical Trends (Since 2019) and Forecasted Estimates (Till 2035)
- 25.6.3. NFT Market in Denmark: Historical Trends (Since 2019) and Forecasted Estimates (Till 2035)
- 25.6.4. NFT Market in France: Historical Trends (Since 2019) and Forecasted Estimates (Till 2035)
- 25.6.5. NFT Market in Germany: Historical Trends (Since 2019) and Forecasted Estimates (Till 2035)
- 25.6.6. NFT Market in Ireland: Historical Trends (Since 2019) and Forecasted Estimates (Till 2035)
- 25.6.7. NFT Market in Italy: Historical Trends (Since 2019) and Forecasted Estimates (Till 2035)
- 25.6.8. NFT Market in the Netherlands: Historical Trends (Since 2019) and Forecasted Estimates (Till 2035)
- 25.6.9. NFT Market in Norway: Historical Trends (Since 2019) and Forecasted Estimates (Till 2035)
- 25.6.10. NFT Market in Russia: Historical Trends (Since 2019) and Forecasted Estimates (Till 2035)
- 25.6.11. NFT Market in Spain: Historical Trends (Since 2019) and Forecasted Estimates (Till 2035)
- 25.6.12. NFT Market in Sweden: Historical Trends (Since 2019) and Forecasted Estimates (Till 2035)
- 25.6.13. NFT Market in Sweden: Historical Trends (Since 2019) and Forecasted Estimates (Till 2035)
- 25.6.14. NFT Market in Switzerland: Historical Trends (Since 2019) and Forecasted Estimates (Till 2035)
- 25.6.15. NFT Market in the UK: Historical Trends (Since 2019) and Forecasted Estimates (Till 2035)
- 25.6.16. NFT Market in Other European Countries: Historical Trends (Since 2019) and Forecasted Estimates (Till 2035)
- 25.7. Data Triangulation and Validation
26. MARKET OPPORTUNITIES FOR NFT IN ASIA
- 26.1. Chapter Overview
- 26.2. Key Assumptions and Methodology
- 26.3. Revenue Shift Analysis
- 26.4. Market Movement Analysis
- 26.5. Penetration-Growth (P-G) Matrix
- 26.6. NFT Market in Asia: Historical Trends (Since 2019) and Forecasted Estimates (Till 2035)
- 26.6.1. NFT Market in China: Historical Trends (Since 2019) and Forecasted Estimates (Till 2035)
- 26.6.2. NFT Market in India: Historical Trends (Since 2019) and Forecasted Estimates (Till 2035)
- 26.6.3. NFT Market in Japan: Historical Trends (Since 2019) and Forecasted Estimates (Till 2035)
- 26.6.4. NFT Market in Singapore: Historical Trends (Since 2019) and Forecasted Estimates (Till 2035)
- 26.6.5. NFT Market in South Korea: Historical Trends (Since 2019) and Forecasted Estimates (Till 2035)
- 26.6.6. NFT Market in Other Asian Countries: Historical Trends (Since 2019) and Forecasted Estimates (Till 2035)
- 26.7. Data Triangulation and Validation
27. MARKET OPPORTUNITIES FOR NFT IN MIDDLE EAST AND NORTH AFRICA (MENA)
- 27.1. Chapter Overview
- 27.2. Key Assumptions and Methodology
- 27.3. Revenue Shift Analysis
- 27.4. Market Movement Analysis
- 27.5. Penetration-Growth (P-G) Matrix
- 27.6. NFT Market in Middle East and North Africa (MENA): Historical Trends (Since 2019) and Forecasted Estimates (Till 2035)
- 27.6.1. NFT Market in Egypt: Historical Trends (Since 2019) and Forecasted Estimates (Till 205)
- 27.6.2. NFT Market in Iran: Historical Trends (Since 2019) and Forecasted Estimates (Till 2035)
- 27.6.3. NFT Market in Iraq: Historical Trends (Since 2019) and Forecasted Estimates (Till 2035)
- 27.6.4. NFT Market in Israel: Historical Trends (Since 2019) and Forecasted Estimates (Till 2035)
- 27.6.5. NFT Market in Kuwait: Historical Trends (Since 2019) and Forecasted Estimates (Till 2035)
- 27.6.6. NFT Market in Saudi Arabia: Historical Trends (Since 2019) and Forecasted Estimates (Till 2035)
- 27.6.7. NFT Market in United Arab Emirates (UAE): Historical Trends (Since 2019) and Forecasted Estimates (Till 2035)
- 27.6.8. NFT Market in Other MENA Countries: Historical Trends (Since 2019) and Forecasted Estimates (Till 2035)
- 27.7. Data Triangulation and Validation
28. MARKET OPPORTUNITIES FOR NFT IN LATIN AMERICA
- 28.1. Chapter Overview
- 28.2. Key Assumptions and Methodology
- 28.3. Revenue Shift Analysis
- 28.4. Market Movement Analysis
- 28.5. Penetration-Growth (P-G) Matrix
- 28.6. NFT Market in Latin America: Historical Trends (Since 2019) and Forecasted Estimates (Till 2035)
- 28.6.1. NFT Market in Argentina: Historical Trends (Since 2019) and Forecasted Estimates (Till 2035)
- 28.6.2. NFT Market in Brazil: Historical Trends (Since 2019) and Forecasted Estimates (Till 2035)
- 28.6.3. NFT Market in Chile: Historical Trends (Since 2019) and Forecasted Estimates (Till 2035)
- 28.6.4. NFT Market in Colombia Historical Trends (Since 2019) and Forecasted Estimates (Till 2035)
- 28.6.5. NFT Market in Venezuela: Historical Trends (Since 2019) and Forecasted Estimates (Till 2035)
- 28.6.6. NFT Market in Other Latin American Countries: Historical Trends (Since 2019) and Forecasted Estimates (Till 2035)
- 28.7. Data Triangulation and Validation
29. MARKET OPPORTUNITIES FOR NFT IN REST OF THE WORLD
- 29.1. Chapter Overview
- 29.2. Key Assumptions and Methodology
- 29.3. Revenue Shift Analysis
- 29.4. Market Movement Analysis
- 29.5. Penetration-Growth (P-G) Matrix
- 29.6. NFT Market in Rest of the World: Historical Trends (Since 2019) and Forecasted Estimates (Till 2035)
- 29.6.1. NFT Market in Australia: Historical Trends (Since 2019) and Forecasted Estimates (Till 2035)
- 29.6.2. NFT Market in New Zealand: Historical Trends (Since 2019) and Forecasted Estimates (Till 2035)
- 29.6.3. NFT Market in Other Countries
- 29.7. Data Triangulation and Validation
30. MARKET CONCENTRATION ANALYSIS: DISTRIBUTION BY LEADING PLAYERS
- 30.1. Leading Player 1
- 30.2. Leading Player 2
- 30.3. Leading Player 3
- 30.4. Leading Player 4
- 30.5. Leading Player 5
- 30.6. Leading Player 6
- 30.7. Leading Player 7
- 30.8. Leading Player 8
31. ADJACENT MARKET ANALYSIS
SECTION VII: STRATEGIC TOOLS
32. KEY WINNING STRATEGIES
33. PORTER'S FIVE FORCES ANALYSIS
34. SWOT ANALYSIS
35. VALUE CHAIN ANALYSIS
36. ROOTS STRATEGIC RECOMMENDATIONS
- 36.1. Chapter Overview
- 36.2. Key Business-related Strategies
- 36.2.1. Research & Development
- 36.2.2. Product Manufacturing
- 36.2.3. Commercialization / Go-to-Market
- 36.2.4. Sales and Marketing
- 36.3. Key Operations-related Strategies
- 36.3.1. Risk Management
- 36.3.2. Workforce
- 36.3.3. Finance
- 36.3.4. Others
SECTION VIII: OTHER EXCLUSIVE INSIGHTS
37. INSIGHTS FROM PRIMARY RESEARCH
38. REPORT CONCLUSION
SECTION IX: APPENDIX
39. TABULATED DATA
40. LIST OF COMPANIES AND ORGANIZATIONS
41. CUSTOMIZATION OPPORTUNITIES
42. ROOTS SUBSCRIPTION SERVICES
43. AUTHOR DETAILS
 2026-2030年全球非同質化代幣(NFT)市場
 NFT市場分析及至2035年預測:按類型、產品、服務、技術、組件、應用、最終用戶、部署類型和解決方案分類非同質化代幣(NFT) 市場分析及至 2035 年預測:按類型、產品類型、服務、技術、組件、應用、最終用戶和部署類型分類
 全球非同質化代幣(NFT) 市場預測至 2034 年:按類型、區塊鏈平台、市場類型、應用、最終用戶和地區分類
 加密貨幣和NFT獎勵型遊戲-全球市佔率和排名、總收入和需求預測(2025-2031)NFT 教育證書市場預測至 2032 年:按證書類型、發行人類型、技術、應用、最終用戶和地區進行的全球分析NFT 運動員參與市場預測(至 2032 年):按類型、運動、平台、應用和地區進行的全球分析
 2025年全球非同質化代幣市場報告
 2025-2029年全球音樂NFT市場
 全球遊戲 NFT 市場