


|
市場調查報告書
商品編碼
1398379
網路營運商預測(~2028 年):資本支出將在 2023 年下降後恢復,並在 2028 年增長至約 6500 億美元,生成式人工智慧推動資本支出和員工人數減少Network Operator Forecast Through 2028: After 2023 Dip, Capex Will Bounce Back, Growing to Reach ~$650B by 2028, GenAI Will Drive Both Capex and Job Cuts |
|||||||
預計到2024年,三類網路營運商的收入將達到4.38兆美元(2022年為4.11兆美元)。 此外,資本投資預計為5,520億美元(2022年為5,630億美元),員工人數預計為871萬人(2022年為888萬人)。
本報告分析了全球網路營運商市場(電信公司、網路擴展商、營運商中立網路營運商(CNNO) 等)的業務績效前景和資本投資趨勢,並提供了超過175 家公司的最新信息。除了按季度調查和估計業績趨勢(2011年至2022年的收入、資本投資額、員工人數等)和未來前景(截至2028年)外,我們還檢查按部門劃分的詳細趨勢和過去的預測結果。我們將為您提供比較等資訊。
總體基於數量的分析結果
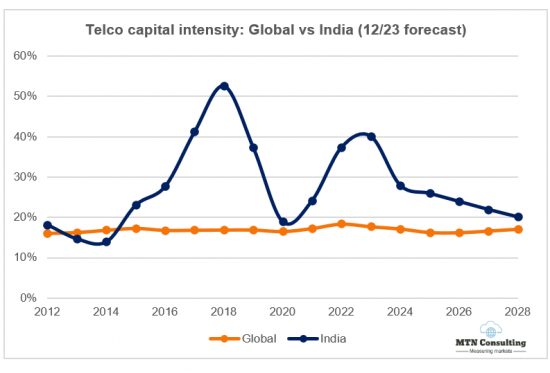
電信、網路規模和營運商中立三個細分市場的總收入將在 2022 年增長至 41,090 億美元,到 2028 年將增長至 53,440 億美元。 2022年,這三個部門的資本支出為5,630億美元,2023年和2024年均減少至約5,500億美元,2028年增加至6,620億美元。 網路規模的資本支出最近已趨於平穩,但從長遠來看,該領域佔網路營運商成長的大部分。 2011年,網路規模佔資本支出的比例不到10%;到2022年將超過36%,到2028年將超過43%。 預計 CNNO 到 2028 年將佔資本支出的 7%,較目前略有增加,而電信公司預計到 2028 年將佔網路營運商資本支出的略低於 50%。 就資本密集度而言,2022年所有業者的平均為13.7%,但2028年僅為12.4%。 電信公司是這項運動的關鍵推動者。 電信公司的年化資本密集度在 2023 年第一季達到 18.7% 的峰值,隨著大多數 5G 網路的建成,資本密集度開始迅速下降。 資本密集度預計將於 2027 年開始回升,並於 2028 年達到 17.1%。 到了 2022 年,網路擴展器的資本密集度也創下 9.1% 的歷史新高,但這一趨勢現在正在放緩。 然而,隨著營運商填滿現有資料中心,網路擴展器用於網路的資本支出比例正在增加。 與往常一樣,營運商中立的資本密集度最高,在預測期內遠高於 30%。
過去十年,三大業者部門的員工數量大幅增加,從 2011 年的 648 萬人增加到 2022 年的 888 萬人。 這與 2021 年的數字大致相同。 電信公司在 2022 年加速裁員,多家網路擴容商也宣布裁員。 2023年員工總數為876萬人,較前一年略有減少,但這主要是由於電信公司持續裁員所致。 展望未來,預計電信公司的削減速度將加快,部分原因是產生人工智慧的貢獻。 到 2025 年,網路擴展器將出現一些成長,但此後將開始穩定下降。 特別是對於像Amazon和JD.com這樣以電子商務為導向的網路擴展商來說,多年來在機器人和人工智慧方面的大規模研發投資將開始取得成果,從而降低勞動力成本。 CNNO 預計將僱用超過 10 萬名員工。 按細分市場劃分,CNNO 的每位員工銷售額迄今為止最高,約為 876,000 美元,而網路規模的銷售額為 562,000 美元,電信公司的銷售額為 391,000 美元,到 2023 年。 隨著 2026 年勞動力開始下降,該指標的成長將達到網路規模最高。 電信公司的員工人均收入成長最慢,儘管對裁員的假設相當激進。 另一種情況是電信公司高層主動部署生成式人工智慧,以支援短期裁員,尤其是銷售和行銷部門。 英國電信 (BT) 是發現這種情況的電信公司之一。 然而,大多數電信公司可能對在網路營運等敏感領域立即部署生成式人工智慧持謹慎態度。
主要分析結果:依網路營運商類型劃分
此預測提供了三種網路營運商類型中每種類型的詳細分類。 以下是按細分市場劃分的主要調查結果摘要:
電信:正如我們一直所說,電信本質上是一個零成長產業。 由於市場份額的變化、成長週期時間的差異以及併購,某些國家和公司會不時實現成長。 然而,自2011年以來,全球電信公司收入一直維持在窄幅區間(1.7兆美元至1.9兆美元),而這種情況可能會持續到2028年。 預計2022年營收為1.78兆美元,2023年小幅下降,然後年平均成長1.4%,2028年達到1.93兆美元。 由於技術更新周期(例如 5G)和政府行動(例如新頻譜產品和本地光纖補貼),資本支出不斷變化。 2022年資本投資總額將為3,280億美元,佔營收的18.1%。 這是我們時間範圍內(2011 年至今)有史以來最高的年度資本密集度。 然而,預計到 2025 年,資本投資將略有下降,然後在 2028 年再次小幅上升,達到 3,310 億美元(資本密集度為 17.1%)。 2022年美國資本投資激增,但2023年和2024年將大幅下降。 軟體資本支出的成長可能會慢於預期,並且在預測期內仍低於總資本支出的 20%。 電信業從業人員數量下降速度快於預期,預計將從2022年的略低於460萬降至2028年的不到420萬。 隨著電信公司培養更多以 IT/軟體為中心的勞動力隊伍,人均勞動成本預計將在 2023 年恢復成長。
網路擴展器:在過去的十年中,網路規模的成長推動了整個網路營運商市場。 在新冠疫情期間,網路擴展商的各項指標都出現了激增,包括收入、資本支出和就業。 對資料中心晶片及相關設備的需求也激增。 但該產業去年成長放緩,並且正在削減成本、資本支出和員工人數。 2023年營收約2.32兆美元,連續第二年年比僅成長4%。 到 2028 年,複合年增長率預計將在 7% 左右。 到 2022 年,網路規模資本支出將達到 2,030 億美元,較 2021 年實現健康成長。 然而,預計到 2024 年底,資本支出將保持停滯狀態,經過幾年的產能吸收,並將於 2025 年再次開始增加。 在淡季期間,大部分資本支出將用於網路/IT/軟體。 網路擴展器的研發支出仍將保持在高位,但將從 2022 年的創紀錄水準(佔營收的 12.0%)下降到 2028 年的略高於 10%。 隨著網路擴展商的收入成長變得更加困難,我們相信他們將變得更加重視成本和短期導向。
營運商中立:營運商中立產業規模仍然較小,2022 年營收為 950 億美元,但到 2028 年將成長至約 1,240 億美元。 網路擴展商和電信公司將越來越依賴 CNNO 來擴展其資料中心、塔和光纖足跡。 電信公司正在將部分基礎設施轉移給第三方,包括傳統的CNNO(例如TASC Towers,它從Zain 和Ooredoo 收購了30,000 座塔)以及合資企業,例如AT&T 和Blackrock 之間的合作夥伴Gigapower。我認為它會繼續走出去。 CNNO 2022 年的總資本投資將為 330 億美元,2028 年將增至約 450 億美元。 到2028 年,CNNO 部門將擁有約380 萬個蜂窩塔(2022 年:330 萬個)、1,718 個資料中心(2022 年:1,223 個)和113 萬英裡的光纖線路(2022 年:945,000 英裡)處於控制之下。
目標範圍
目標公司
|
|
目錄
本報告的主要部分:
- 1. 概述
- 2. 網路營運商總數
- 3.電信公司
- 4.電信公司 - 區域細分
- 5.網路規模
- 6.操作員中立 (CNNO)
- 7. 主要業者的支出前景
- 8.概述
本報告中的主要分析結果標籤- “網路營運商總數”、“電信公司”、“電信公司- 區域細分”、“網路規模” 、 "運營商" 中性(CNNO)" - 包含許多分析結果。
"網路營運商總計" 標籤上發佈的數字清單:
- 按細分市場劃分的資本投資預測:2023 年 12 月和 2022 年 12 月展望,差異(單位:%)
- 按細分市場劃分的資本投資預測:2023 年 12 月與 2022 年 12 月之間的展望與差異(單位:十億美元)
- 所有業者的營收成長率:新舊預測
- 電信公司營收成長率:新舊預測
- 資本密集度、電信公司:新舊預測
- 資本密集度、網路擴展器:新舊預測
- 資本強度,CNNO:新舊預測
- 收入,依業者類型(單位:十億美元,2011-2028 年)
- 按運營商類型劃分的資本投資(單位:十億美元,2011-2028 年)
- 按運營商類型劃分的資本投資(佔總數的百分比,2011-2028 年)
- 依業務類型劃分的資本強度(2011-2028 年)
- 員工人數:依業務類型劃分
- 每位以業務類型劃分的員工收入(單位:1000 美元)
- 網路營運商收入:按類型劃分,全球範圍(佔 GDP 的百分比)
- 網路營運商員工及其占世界人口的百分比
- 電信公司每名用戶的收入和資本投資(2011-2022 年)
- 支出□□前 50 名的公司:年化資本投資(單位:十億美元,2023 年第三季)
- 50強企業:長期資本密集度(2019年第四季至2023年第三季平均值)
This forecast report presents our latest projections for the network operator market, spanning telecommunications operators (telcos), webscalers, and carrier-neutral network operators (CNNOs). The forecast is based on our quarterly coverage of over 175 operators. Our forecast includes revenues, capex and employee totals for all segments, and additional metrics for each individual segment. In 2024, we expect the three operator groups to account for $4.38 trillion (T) in revenues (2022: $4.11T), $552 billion (B) in capex (2022: $563B), and 8.71 million (M) employees (2022: 8.88M). This report provides 2011-22 actuals and projections through 2028, and includes projections from past forecasts for reference.
VISUALS
Top line quantitative results
Revenues from the aggregate of our three segments - telco, webscale, and carrier-neutral - were $4,109 billion (B) in 2022, and will grow to $5,344B by 2028. Three segment capex ended 2022 at $563B, will fall to ~$550B for both 2023 and 2024, then grow to $662B in 2028. Webscale capex has flattened recently but over the longer timeframe this sector accounts for most network operator growth. In 2011, webscale was less than 10% of capex, but exceeded 36% in 2022 and will be over 43% by 2028. CNNOs will represent 7% of 2028 capex, a bit more than today, while telcos will capture just under 50% of expected 2028 network operator capex. In capital intensity terms, the all-operator average was 13.7% in 2022 but that will be just 12.4% in 2028. That's largely because of telcos: their annualized capital intensity peaked at 18.7% in 1Q23 and has begun to come down rapidly, now that most 5G networks are built. That will start to come back in 2027 and hit 17.1% in 2028. Webscalers also saw an all-time high capital intensity in 2022, of 9.1%, which is now easing. The portion of webscalers' capex spent on the network is rising, though, as operators fill up existing data centers. Capital intensity is highest in carrier-neutral, as usual, well over 30% for the whole forecast period.
Headcount across the three operator segments has grown dramatically in the last decade, from 6.48 million in 2011 to 8.88M in 2022. That is roughly the same as the 2021 figure: telcos accelerated headcount reductions in 2022, and several webscalers announced layoffs. In 2023, total headcount will be 8.76M, a bit down YoY, due mainly to ongoing telco cuts. Looking forward, we expect telco reductions to slightly accelerate, with contributions from GenAI. Webscalers will grow a bit through 2025 but then headcount will begin to decline steadily. All the years of big R&D investments into robotics and AI will start to really pay off after this, lowing workforce costs, especially for the ecommerce-oriented webscalers like Amazon and JD.Com. CNNO employment will stay just above 100,000. By segment, revenue per employee is by far the highest in CNNO, at ~$876K in 2023, versus $562K for webscale and $391K for telco. Growth in this metric will be highest in webscale, though, as the workforce starts to shrink in 2026. Telcos' growth in revenues per employee is the slowest, even with our fairly aggressive assumptions about job cuts. There is another scenario possible, in which telco execs implement GenAI aggressively in order to support near-term layoffs, especially in sales & marketing; BT is one telco which has pointed to this scenario. Most telcos will be cautious about immediate GenAI implementation for sensitive areas such as network operations, though.
Key findings by network operator type
This forecast includes detailed breakouts for each of the three network operator types. Here is a summary of some of the key findings, by segment:
Telcos: as we keep saying, telecom is essentially a zero-growth industry. Specific countries and companies do grow from time to time, in part from market share shifts, the different timing of growth cycles, or M&A. But global telco revenues have hovered in a narrow range ($1.7-$1.9 trillion) since 2011, and this will likely remain true through 2028. In 2022, revenues were $1.78T, will fall a bit in 2023, then will grow an average annual rate of 1.4% to reach $1.93T by 2028. Capex continues to vary with technology upgrade cycles (e.g. 5G) and government actions (e.g. newly issued spectrum, or rural fiber subsidies). In 2022, capex totaled $328B, or 18.1% of revenues; that's an annual all-time high capital intensity, for our coverage timeframe (2011-present). Capex will decline slightly through 2025, though, and then rise modestly again to reach $331B in 2028, which would be a 17.1% capital intensity. US capex surged in 2022, but will drop significantly in both 2023 and 2024; we already expected this, though, so the current forecast is not significantly different. Software capex is growing more slowly than expected, and now likely to remain under 20% of total capex for the forecast period. Headcount in telecom is declining faster than expected, and now likely to fall below 4.2 million in 2028, from just under 4.6 million in 2022. Labor costs per head will revert to a growth trajectory in 2023, as telcos develop a more IT/software-centric workforce.
Webscalers: growth from webscale has lifted the overall network operator market over the last decade. Webscalers surged during COVID, by all measures - revenues, capex, employment. Demand for data center chips and related gear also surged. The sector saw slower growth last year, though, and is cutting back on costs, capex, and headcount. In 2023, revenues will be about $2.32 trillion, up just 4% YoY for the second straight year. We expect revenues to grow at a ~7% CAGR through 2028. Webscale capex was $203B in 2022, a healthy increase from 2021; capex will be in a holding pattern through end of 2024 though, allowing for a couple years of capacity absorption, and start to grow again in 2025. During the lull, a larger portion of capex will be for Network/IT/software investments R&D spending by webscalers will remain high but fall from the record-breaking level of 2022 (12.0% of revenues), to a bit over 10% in 2028. As topline growth gets harder for webscalers, they will become more cost conscious and short-term oriented.
Carrier-neutral: the carrier-neutral sector remains tiny, with just $95B in 2022 revenues, but will grow to about $124B by 2028. Webscalers and telcos alike will both rely more on CNNOs over time for expansion of their data center, tower and fiber footprints. Telcos will continue to spin out portions of their infrastructure to third-parties - both traditional CNNOs (e.g. TASC Towers, which just bought 30,000 towers from Zain and Ooredoo), and joint ventures like Gigapower, the AT&T-Blackrock partnership. Total CNNO capex for 2022 was $33B, and will grow to about $45B by 2028; a large chunk of the CNNO sector's expansion will be inorganic, though, via acquisition of existing assets from other sectors. By 2028, the CNNO sector will have under its management approximately 3.8 million cell towers (2022: 3.3M), 1,718 data centers (2022: 1,223), and 1.13M route miles of fiber (2022: 945K).
Key changes since last forecast
We publish a full forecast every 6 months. Here are some factors we considered in developing this latest forecast update:
Macroeconomics: Interest rates have risen a bit more, inflation shows signs of cooling, but economic growth forecasts from the IMF remain lackluster: "The baseline forecast is for global growth to slow from 3.5 percent in 2022 to 3.0 percent in 2023 and 2.9 percent in 2024, well below the historical (2000-19) average of 3.8 percent."
Generative AI: interest and adoption of generative AI (GenAI)-based tools and apps has continued to accelerate, and operators increasingly point to GenAI as a driver for infra investment, especially in the data center. The initial impact is to drive the carrier-neutral market, enticing more investment from private equity firms to have a position in the market. There is a lot of unmeasured private market activity in the data center market, and ongoing pull from PE firms to take assets private (e.g. in 2023, Bain-ChinData, and Brookfield-Cyxtera). GenAI will help webscale capex to lift off again starting 2025.
Telco business models: Telcos continue to spin off assets and search for new business models as 5G revenue growth fails to materialize. Among the many examples: in August 2023, Austria's A1 Telkom divested a portfolio of 12,900 cell towers across 5 countries, allowing it to shed 1B Euros in debt; also in 3Q23, Polish operator Polsat made strides in scaling up its new renewable energy business line, signing a deal to sell wind-generated power to Google, commissioning 2 wind farms, one solar farm, and 2 public hydrogen refueling stations. Expansion into new markets like energy requires new capex, but that is possible for telcos who choose to move towards an asset-light business model by selling off passive assets.
Telco capex: Telcos were already guiding down capex for 2024, but the guidance became even more negative with 2Q23 and 3Q23 earnings releases. Telco capex fell 8% YoY in 3Q23, and revenues for vendors selling into the telco market fell by over 10% YoY (preliminary). We already expected capex to start to decline in 2023, but it's started a bit sooner than expected. Telcos are pushing on every cost lever they can find, whether opex- or capex-related. The smarter ones are accepting that, as we expected, webscalers and other tech players are likely to reap most of the spoils of the world's new 5G networks. Telco execs need to stick to their knitting.
Headcount: Employment levels continue to go down steadily in the telecom industry, and have plateaued in the webscale sector. There is a lot of enthusiasm among execs in the potential for GenAI to reduce headcount levels, including in the telecom industry; we have increased the rate of employee attrition in this market.
Conflict: Russia's war on Ukraine remains ongoing, but hasn't expanded to new countries. China has not invaded Taiwan as of yet, although this is a serious risk over the 5-year forecast horizon.
Climate change: global warming news continues to worsen. Intergovernmental efforts to address it are still disappointingly watered down and toothless, as the recent COP28 event confirmed. Private efforts are full of greenwashing and baby steps. Many industries are taking real change slowly, in hopes that someone else will do the heavy lifting. Within our universe of operators, there are a few webscalers and CNNOs with impressive environmental records, though most of these built their networks from scratch in the last decade. The telco market is a problem; it needs to do more in 2024. Converting to 100% renewable energy as fast as reasonable will soon be on every operator's agenda, and this will come with some upfront investment. We don't forecast energy-related capex, but we do expect green energy to account for a growing share of capex budgets over time. Offsetting this capex burden is that early moving operators will be able to stabilize their energy spending, boost their green credentials legitimately, and possibly develop a new business line (for examples, see China Tower, Indus, and Polsat).
The net impact of these factors can be seen in the individual forecast tabs within this report.
COVERAGE
Companies mentioned:
|
|
Table of Contents
Key sections include:
- 1. Abstract
- 2. Network Operator Totals
- 3. Telco
- 4. Telco - Regional Splits
- 5. Webscale
- 6. Carrier-neutral (CNNO)
- 7. Spending outlook for top operators
- 8. About
This report has a large number of figures on each of the main result tabs: totals, telco, telco - regional splits, webscale, and carrier-neutral (CNNO).
A list of figures on the "Totals" tab:
- Capex forecast by segment: Dec 2023 v. Dec 2022 outlook, % difference
- Capex forecast by segment: Dec 2023 v. Dec. 2022 outlook, $B difference
- Revenue growth rates, all operators: New vs. old forecast
- Revenue growth rates, Telcos: New vs. old forecast
- Capital intensity, Telcos: New vs. old forecast
- Capital intensity, Webscalers: New vs. old forecast
- Capital intensity, Carrier-neutral operators: New vs. old forecast
- Revenue by operator type, 2011-28 (US$B)
- Capex by operator type, 2011-28 (US$B)
- Capex by operator type, 2011-28: % of total
- Capital intensity by operator type, 2011-28
- Employees by operator type (M)
- Revenues/employee by operator type (US$K)
- Network operator revenues by type, % global GDP
- Network operator employees (M), and % global population
- Telco revenues and capex per sub, 2011-22
- Top 50 spending operators, annualized 3Q23 capex ($B)
- Top 50 operators based on long-term capital intensity (4Q19-3Q23 avg)
 2025年全球虛擬網路營運商市場報告
 Apps Run The World - 應用市場分析與買家洞察
 虛擬網路營運商市場(按營運模式、服務技術和地區)
 營運商中立網路營運商 (CNNO) 市場回顧(2024 年第四季):生成式人工智慧 (Generic AI) 熱潮加速私募股權投資
 關稅情勢如何影響美國再生能源成本
 關稅情勢對美國的再生能源成本帶來的影響- 數據
 通訊網路營運商市場回顧(2024年第三季):營收復甦,但持續的支出削減導致年度資本支出低於3,000億美元大關
 網路營運商資本支出展望(2024 年第四季版):電信公司持平,但人工智慧驅動的生成式資料中心炒作將推動電信資本支出在 2024 年超過 6,000 億美元,其中 Scalers 預計將引領市場
 網路營運商永續發展策略的全球市場:2024-2029
 Direct-to-Cell 全球市場:2024-2029