


 |
市場調查報告書
商品編碼
2163638
電子商務逆向物流:市場佔有率分析、產業趨勢與統計、成長預測(2026-2031)E-Commerce Reverse Logistics - Market Share Analysis, Industry Trends & Statistics, Growth Forecasts (2026 - 2031) |
||||||

※ 本網頁內容可能與最新版本有所差異。詳細情況請與我們聯繫。
據 Mordor Intelligence 稱,2025 年電子商務逆向物流市場價值為 1255.2 億美元,預計從 2026 年到 2031 年將以 13.85% 的複合年成長率成長,到 2031 年達到 2763.5 億美元,高於 2025 年的 144.7 億美元。
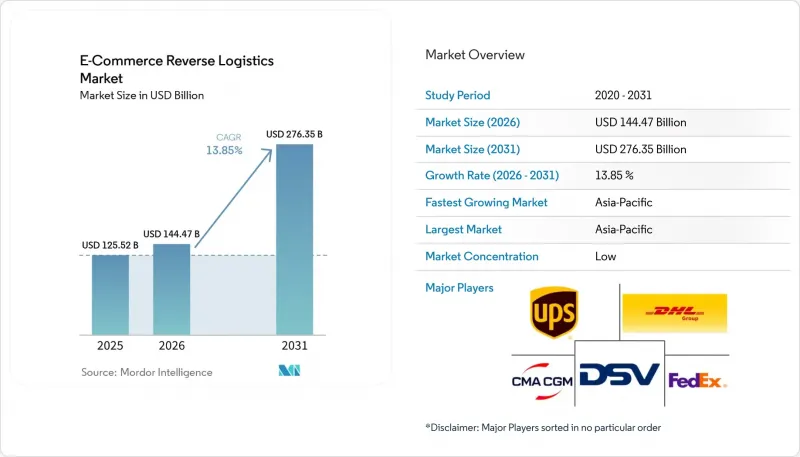
隨著線上訂單量的成長,零售商、承運商和品牌需要召回、檢驗、補貨、轉售、回收或處置的商品數量也在增加。本報告按退貨類型(商業退貨、可維修退貨、二手退貨、報廢退貨、召回退貨)、服務類型(運輸、倉儲等)、產品類型(時尚、電子產品、美妝、家居用品等)、通路類型(線上市場、DTC等)和地區(北美、南美、歐洲、亞太、中東和非洲)進行細分。市場預測以美元計價。
全球電子商務逆向物流市場趨勢與洞察
電子商務訂單量不斷成長
2026年第二季度,美國零售電商銷售額年增12.2%,達3,402億美元。這占美國零售總額的17.1%,進一步擴大了未來可能進入退貨管道的商品數量。隨著線上購物的成長,需要收集、運送、檢驗和處理的實體商品數量也隨之增加。電商逆向物流市場正受益於此數量效應,因為線上訂單的退貨率通常高於實體店購物。此外,行動端購物和透過社群媒體發現產品後進行的購買,使得消費者在收貨前更難評估產品。為此,服務供應商提供者正在關鍵客戶群附近增加處理能力,並協調承運商的運輸計畫與倉庫營運決策。
顧客期望順利退貨
便捷的退貨方式是消費者在評估線上經銷商和第三方退貨服務時考慮的關鍵因素。根據美國零售聯合會 (NRF) 統計,近三分之二的網購消費者表示至少有過一種不規範的退貨行為,例如「粗紗」或「囤積退貨」。無需包裝盒或標籤的退貨方式可以減輕消費者的負擔,並縮短從提出退貨申請到最終退款的時間。將退貨集中到易於取件的地點也有利於電商逆向物流市場,減少了上門取件的次數。然而,如果退貨政策和產品驗證不完善,這種便利性反而可能導致不必要的退貨。零售商正努力在簡化客戶體驗的同時,兼顧全面的產品檢查、客戶歷史記錄驗證和清晰的政策管理。
逆向運輸和處理高成本
由於商品需要從眾多家庭運送到數量有限的處理地點,退貨運輸和處理仍面臨許多挑戰。每件商品都可能需要上門取貨或送貨、檢驗、狀況評級、重新貼標以及單獨的處置決策。電子商務逆向物流市場在低價類別中面臨尤為巨大的壓力,因為退貨成本會侵蝕原始訂單利潤的很大一部分。根據美國零售聯合會 (NRF) 的一項調查,零售商到 2025 年實施退貨收費的兩大主要原因是運輸成本飆升和承運商運費上漲,40% 的經銷商都提到了這一點。雖然多品牌整合可以提高裝載密度,但這取決於附近是否有足夠數量的退貨收集點以及相應的分類流程。對於小規模企業而言,要達到經濟高效地處理退貨運輸和處理所需的規模可能十分困難。
細分市場分析
2025年,商業退貨佔電子商務逆向物流市場的38.60%。由於市場平台產品換貨和標準線上退貨政策導致頻繁且重複的逆向物流,該細分市場仍保持最大佔有率。無論是B2C或B2B買家,都會依照合約約定進行換貨、拒收或退貨。商業退貨項目有利於那些能夠以可預測的服務水準處理大批量退貨的企業。由於零售商需要應對各種退貨原因,電子商務逆向物流市場仍然依賴一致的接收規則。可維修退貨對於家用電器和消費性電器產品至關重要,因為翻新可以延長產品的使用壽命。報廢退貨也支援品牌回收計劃,即在產品主要使用期結束後進行回收。召回退貨雖然數量仍然較少,但需要快速的網路回應、專業處理以及提交詳細的監管文件。由於退貨原因多種多樣,服務提供者需要針對常規換貨、維修和安全相關的召回制定不同的路由規則。
預計到2031年,二手產品回收量將以15.60%的複合年成長率成長。這一成長反映了生產者延伸責任制(EPR)法規對製造商施加的回收和再利用義務。歐盟指令2025/1892已將這些要求擴展至歐盟成員國的紡織品和鞋類製造商。隨著非正式廢棄物流向有記錄的回收和再利用流程,該領域的電商逆向物流市場規模正在擴大。品牌需要能夠記錄二手產品流向並將可重複使用產品與待回收材料分離的合作夥伴。在適用生產者責任制法規的地區,收集點、分類能力和經認證的下游通路的重要性進一步凸顯。擁有現有收集網路的營運商可以為品牌提供更全面的服務。另一方面,不具備收集能力的業者在客戶要求提供合規處置證明時可能會處於劣勢。
至2025年,運輸環節將佔電子商務逆向物流市場規模的42.55%。運輸是服務鏈的實體基礎,因為每一件退貨商品都需要至少一個承運商或收貨點。承運商從用戶家中收取小包裹,在異地接收包裹,並將其運送至收貨和處理中心。網路密度會影響消費者的便利性和每次退貨的成本。即使退貨核准和產品追蹤方面的軟體有所改進,電子商務逆向物流市場仍依賴此實體基礎。承運商也會產生追蹤事件,這些事件會觸發退款核准和倉庫規劃。即使零售商提供店內退貨選項,這項服務仍然至關重要,因為商品仍需要進一步運輸。由於逆向運輸路線比出貨路線更難以預測,因此高貨量並不一定意味著高利潤率。因此,營運商正在尋求更密集的收貨網路以及在幹線運輸開始之前更有效率的收貨和分類系統。
預計到2031年,附加價值服務將以15.72%的複合年成長率成長。這些服務包括翻新、轉售支援、基於產品狀況的物流路線規劃以及品牌特定的召回流程。這些服務至關重要,因為經濟效益會因商品評估的速度和準確性而有所不同。電子商務逆向物流市場透過確保產品能夠及時退回庫存或透過最佳召回管道進行處理,從而提升自身價值,避免不必要的延誤。時尚和消費性電子產業的零售商在選擇服務供應商時,越來越重視單件召回價值。產品狀況評估、真偽驗證、維修安排以及與二次性市場的整合都有助於實現這一目標。倉儲和處理環節仍然至關重要,因為它們在商品重新入庫之前提供了必要的空間和營運管理。最有效的服務組合是將運輸視覺性與處理決策相結合,從而為零售商提供清晰的報告。
區域分析
預計到2025年,亞太地區將佔據全球電子商務逆向物流市場佔有率的35.50%,並以15.51%的複合年成長率成長至2031年。這一領先地位得益於大規模的線上零售用戶群體,以及中國、印度和東南亞地區數位零售的蓬勃發展。同時,預計2026年,中國國內零售額的39%將來自電子商務。線上活動的規模化發展催生了對專用收集、分類和運輸能力的需求。在印度和東南亞,線上購物者的成長速度遠超許多逆向物流網路的成熟速度。日本通運於2026年3月推出了「NX Return Plus」服務,為日本全國各地的電子設備收集和退貨提供運輸、包裝材料採購和調度管理。澳洲也為集中式退貨網路提供了有利條件,因為其電子商務需求主要集中在主要都市區。
北美是全球第二大市場,並且越來越依賴集中式的退貨投遞基礎設施。 2026年第二季度,美國電子商務銷售額年增12.2%,持續推動對退貨處理和運輸服務的需求。儘管該地區擁有許多成熟的零售商、承運商、小包裹網路和技術平台,但加拿大和墨西哥仍然是次市場,跨境物流流量龐大。 2026年5月,DHL電子商務和美國郵政服務(USPS)宣布達成一項價值超過100億美元的多年獨家協議,為覆蓋1.7億個配送點的最後一公里小包裹遞送提供服務。美國海關與邊境邊防安全局(CBP)將於2026年10月生效的修正案將對跨境電子商務流動增加新的合規要求。
在歐洲,有關退貨、產品資料和廢棄產品處置的法規各具特色,其中包括《包裝和包裝廢棄物條例》、2025/1892 號指令以及將於 2026 年 7 月開始實施的「數位產品護照註冊系統」。德國、英國、法國和北歐國家佔據了該地區電子商務退貨的大部分佔有率。 2025 年 4 月,GEODIS 在其位於西班牙托里亞的基地推出了一項專門的逆向物流服務,能夠處理大型產品的退貨。南美洲、中東和非洲擁有長期成長潛力,其中巴西尤其在南美洲處於領先地位,這得益於其不斷擴大的數位消費群體。
其他好處:
- Excel格式的市場預測(ME)表
- 3個月的分析師支持
目錄
第1章:引言
- 研究假設和市場定義
- 調查範圍
第2章:調查方法
第3章執行摘要
第4章 市場狀況
- 市場概覽
- 市場促進因素
- 電子商務訂單增加
- 顧客對「順利退貨」的期望
- 循環經濟和生產者延伸責任的要求
- 人工智慧驅動的收益預測與處置
- 集中式跨國退貨
- 產品級退貨一致性和資料可攜性
- 市場限制因素
- 高額退貨和手續費
- 分散的回收和資源回收基礎設施
- 退貨詐騙、服裝粗紗和產品調包。
- 跨境海關、稅務和合規的複雜性。
- 價值供應鏈分析
- 監理情勢
- 技術展望
- 波特五力分析
- 地緣政治事件對市場的影響
第5章 市場規模與成長預測
- 按返回類型
- 商業回報
- 可修復退貨
- 使用完畢後的回收
- 二手商品收藏
- 召回退貨
- 按服務類型
- 運輸
- 倉庫/存儲
- 退貨處理
- 附加價值服務
- 產品類型
- 時尚與服裝
- 家用電子產品
- 美容及個人護理
- 居家生活
- 食品和日常消費品
- 健康與保健產品
- 汽車零件及配件
- 奢侈品
- 其他產品類型
- 按頻道類型
- DTC(直接面對消費者)網站
- 網路市集
- 社群電商
- 行動應用
- 其他
- 按地區
- 北美洲
- 美國
- 加拿大
- 墨西哥
- 南美洲
- 巴西
- 阿根廷
- 秘魯
- 智利
- 其他南美國家
- 歐洲
- 德國
- 英國
- 法國
- 義大利
- 西班牙
- 俄羅斯
- 北歐國家(丹麥、芬蘭、冰島、挪威、瑞典)
- 其他歐洲國家
- 亞太地區
- 中國
- 印度
- 日本
- 韓國
- 澳洲
- 東南亞(東協)
- 其他亞太國家
- 中東和非洲
- 沙烏地阿拉伯
- 阿拉伯聯合大公國
- 卡達
- 南非
- 奈及利亞
- 埃及
- 其他中東和非洲國家
- 北美洲
第6章 競爭情勢
- 市場集中度
- 市場中的關鍵策略舉措
- 市佔率分析
- 公司簡介
- United Parcel Service of America, Inc.(UPS)
- FedEx
- DHL Group
- DSV A/S
- CMA CGM Group
- Kuehne+Nagel
- United States Postal Service
- CH Robinson Worldwide, Inc.
- XPO, Inc.
- Ryder System, Inc.
- NYK Line(including Yusen Logistics Co., Ltd.)
- Kintetsu World Express, Inc.
- Nippon Express Holdings, Inc.
- Safexpress Private Limited
- Loop Returns, Inc.
- Narvar, Inc.
- ReBound Returns
- ZigZag Global
- ShipBob, Inc.
- GEODIS
第7章 市場機會與未來展望
According to Mordor Intelligence, the e-commerce reverse logistics market size was valued at USD 125.52 billion in 2025 and is estimated to grow from USD 144.47 billion to reach USD 276.35 billion by 2031, growing at a CAGR of 13.85% between 2026 and 2031.
Rising online order volumes are enlarging the pool of goods that retailers, carriers, and brands need to collect, inspect, restock, resell, recycle, or dispose of. This report is Segmented by Return Type (Commercial, Repairable, End-Of-Use, End-Of-Life, Recall), by Service Type (Transportation, Warehousing, and More), by Product Category (Fashion, Electronics, Beauty, Home, and More), by Channel Type (Online Marketplaces, DTC, and More), and by Geography (North America, South America, Europe, Asia-Pacific, MEA). The Market Forecasts are Provided in Value (USD).
Global E-Commerce Reverse Logistics Market Trends and Insights
Rising E-Commerce Order Volumes
The United States retail e-commerce sales grew 12.2% year-over-year in the second quarter of 2026 and reached USD 340.2 billion. These sales represented 17.1% of total retail sales of the United States, sustaining a larger flow of goods that may later enter return channels. Each expansion in online purchasing increases the physical volume that needs collection, transportation, inspection, and disposition. The e-commerce reverse logistics market gains from this volume effect because online orders generally create more return activity than purchases completed in stores. Mobile-led shopping and social discovery purchases also make product assessment more difficult before delivery. Providers are responding by increasing processing capacity near major customer clusters and by linking carrier events with warehouse decisions.
Customer Expectations for Frictionless Returns
Convenient return methods have become an important part of how consumers judge online sellers and third-party return services. The National Retail Federation reported that close to two-thirds of online shoppers acknowledged at least 1 damaging return behavior, including wardrobing and bracketing. Box-free and label-free returns can reduce consumer effort and shorten the time between a return request and a refund decision. The e-commerce reverse logistics market benefits when retailers use accessible drop-off points because consolidation can reduce individual pickup activity. The same convenience can increase unnecessary return behavior when policy rules and product verification are weak. Retailers are balancing simpler customer journeys with item checks, customer history reviews, and clearer policy controls.
High Cost of Reverse Transportation and Handling
Reverse transportation and handling remain difficult because products move from many households to a smaller number of processing sites. Each item can require pickup or drop-off acceptance, inspection, condition grading, relabeling, and a separate disposition decision. The e-commerce reverse logistics market faces particular pressure in low-value categories where return costs can consume much of the original order margin. The National Retail Federation found that transportation cost escalation and carrier rate increases were among the top 2 reasons retailers introduced return fees in 2025, cited by 40% of merchants. Multi-brand consolidation can improve load density, but it depends on enough nearby drop-off locations and compatible sorting processes. Smaller operators can struggle to achieve the scale needed to make reverse freight and handling economical.
Other drivers and restraints analyzed in the detailed report include:
- Circular Economy and Extended Producer Responsibility Requirements
- Predictive Analytics and Automated Returns Decisioning
- Returns Fraud, Wardrobing, and Product Substitution
For complete list of drivers and restraints, kindly check the Table Of Contents.
Segment Analysis
Commercial returns held 38.60% of the e-commerce reverse logistics market share in 2025. The segment remained the largest because marketplace exchanges and standard online return policies create frequent, repeatable reverse flows. Both B2C and B2B buyers contribute to this activity when goods are exchanged, rejected, or returned under contractual arrangements. Commercial return programs favor operators that can process high volumes with predictable service levels. The e-commerce reverse logistics market remains dependent on consistent intake rules when retailers manage a broad mix of return reasons. Repairable returns are important in consumer electronics and home appliances, where refurbishment can extend a product's useful life. End-of-use returns also support brand programs that retrieve products after their primary use period. Recall returns remain smaller in volume but require fast network response, specialized handling, and detailed regulatory documentation. The broad mix of return reasons means providers need different routing rules for ordinary exchanges, repair candidates, and safety-related retrievals.
End-of-life returns are forecast to grow at a CAGR of 15.60% through 2031. This growth reflects extended producer responsibility rules that place collection and recovery obligations on producers. Directive 2025/1892 extended these requirements to textile and footwear producers across EU member states. The e-commerce reverse logistics market size for this segment grows as informal disposal flows move into recorded collection and recovery processes. Brands need partners that can document the movement of end-of-life products and separate reuse candidates from material recovery. Collection points, sorting capability, and certified downstream channels become more important where producer responsibility rules apply. Operators with existing recovery relationships can offer a more complete service to brands. Those without collection capacity may face a weaker position when customers require evidence of compliant disposition.
Transportation held 42.55% of the e-commerce reverse logistics market size in 2025. Every returned product needs at least 1 carrier or collection touchpoint, making transportation the physical base of the service chain. Carriers collect parcels from households, accept them at drop-off sites, and move them to consolidation or processing locations. Network density affects both consumer convenience and the cost per returned item. The e-commerce reverse logistics market depends on this physical layer even as software improves return authorization and product tracking. Transportation providers also generate tracking events that can trigger refund approvals and warehouse planning. The service remains essential even where retailers use in-store return options because goods often need onward movement. High volume does not automatically create high margins because reverse routes are less predictable than outbound delivery routes. Providers are, therefore, seeking denser collection networks and better consolidation before linehaul movements begin.
Value-added services are forecast to grow at a CAGR of 15.72% through 2031. These services include refurbishment, resale support, condition-graded routing, and brand-specific recovery workflows. They are important because an item can have a different economic outcome depending on how quickly and accurately it is assessed. The e-commerce reverse logistics market gains value when a product is restored to inventory or directed to the most suitable recovery channel without avoidable delay. Retailers in fashion and electronics are placing more weight on recovered value per unit when selecting service providers. Condition grading, authentication, repair coordination, and connections to secondary marketplaces support this objective. Warehousing and processing remain important because they provide the space and operational control required before an item can reenter inventory. The strongest service combinations connect transport visibility with processing decisions and clear reporting for the retailer.
Complete Report Scope:
- By Return Type
- Commercial Returns
- Repairable Returns
- End-of-Use Returns
- End-of-Life Returns
- Recall Returns
- By Service Type
- Transportation
- Warehousing and Storage
- Returns Processing
- Value Added Services
- By Product Category
- Fashion and Apparel
- Consumer Electronics
- Beauty and Personal Care
- Home and Living
- Grocery and Fast-Moving Consumer Goods
- Health and Wellness Products
- Automotive Parts and Accessories
- Luxury Goods
- Other Product Categories
- By Channel Type
- DTC (Direct-to-Consumer) Websites
- Online Marketplaces
- Social Commerce
- Mobile Apps
- Others
- By Geography
- North America
- United States
- Canada
- Mexico
- South America
- Brazil
- Argentina
- Peru
- Chile
- Rest of South America
- Europe
- Germany
- United Kingdom
- France
- Italy
- Spain
- Russia
- Nordics (Denmark, Finland, Iceland, Norway, and Sweden)
- Rest of Europe
- Asia-Pacific
- China
- India
- Japan
- South Korea
- Australia
- Southeast Asia (ASEAN)
- Rest of Asia-Pacific
- Middle East and Africa
- Saudi Arabia
- United Arab Emirates
- Qatar
- South Africa
- Nigeria
- Egypt
- Rest of Middle East and Africa
- North America
Geography Analysis
Asia-Pacific held 35.50% of the e-commerce reverse logistics market share in 2025 and is forecast to grow at a CAGR of 15.51% through 2031. The region leads because of its large online retail base and the expansion of digital retail across China, India, and Southeast Asia, while China accounted for 39% of national retail sales through e-commerce in 2026. The scale of online activity creates demand for dedicated collection, sorting, and transport capacity, and India and Southeast Asia are adding online buyers faster than many reverse networks are becoming mature. Nippon Express launched NX Return Plus in March 2026 to manage transportation, packaging procurement, and scheduling for device collection returns across Japan. Australia also offers favorable conditions for consolidated drop-off networks because e-commerce demand is concentrated in major urban areas.
North America is the second-largest regional market and relies increasingly on an aggregated, drop-off-based return infrastructure. The United States e-commerce sales grew 12.2% year-over-year in the second quarter of 2026, which sustained demand for return processing and transportation services. The region has a large base of established retailers, carriers, parcel networks, and technology platforms, while Canada and Mexico remain secondary markets with important cross-border flows. DHL eCommerce and the United States Postal Service announced a multi-year exclusive agreement in May 2026 worth more than USD 10 billion for last-mile parcel delivery across 170 million delivery points. The United States Customs and Border Protection changes, effective October 2026, add compliance requirements to cross-border e-commerce flows.
Europe is defined by regulations that are shaping return collection, product data, and end-of-life disposition, including the Packaging and Packaging Waste Regulation, Directive 2025/1892, and the July 2026 launch of the Digital Product Passport Registry. Germany, the United Kingdom, France, and the Nordic countries account for much of the region's e-commerce return activity. GEODIS launched a dedicated reverse logistics service at its Torija, Spain, site in April 2025, including capacity for large product returns. South America, the Middle East, and Africa offer longer-term growth potential, with Brazil leading South America through its expanding digital consumer base.
- United Parcel Service of America, Inc. (UPS)
- FedEx
- DHL Group
- DSV A/S
- CMA CGM Group
- Kuehne+Nagel
- United States Postal Service
- C.H. Robinson Worldwide, Inc.
- XPO, Inc.
- Ryder System, Inc.
- NYK Line (including Yusen Logistics Co., Ltd.)
- Kintetsu World Express, Inc.
- Nippon Express Holdings, Inc.
- Safexpress Private Limited
- Loop Returns, Inc.
- Narvar, Inc.
- ReBound Returns
- ZigZag Global
- ShipBob, Inc.
- GEODIS
Additional Benefits:
- The market estimate (ME) sheet in Excel format
- 3 months of analyst support
TABLE OF CONTENTS
1 Introduction
- 1.1 Study Assumptions and Market Definition
- 1.2 Scope of the Study
2 Research Methodology
3 Executive Summary
4 Market Landscape
- 4.1 Market Overview
- 4.2 Market Drivers
- 4.2.1 Rising E-Commerce Order Volumes
- 4.2.2 Customer Expectations for Frictionless Returns
- 4.2.3 Circular-Economy and Extended Producer Responsibility Requirements
- 4.2.4 AI-Enabled Returns Prediction and Dispositioning
- 4.2.5 Cross-Border Return Consolidation
- 4.2.6 Product-Level Return Identity and Data Portability
- 4.3 Market Restraints
- 4.3.1 High Cost of Reverse Transportation and Handling
- 4.3.2 Fragmented Recycling and Recovery Infrastructure
- 4.3.3 Returns Fraud, Wardrobing and Product Substitution
- 4.3.4 Cross-Border Customs, Tax and Compliance Complexity
- 4.4 Value / Supply-Chain Analysis
- 4.5 Regulatory Landscape
- 4.6 Technological Outlook
- 4.7 Porter's Five Forces Analysis
- 4.7.1 Threat of New Entrants
- 4.7.2 Bargaining Power of Suppliers
- 4.7.3 Bargaining Power of Buyers
- 4.7.4 Threat of Substitutes
- 4.7.5 Competitive Rivalry
- 4.8 Impact of Geopolitical Events on the Market
5 Market Size & Growth Forecasts (Value in USD)
- 5.1 By Return Type
- 5.1.1 Commercial Returns
- 5.1.2 Repairable Returns
- 5.1.3 End-of-Use Returns
- 5.1.4 End-of-Life Returns
- 5.1.5 Recall Returns
- 5.2 By Service Type
- 5.2.1 Transportation
- 5.2.2 Warehousing and Storage
- 5.2.3 Returns Processing
- 5.2.4 Value Added Services
- 5.3 By Product Category
- 5.3.1 Fashion and Apparel
- 5.3.2 Consumer Electronics
- 5.3.3 Beauty and Personal Care
- 5.3.4 Home and Living
- 5.3.5 Grocery and Fast-Moving Consumer Goods
- 5.3.6 Health and Wellness Products
- 5.3.7 Automotive Parts and Accessories
- 5.3.8 Luxury Goods
- 5.3.9 Other Product Categories
- 5.4 By Channel Type
- 5.4.1 DTC (Direct-to-Consumer) Websites
- 5.4.2 Online Marketplaces
- 5.4.3 Social Commerce
- 5.4.4 Mobile Apps
- 5.4.5 Others
- 5.5 By Geography
- 5.5.1 North America
- 5.5.1.1 United States
- 5.5.1.2 Canada
- 5.5.1.3 Mexico
- 5.5.2 South America
- 5.5.2.1 Brazil
- 5.5.2.2 Argentina
- 5.5.2.3 Peru
- 5.5.2.4 Chile
- 5.5.2.5 Rest of South America
- 5.5.3 Europe
- 5.5.3.1 Germany
- 5.5.3.2 United Kingdom
- 5.5.3.3 France
- 5.5.3.4 Italy
- 5.5.3.5 Spain
- 5.5.3.6 Russia
- 5.5.3.7 Nordics (Denmark, Finland, Iceland, Norway, and Sweden)
- 5.5.3.8 Rest of Europe
- 5.5.4 Asia-Pacific
- 5.5.4.1 China
- 5.5.4.2 India
- 5.5.4.3 Japan
- 5.5.4.4 South Korea
- 5.5.4.5 Australia
- 5.5.4.6 Southeast Asia (ASEAN)
- 5.5.4.7 Rest of Asia-Pacific
- 5.5.5 Middle East and Africa
- 5.5.5.1 Saudi Arabia
- 5.5.5.2 United Arab Emirates
- 5.5.5.3 Qatar
- 5.5.5.4 South Africa
- 5.5.5.5 Nigeria
- 5.5.5.6 Egypt
- 5.5.5.7 Rest of Middle East and Africa
- 5.5.1 North America
6 Competitive Landscape
- 6.1 Market Concentration
- 6.2 Key Strategic Moves in the Market
- 6.3 Market Share Analysis
- 6.4 Company Profiles (includes Global Level Overview, Market Level Overview, Core Segments, Financials as available, Strategic Information, Geographic/Network Coverage, Products and Services, Recent Developments)
- 6.4.1 United Parcel Service of America, Inc. (UPS)
- 6.4.2 FedEx
- 6.4.3 DHL Group
- 6.4.4 DSV A/S
- 6.4.5 CMA CGM Group
- 6.4.6 Kuehne+Nagel
- 6.4.7 United States Postal Service
- 6.4.8 C.H. Robinson Worldwide, Inc.
- 6.4.9 XPO, Inc.
- 6.4.10 Ryder System, Inc.
- 6.4.11 NYK Line (including Yusen Logistics Co., Ltd.)
- 6.4.12 Kintetsu World Express, Inc.
- 6.4.13 Nippon Express Holdings, Inc.
- 6.4.14 Safexpress Private Limited
- 6.4.15 Loop Returns, Inc.
- 6.4.16 Narvar, Inc.
- 6.4.17 ReBound Returns
- 6.4.18 ZigZag Global
- 6.4.19 ShipBob, Inc.
- 6.4.20 GEODIS
7 Market Opportunities & Future Outlook
- 7.1 White-Space and Unmet-Need Assessment

 都市區末端物流服務市場預測至2034年-按服務類型、退貨收集模式、退貨處理類型、退貨來源地、最終用戶和地區分類的全球分析
 印尼逆向物流:市場佔有率分析、產業趨勢與統計及成長預測(2026-2031)
 2026年全球逆向物流人工智慧(AI)市場報告
 2026-2030年全球逆向物流市場
 逆向物流市場分析及預測(至2035年):依類型、產品、服務、技術、組件、應用、流程、最終使用者、解決方案、模式分類逆向物流市場預測至2034年-按退貨類型、服務、物流供應商類型、退貨管道、最終用戶和地區分類的全球分析
 逆向物流市場規模、佔有率、成長及全球產業分析:按類型、應用和地區分類,並提供 2026-2034 年的洞察和預測美國逆向物流:市場佔有率分析、產業趨勢與統計、成長預測(2026-2031)
 逆向物流市場報告:按退貨類型、服務、最終用戶和地區分類(2026-2034 年)
 逆向供應鏈解決方案市場按服務類型、技術、流程步驟、通路類型、材料類型、最終用戶和應用分類-2026-2032年全球預測