


 |
市場調查報告書
商品編碼
2157143
印尼逆向物流:市場佔有率分析、產業趨勢與統計及成長預測(2026-2031)Indonesia Reverse Logistics - Market Share Analysis, Industry Trends & Statistics, Growth Forecasts (2026 - 2031) |
||||||

※ 本網頁內容可能與最新版本有所差異。詳細情況請與我們聯繫。
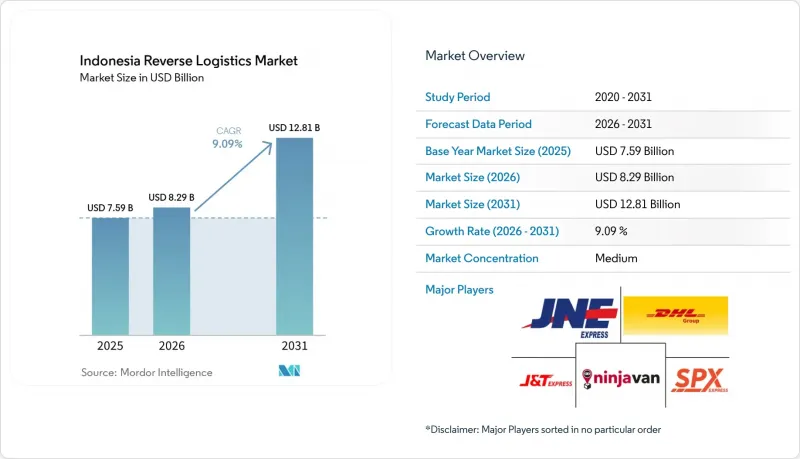
據 Mordor Intelligence 稱,2025 年印尼逆向物流市場價值為 75.9 億美元,預計到 2031 年將從 2026 年的 82.9 億美元成長至 128.1 億美元,預測期(2026-2031 年)複合年成長率為 9.09%。
印尼逆向物流市場趨勢與洞察
電子商務退貨正在推高對逆向物流的需求。
與以卡片付款為主的經濟體系相比,印尼數位市場的退貨流程呈現不同的態勢。貨到付款失敗佔出貨量的20%以上,導致退貨數量激增,遠超過消費者因商品不想要或有瑕疵而退貨的情況。在印尼B2C電商領域,產品品質被認為是退貨的主要原因,其次是配送體驗不佳或退貨政策不夠清晰。 TikTok Shop於2026年6月發布的政策規定,賣家需承擔部分退貨流量成本,每筆退貨交易最高不超過0.62美元。這凸顯了退貨對平台營運帶來的財務負擔。配送失敗和消費者退貨的雙重影響為專業服務商創造了更多商機,同時也提升了成本管理和快速恢復在印尼整個逆向物流市場的重要性。此外,這種情況也促使服務商需要區分因配送失敗而導致的退貨和使用或檢驗後退貨。這是因為即使兩個包裹都通過同一個市場網路,取件時間、狀態檢查、與賣家的溝通、庫存狀態以及合適的最終配送路線也可能有所不同。
隨著顧客期望的提高,產品退貨的處理速度也越來越快。
隨著客戶期望的不斷提高,退貨處理時間已成為留住經銷商並確保其盈利的關鍵因素。一項針對印尼日常消費品(FMCG)倉庫的調查顯示,雖然退貨量的不確定性會降低倉庫績效,但退貨資訊的品質對營運結果至關重要。因此,對於處理日益成長的退貨量的企業而言,檢驗記錄、狀態代碼和清晰的處置決策至關重要。 SiCepat Logistik 於 2026 年 7 月推出了其服務,提供從取貨到退貨的追蹤功能、儀錶板 API 和數位化調度。這些工具減少了取貨和最終處置之間不必要的人工操作。處理速度對於醫療用品和消費性電子產品的退貨尤其重要,因為任何錯誤都可能導致財務和合規問題。流程可靠性的提高也意味著賣家能夠獲得更清晰的狀態更新,倉庫可以根據入庫貨物安排人員和空間,操作人員可以對貨物進行分類,以便進行補貨、維修、召回或進一步運輸,而無需等待不完整的資訊。
碎片化的回收網路阻礙了逆向物流的效率。
許多二、三線城市缺乏附近的檢驗、維修或退貨轉售準備設施。供應商往往需要承擔多段運輸環節,或是等待貨物累積到一定數量才能進行拼箱。一項針對34個省份的調查發現,港口連通性的改善使島際價格波動降低了4.7%至6.2%,但即使在投資海運航線後,零售價格差異仍然基本保持不變。這表明,僅改善正向物流並不能完全解決「最後一公里」和「回程公里」的難題。 「海運通行費計畫」在2025年完成了756個航次,向104個港口運輸了32,732個標準箱,但對回程物流基礎設施的類似投資仍然有限。蘇拉威西島、加里曼丹島和蘇門答臘島分散的物流流的拼箱服務在印尼逆向物流市場仍然蘊藏著巨大的商機。在無法保證可預測的退貨量的情況下,企業面臨著艱難的選擇:要么為了高效裝載而儲存貨物,要么即使單位成本更高也要儘早運輸貨物,而這兩種選擇都可能延遲貨物的回收、補貨或最終處置。
細分市場分析
2025年,運輸業佔印尼逆向物流市場佔有率的43.25%,反映了城際、島際和最後一公里退貨和運輸的成本。在爪哇島和蘇門答臘島的主要路線上,由於收集點、分類設施和履約中心之間的緊密協調,陸路運輸承擔了大部分的貨運量。當退貨需要在消費者、零售商、倉庫和集散點之間進行常規運輸時,這種運輸方式仍然至關重要。空運則用於處理對時間要求嚴格的藥品和昂貴電子產品的退貨,這些退貨需要快速處理和嚴格控制。雖然空運的貨運量有限,但當對貨物狀況、時間和儲存歷史的管理要求限制了其他較慢的運輸方式時,空運仍扮演著重要角色。海運整合結合了其他運輸方式,對於時間要求相對較低且能夠經濟高效地負載容量的退貨而言,海運拼箱的重要性日益凸顯。 SiCepat的「快速通道」島際海運服務為離島符合資格的退貨提供了一種低成本的空運替代方案。該服務體現了根據貨物價值、所需處理時間和島嶼位置設施展現了高效能接收、掃描、分類和重新派送日益成長的貨運量所需的規模。
其他附加價值服務預計將以12.45%的複合年成長率(CAGR)實現最快成長,從2026年到2031年。倉儲仍然是第二大功能,因為退貨商品在重新入庫或再次銷售之前需要進行臨時存儲、檢驗、評級和處置。這些設施使企業能夠檢驗商品、記錄其狀況,並決定是將其重新銷售、送修或進入回收管道。倉儲還允許企業在將商品運送到一個目的地之前進行集中管理,從而減少了不必要的長途運輸。此類別包括退貨處理、翻新、重新入庫和最終處置。其成長反映出人們越來越關注退貨庫存的運輸成本及其可回收價值。 Blibli的「快速履行」平台服務於100個品牌,自2024年外部推出以來,兩年內累計商品交易總額(GMV)達到2億美元。該平台展示了品牌如何整合線上和線下管道的儲存、訂單處理和退貨處理。該系統減少了不同服務供應商之間的交接環節,提高了退貨庫存的透明度。它還有助於更快地做出關於補貨、轉售、維修、回收或處置的決策。生產者責任制法規可能會進一步推動對受監管的維修、回收和處置服務的需求。這些優勢提升了非運輸營運能力在印尼逆向物流市場的重要性。
其他好處:
- Excel格式的市場預測(ME)表
- 3個月的分析師支持
目錄
第1章:引言
- 研究假設和市場定義
- 調查範圍
第2章:調查方法
第3章執行摘要
- 市場規模、成長率與未來預測
- 逆向物流的主要需求促進因素和趨勢
- 主要資本回流與需求集中
- 競爭格局與主要逆向物流營運商
第4章 市場狀況
- 市場概況及逆向物流的重要性
- 市場促進因素
- 電子商務退貨量的增加推高了對逆向物流的需求。
- 顧客的期望正在加速產品退貨的處理。
- 循環經濟的優先事項:加強產品價值回收
- 生產者召回義務支持有組織的逆向物流
- 二手商品交易的成長正在擴大退貨庫存的回收管道。
- 將業務拓展到區域城市,正為逆向物流創造新的商機。
- 市場限制因素
- 碎片化的回收網路限制了逆向物流的效率。
- 島際運輸導致運輸和裝卸成本增加
- 返回資料缺乏標準化增加了處理的複雜性。
- 退貨詐騙和仿冒品的增加提高了企業的風險。
- 價值鏈結構與逆向物流流程分析
- 法律規範與逆向物流合規性分析
- 技術採納及逆向物流數位化分析
- 逆向物流需求的演變
- 消費者行為與偏好變化的研究
- 退貨成本對零售商的影響——分析師觀點
- 波特五力分析
- 地緣政治事件對供應鏈變化的影響
第5章 市場規模與成長預測
- 功能性逆向物流
- 運輸
- 路
- 航空
- 其他交通方式
- 倉儲營運(儲存、配送、收貨)
- 其他附加價值服務(退貨處理、重新入庫、翻新、處置)
- 運輸
- 按最終用戶行業分類
- 消費品和零售
- 家居與室內設計
- 醫療和藥品
- FMCG
- 其他最終用戶
- 按地區
- 爪哇島(雅加達和博多)
- 蘇門答臘
- 加里曼丹
- 蘇拉威西
- 峇裡島和努沙登加拉
- 巴布亞地區和摩鹿加群島
第6章 競爭情勢
- 市場集中度
- 策略趨勢
- 市佔率分析
- 公司簡介
- DHL Group
- DSV A/S
- Kuehne+Nagel
- CMA CGM Group(Including CEVA Logistics)
- GEODIS
- Rhenus Group
- NX Group
- FedEx
- United Parcel Service of America, Inc.(UPS)
- Shipper
- JNE Express
- J&T Express
- SPX Express
- Pos Indonesia
- Ninja Van(Including Ninja Xpress)
- SiCepat Ekspres
- Paxel
- Access Logistik
- Anteraja
- Gojek Logistics(GoSend/GoTo Logistics)
- Wahana Prestasi Logistik
- KAI Logistik
第7章 市場機會與未來展望
第8章附錄
According to Mordor Intelligence, the Indonesia reverse logistics market size was valued at USD 7.59 billion in 2025 and is estimated to grow from USD 8.29 billion in 2026 to reach USD 12.81 billion by 2031, at a CAGR of 9.09% during the forecast period (2026-2031).
Indonesia Reverse Logistics Market Trends and Insights
E-commerce Returns Increasing Demand for Reverse Logistics
Indonesia's digital marketplaces created return flows that differed from those in predominantly card-based economies. Cash-on-delivery delivery failures accounted for more than 20% of shipments and added returns beyond products that consumers sent back because they were unwanted or defective. Product quality ranked ahead of delivery experience and return-policy clarity as a reason for consumer returns in Indonesian B2C e-commerce. TikTok Shop's June 2026 policy requires sellers to bear part of the return logistics costs, up to USD 0.62 per reverse transaction, which shows the financial burden of returns within platform operations. This mix of failed deliveries and consumer-led returns expanded the work available to specialist providers. It also made cost control and faster collection more important across the Indonesia reverse logistics market. The combination also required providers to handle returns that began with a failed delivery differently from products returned after use or inspection, because collection timing, condition review, seller communication, inventory status, and the suitable final route could vary even when both parcels moved through the same marketplace network.
Customer Expectations Accelerating Faster Product Return Processing
Return-processing time became a more important part of merchant retention and seller economics as customer expectations increased. A study of Indonesian FMCG warehouses found that uncertainty in return volume reduced warehouse performance, while return information quality played an important role in operational outcomes. This made inspection records, condition codes, and clear disposition decisions valuable for providers handling growing return volumes. SiCepat Logistik launched in July 2026 with tracking, dashboard APIs, and digital pickup-to-return scheduling capabilities. These tools reduced avoidable manual steps between collection and final disposition. Faster processing became especially important for healthcare and consumer electronics returns, where errors might create financial or compliance consequences. A more reliable process also enables sellers to receive clearer status updates, warehouses to prepare staff and space for incoming goods, and operators to separate goods for restocking, repair, recovery, or further transport without waiting for incomplete information.
Fragmented Recovery Networks Limiting Reverse Logistics Efficiency
Many Tier 2 and Tier 3 locations lacked nearby facilities for return inspection, repair, or resale preparation. Providers often had to absorb several transport legs or wait until enough goods accumulated to justify a consolidated shipment. A study across 34 provinces found that stronger port connectivity reduced inter-island price variation by 4.7-6.2%, although retail price gaps changed little after sea-route investment. The finding indicated that forward-distribution improvements had not fully resolved last-mile and return-mile constraints. The Sea Toll Program completed 756 voyages and moved 32,732 TEUs to 104 ports in 2025, but comparable investment in return-flow infrastructure remained limited. Consolidation services for fragmented flows in Sulawesi, Kalimantan, and Sumatra remained a clear opportunity within the Indonesia reverse logistics market. Without predictable return volumes, providers faced a difficult choice between holding goods for an efficient load or moving them sooner at a higher unit cost, and both choices could delay recovery, restocking, or final disposition.
Other drivers and restraints analyzed in the detailed report include:
- Circular Economy Priorities Strengthening Product Value Recovery
- Producer Take-Back Obligations Supporting Organized Reverse Logistics
- Inter-Island Returns Increasing Transportation and Handling Costs
For complete list of drivers and restraints, kindly check the Table Of Contents.
Segment Analysis
Transportation held 43.25% of the Indonesia reverse logistics market share in 2025, reflecting the cost of inter-city, inter-island, and last-mile return movement. Road transport carried much of the volume along Java and major Sumatran routes, where collection points, sortation facilities, and fulfillment centers were more closely linked. This mode remained essential when returns needed routine movement between consumers, sellers, warehouses, and consolidation sites. Air transport handled time-sensitive pharmaceutical returns and high-value electronics that required a faster turnaround and closer control. Its role was narrower in volume terms, but it remained important when condition, timing, and chain-of-custody requirements limited the use of slower modes. Sea consolidation under other modes gained relevance for returns that were less time-sensitive and could be grouped into economic loads. SiCepat's Fast Lane inter-island sea-freight service provided a lower-cost alternative to air freight for suitable outer-island returns. The service reflected a need to match transport choice with the product's value, required turnaround, and island location. It also showed that providers could reduce reverse movement costs by avoiding a single-mode approach. J&T Express had 127 sortation centers across Southeast Asia by mid-2026, including 6 units added during the first half and 75 automated sorting lines. This infrastructure showed the scale needed to receive, scan, separate, and redirect rising transport volumes efficiently.
Other value-added services had the fastest forecast growth at 12.45% CAGR from 2026 to 2031. Warehousing remained the second-largest function because returned goods needed staging, inspection, grading, and disposition before restocking or resale. These sites gave operators time to verify the item, record its condition, and decide whether it could return to sale, move to repair, or enter a recovery channel. Warehousing also limited unnecessary long-distance movements by allowing operators to consolidate goods before a further transfer. This group included return processing, refurbishment, restocking, and final disposition. Its growth reflected greater attention to the recoverable value of returned inventory rather than only the cost of moving it. Blibli's Fulfillment at Speed platform served 100 brands and recorded cumulative GMV of USD 200 million in the 2 years after its 2024 external launch. The platform illustrated how brands could combine storage, order fulfillment, and return handling across online and offline channels. Such arrangements reduced handoffs between separate service providers and improved visibility over returned stock. They also supported quicker decisions on restocking, resale, repair, recycling, or disposal. Producer responsibility rules could further support demand for compliant repair, recovery, and disposition services. These functions increased the importance of operational capability beyond transport in the Indonesia reverse logistics market.
Complete Report Scope:
- By Reverse Logistics Function
- Transportation
- Road
- Air
- Other Modes
- Warehousing (Storage, Distribution, Consolidation)
- Other Value-added Services (Return Processing, Restocking, Refurbishment, Disposition)
- Transportation
- By End-user Industry
- Consumer and Retail
- Home and Decor
- Healthcare and Pharmaceuticals
- FMCG
- Other End Users
- By Region
- Java (Jakarta and BOD)
- Sumatra
- Kalimantan
- Sulawesi
- Bali and Nusa Tenggara
- Papua Region and Maluku Islands
List of Companies Covered in this Report:
- DHL Group
- DSV A/S
- Kuehne+Nagel
- CMA CGM Group (Including CEVA Logistics)
- GEODIS
- Rhenus Group
- NX Group
- FedEx
- United Parcel Service of America, Inc. (UPS)
- Shipper
- JNE Express
- J&T Express
- SPX Express
- Pos Indonesia
- Ninja Van (Including Ninja Xpress)
- SiCepat Ekspres
- Paxel
- Access Logistik
- Anteraja
- Gojek Logistics (GoSend/GoTo Logistics)
- Wahana Prestasi Logistik
- KAI Logistik
Additional Benefits:
- The market estimate (ME) sheet in Excel format
- 3 months of analyst support
TABLE OF CONTENTS
1 INTRODUCTION
- 1.1 Study Assumptions and Market Definition
- 1.2 Scope of the Study
2 RESEARCH METHODOLOGY
3 EXECUTIVE SUMMARY
- 3.1 Market Size, Growth, and Forecast Outlook
- 3.2 Key Demand Drivers and Reverse Logistics Trends
- 3.3 Major Return Flows and Demand Concentration
- 3.4 Competitive Landscape and Leading Reverse Logistics Providers
4 MARKET LANDSCAPE
- 4.1 Market Overview and Importance of Reverse Logistics
- 4.2 Market Drivers
- 4.2.1 E-commerce Returns Increasing Demand for Reverse Logistics
- 4.2.2 Customer Expectations Accelerating Faster Product Return Processing
- 4.2.3 Circular Economy Priorities Strengthening Product Value Recovery
- 4.2.4 Producer Take-Back Obligations Supporting Organized Reverse Logistics
- 4.2.5 Recommerce Growth Expanding Returned Inventory Recovery Channels
- 4.2.6 Secondary-City Expansion Creating New Reverse Logistics Opportunities
- 4.3 Market Restraints
- 4.3.1 Fragmented Recovery Networks Limiting Reverse Logistics Efficiency
- 4.3.2 Inter-Island Returns Increasing Transportation and Handling Costs
- 4.3.3 Poor Return Data Standardization Increasing Processing Complexity
- 4.3.4 Return Fraud and Counterfeiting Increasing Operational Risks
- 4.4 Value Chain Structure and Reverse Logistics Flow Analysis
- 4.5 Regulatory Framework and Reverse Logistics Compliance Analysis
- 4.6 Technology Adoption and Reverse Logistics Digitalization Analysis
- 4.7 Evolution of Reverse Logistics Requirements
- 4.8 Study on Changing Consumer Behavior and Preferences
- 4.9 Impact of Cost of Returns on Retailers - Analyst View
- 4.10 Porter's Five Forces Analysis
- 4.10.1 Threat of New Entrants
- 4.10.2 Bargaining Power of Buyers
- 4.10.3 Bargaining Power of Suppliers
- 4.10.4 Threat of Substitute Services
- 4.10.5 Intensity of Competitive Rivalry
- 4.11 Impact of Geo-Political Events on Supply Chain Shifts
5 MARKET SIZE AND GROWTH FORECASTS
- 5.1 By Reverse Logistics Function
- 5.1.1 Transportation
- 5.1.1.1 Road
- 5.1.1.2 Air
- 5.1.1.3 Other Modes
- 5.1.2 Warehousing (Storage, Distribution, Consolidation)
- 5.1.3 Other Value-added Services (Return Processing, Restocking, Refurbishment, Disposition)
- 5.1.1 Transportation
- 5.2 By End-user Industry
- 5.2.1 Consumer and Retail
- 5.2.2 Home and Decor
- 5.2.3 Healthcare and Pharmaceuticals
- 5.2.4 FMCG
- 5.2.5 Other End Users
- 5.3 By Region
- 5.3.1 Java (Jakarta and BOD)
- 5.3.2 Sumatra
- 5.3.3 Kalimantan
- 5.3.4 Sulawesi
- 5.3.5 Bali and Nusa Tenggara
- 5.3.6 Papua Region and Maluku Islands
6 COMPETITIVE LANDSCAPE
- 6.1 Market Concentration
- 6.2 Strategic Moves
- 6.3 Market Share Analysis
- 6.4 Company Profiles (includes Global Level Overview, Market Level Overview, Core Segments, Financials as available, Strategic Information, Geographic Coverage, Products and Services, Recent Developments)
- 6.4.1 DHL Group
- 6.4.2 DSV A/S
- 6.4.3 Kuehne+Nagel
- 6.4.4 CMA CGM Group (Including CEVA Logistics)
- 6.4.5 GEODIS
- 6.4.6 Rhenus Group
- 6.4.7 NX Group
- 6.4.8 FedEx
- 6.4.9 United Parcel Service of America, Inc. (UPS)
- 6.4.10 Shipper
- 6.4.11 JNE Express
- 6.4.12 J&T Express
- 6.4.13 SPX Express
- 6.4.14 Pos Indonesia
- 6.4.15 Ninja Van (Including Ninja Xpress)
- 6.4.16 SiCepat Ekspres
- 6.4.17 Paxel
- 6.4.18 Access Logistik
- 6.4.19 Anteraja
- 6.4.20 Gojek Logistics (GoSend/GoTo Logistics)
- 6.4.21 Wahana Prestasi Logistik
- 6.4.22 KAI Logistik
7 MARKET OPPORTUNITIES AND FUTURE OUTLOOK
- 7.1 White-Space Opportunities and Unmet Reverse Logistics Needs
- 7.2 High-Potential End-User Segments and Growth Opportunities
- 7.3 Strategic Growth Priorities Across Reverse Logistics Ecosystem
- 7.4 Future Market Outlook and Emerging Return Demand Pockets
8 APPENDIX

 都市區末端物流服務市場預測至2034年-按服務類型、退貨收集模式、退貨處理類型、退貨來源地、最終用戶和地區分類的全球分析
 電子商務逆向物流:市場佔有率分析、產業趨勢與統計、成長預測(2026-2031)
 2026年全球逆向物流人工智慧(AI)市場報告
 2026-2030年全球逆向物流市場
 逆向物流市場分析及預測(至2035年):依類型、產品、服務、技術、組件、應用、流程、最終使用者、解決方案、模式分類逆向物流市場預測至2034年-按退貨類型、服務、物流供應商類型、退貨管道、最終用戶和地區分類的全球分析
 逆向物流市場規模、佔有率、成長及全球產業分析:按類型、應用和地區分類,並提供 2026-2034 年的洞察和預測美國逆向物流:市場佔有率分析、產業趨勢與統計、成長預測(2026-2031)
 逆向物流市場報告:按退貨類型、服務、最終用戶和地區分類(2026-2034 年)
 逆向供應鏈解決方案市場按服務類型、技術、流程步驟、通路類型、材料類型、最終用戶和應用分類-2026-2032年全球預測