


 |
市場調查報告書
商品編碼
2163597
印尼整箱貨運 (FCL):市場佔有率分析、行業趨勢和統計數據以及成長預測 (2026-2031)Indonesia Full Container Load (FCL) - Market Share Analysis, Industry Trends & Statistics, Growth Forecasts (2026 - 2031) |
||||||

※ 本網頁內容可能與最新版本有所差異。詳細情況請與我們聯繫。
據 Mordor Intelligence 稱,2025 年印尼整箱貨運 (FCL) 市場價值為 53.2 億美元,預計到 2031 年將達到 78.2 億美元,而 2026 年為 57.2 億美元,2026 年至 2031 年預測成長率為 6.45%。
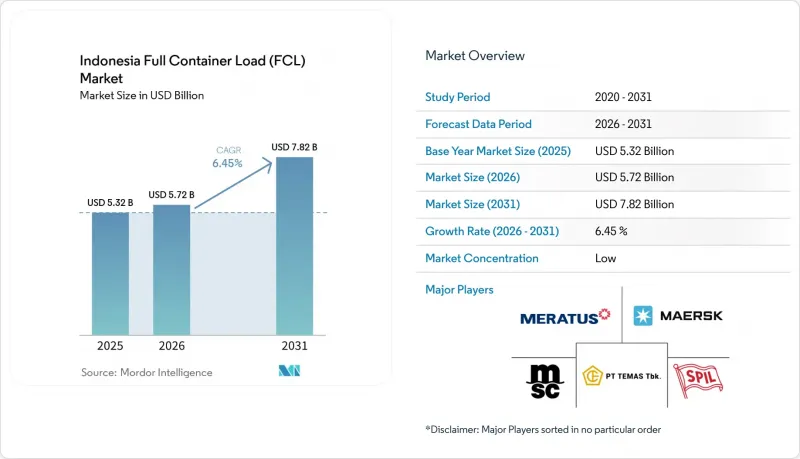
印尼整箱貨運 (FCL) 市場的發展主要受貨櫃利用率提高、工業加工投資增加以及印尼島際貿易成長的驅動。由於運輸路線、出口樞紐和當地處理能力的不同,各島嶼之間的貨物運輸趨勢差異顯著。本報告按貿易流量(國內/島際整箱貨運、國際整箱貨運)、貨櫃類型(乾貨、冷藏、罐式、特殊設備)、貨櫃尺寸(20英尺、40英尺)、終端用戶行業(製造業/工業、零售/消費品、食品飲料等)以及地區(爪哇島、蘇門臘島、加里曼丹島等細分市場。市場預測以美元計價。
印尼整箱貨運 (FCL) 市場趨勢與洞察
容器化的進步導致國內和出口的整箱貨運量(FCL)不斷增加。
國內貨物運輸正從散貨運輸轉向貨櫃運輸,這使得訂艙量不再完全依賴整體貿易成長。根據三寶壟港務局(TPK Semarang)的數據顯示,2026年1月至5月,出口貨櫃數量年增13.7%,達到189,162個標準箱(TEU)。越來越多的製造商選擇整箱運輸作為常規運輸方式,二級港口的可靠性也不斷提高。這種轉變使印尼整箱市場的需求基礎比主要與大宗商品價格掛鉤的貨物運輸更為穩定。同時,這也有助於航運公司規劃運能,使其能夠調整船舶分配以符合常規工業運輸的需求。
港口擴建提高了貨櫃裝卸能力和效率。
新碼頭吞吐能力的擴張正在改變印尼整箱貨運(FCL)市場的供應結構。 2026年8月,印尼航運公司(Perindo)位於丹戎不碌港的Petikemas 2號碼頭投入運營,新增泊位517.5米,堆場面積98,700平方公尺。 Perindo的「印尼網路鐘擺」計畫旨在興建20條島際航運走廊,其中7條計畫於2026年底前建成。帕蒂芒港的初始吞吐能力為20萬個標準箱,計劃在下一階段擴建至60萬個標準箱。增加港口數量可以減少對單一樞紐的依賴,但其效果取決於與公路、鐵路和堆場的連接。因此,對二級港口的投資至關重要,因為它將決定新增吞吐能力是緩解瓶頸還是將瓶頸轉移到內陸。
空集裝箱數量不平衡導致重新部署和回程傳輸成本增加。
東西方貿易不平衡仍然是印尼整箱貨運(FCL)市場持續存在的成本問題。這顯示東西方之間的裝貨率仍維持在30%左右,許多貨櫃從東部港口空載返回。根據印尼國家物流公司(PELNI)2025年的數據,托勞特航線的出口貨物量為9,103個標準箱(TEU),而回程貨物量僅為4,039個標準箱。這種不平衡增加了出口商的搬遷成本和運費。學術研究也指出,市場結構和空箱回程傳輸是影響卡車運輸成本效益的重要因素。與以爪哇島為中心的運輸路線相比,這種限制在偏遠生產地區尤其突出,因為這些地區的回程貨物量存在不確定性。
細分市場分析
2025年,印尼國內及島際航運服務佔印尼整箱貨運(FCL)市佔率的65.89%。 「海上運輸」(Toru Laut)計劃在2025年涵蓋104個港口,並獲得6,234億印尼幣(約3,740萬美元)的補貼。根據貨物運輸機制,2026年的撥款調整為5,250億印尼幣(約3,150萬美元)。隨著需求的穩定,該計劃預計將為私人營運商開發具有商業性可行性的航線。 2025年,「海上運輸」計畫的回程貨物僅佔總貨運量的31%,凸顯了反向貨物運輸的挑戰。
國際航運路線代表快速成長的貿易流量,預計2026年至2031年將以8.94%的複合年成長率成長。這些路線運輸進口原料和資本財以及出口加工產品。這種貨物構成要求承運商既要應對常規的工業需求,又要應對貿易路線的不平衡。在印尼的整箱貨運(FCL)市場,營運商受益於出口貨物的整合以及確保可靠的回程傳輸貨源。這項需求很可能仍將是私人投資東部航道決策的核心因素。
到2025年,乾貨貨櫃將佔印尼整箱貨運(FCL)市場的82.37%。由於冷藏倉庫和標準化物流設施的普及,冷藏貨櫃在爪哇島和蘇門答臘島的盈利日益增強。隨著服務供應商滿足藥品良好分銷規範(GDP)的要求,對藥品處理的要求也日趨嚴格。這些要求可能有利於那些擁有檢驗的處理流程和設施的營運商。
預計到2031年,冷藏貨櫃的複合年成長率將達到9.45%,在所有貨櫃類型中增速最高。藥品、水產品、加工食品和營養援助計畫的運輸需求推動了對溫控運輸能力的需求。目前,仍有30%的藥品運輸在運輸過程中面臨溫度控制問題。這一缺口導致東部走廊對更可靠的冷藏貨櫃服務的需求增加。因此,在印尼的整箱貨運(FCL)市場,儘管乾貨貨櫃仍然是主要的運輸方式,但對專業化運輸能力的需求仍然存在。
其他好處:
- Excel格式的市場預測(ME)表
- 3個月的分析師支持
目錄
第1章:引言
- 研究假設和市場定義
- 調查範圍
第2章:調查方法
第3章執行摘要
- 市場規模、成長率與未來預測
- 整箱運輸的主要需求促進因素和趨勢
- 主要整箱貨運門戶和貨物堵塞
- 競爭格局與主要整車物流供應商
第4章 市場狀況
- 市場概況及整箱貨運(FCL)市場的重要性
- 市場促進因素
- 容器化的進步導致國內和出口的整箱貨運量(FCL)不斷增加。
- 港口擴建提高了貨櫃裝卸能力和效率。
- 工業投資的擴大正在提振對出口型貨櫃貨物的需求。
- 數位化提高了港口與內陸地區的連結性,增強了運輸狀況的透明度。
- Sea-Toll Development 加強了印尼東部的貨櫃運輸連通性。
- 冷藏貨櫃需求的不斷成長,也帶動了對專業貨櫃運輸的需求。
- 市場限制因素
- 空貨櫃供需失衡導致重新部署和回程傳輸成本增加。
- 港口和內陸運輸延誤導致貨櫃物流總成本上升。
- 區域基礎設施差異限制了貨櫃的有效利用。
- 海關手續和文件準備的日益複雜化,為整箱貨物 (FCL) 的運輸處理帶來了更多摩擦。
- 價值鏈結構及整箱貨運流量分析
- 整箱運輸的法律規範與合規性分析
- 對FCL(字段分類)數位化中新技術的引入和趨勢進行分析。
- 主要港口和整船貨運通道的集中度分析
- 整船貨運價格及附加費趨勢分析
- 航運公司網路與服務網路分析
- 波特五力分析
- 地緣政治事件對供應鏈變化的影響
第5章 市場規模與成長預測
- 按貿易趨勢
- 國內/島際整箱
- 國際整箱
- 進口流程
- 出口流量
- 按容器類型
- 乾貨容器
- 冷藏貨櫃
- 槽式貨櫃
- 專用設備貨櫃
- 按容器尺寸
- 20英尺貨櫃
- 40英尺貨櫃
- 按最終用戶行業分類
- 製造業和工業
- 零售和消費品
- 食品/飲料
- 汽車及汽車零件
- 化工/石油化工
- 電子與電機工程
- 農業和林業
- 醫療和藥品
- 其他最終用戶
- 按地區
- 爪哇島(雅加達和博多)
- 蘇門答臘
- 加里曼丹
- 蘇拉威西
- 峇裡島和努沙登加拉
- 巴布亞地區和摩鹿加群島
第6章 競爭情勢
- 市場集中度
- 策略趨勢
- 市佔率分析
- 公司簡介
- Mediterranean Shipping Company(MSC)
- AP Moller-Maersk
- CMA CGM
- COSCO SHIPPING Lines
- Ocean Network Express(ONE)
- Hapag-Lloyd
- Evergreen Marine Corporation
- Yang Ming Marine Transport Corporation
- HMM Co., Ltd.
- Pacific International Lines(PIL)
- ZIM Integrated Shipping Services
- Wan Hai Lines
- SITC International Holdings
- X-Press Feeders
- PT Salam Pacific Indonesia Lines(SPIL)
- Meratus Group
- PT TEMAS Tbk
- PT Samudera Indonesia Tbk
- PT Tanto Intim Line
- DHL Global Forwarding
- Kuehne+Nagel International AG
- DSV A/S
第7章 市場機會與未來展望
第8章附錄
According to Mordor Intelligence, the Indonesia full container load (FCL) market size was valued at USD 5.32 billion in 2025 and is estimated to grow from USD 5.72 billion in 2026 to reach USD 7.82 billion by 2031, at a CAGR of 6.45% during the forecast period from 2026 to 2031.
The Indonesia full container load (FCL) market is supported by rising container use, industrial processing investment, and trade among Indonesia's islands, where freight patterns vary sharply by corridor, export base, and local handling capacity. This report is Segmented by Trade Flow (Domestic/Inter-Island FCL, International FCL), by Container Type (Dry, Refrigerated, Tank, Special Equipment), by Container Size (20-Foot, 40-Foot), by End-User Industry (Manufacturing and Industrial, Retail and Consumer Goods, Food and Beverage, and More), and by Region (Java, Sumatra, Kalimantan, and More). The Market Forecasts are Provided in Terms of Value (USD).
Indonesia Full Container Load (FCL) Market Trends and Insights
Containerization Growth Increasing Domestic and Export FCL Volumes
Domestic cargo is shifting from break-bulk handling toward containerized movements, creating bookings that do not depend only on overall trade growth. TPK Semarang reported a 13.7% year-over-year increase in export containers to 189,162 TEUs from January to May 2026. More manufacturers are selecting dedicated full-container shipments as service frequency, and reliability improves at secondary ports. This shift gives Indonesia full container load (FCL) market a steadier demand base than cargo flows linked mainly to commodity prices. It also supports capacity planning because operators can align vessel deployment with repeat industrial shipments.
Port Expansion Improving Container Handling Capacity and Efficiency
New terminal capacity is changing the supply structure of the Indonesia full container load (FCL) market. Pelindo began operating Terminal 2 Petikemas at Tanjung Priok in August 2026, adding a 517.5 m berth and 98,700 m2 of yard space. Pelindo's Indonesia Network Pendulum plan also targets 20 inter-island shipping corridors, including 7 planned by the end of 2026. Patimban has an initial installed capacity of 200,000 TEUs and is planned to expand to 600,000 TEUs in its next phase. Additional gateways can reduce dependence on a single hub, but their benefit depends on road, rail, and depot connections. Investment at secondary ports is, therefore, important because it determines whether new capacity removes bottlenecks or moves them inland.
Empty Container Imbalances Increasing Repositioning and Backhaul Costs
East-to-west trade imbalances remain a persistent cost issue for the Indonesia full container load (FCL) market. This indicates that east-to-west load factors remain near 30%, leaving many containers to return empty from eastern ports. PELNI data for 2025 showed 9,103 TEUs of outbound cargo and 4,039 TEUs of return cargo on Tol Laut routes. This imbalance increased repositioning expenses and raised freight charges for exporters. Academic research also identifies market structure and empty backhauls as important factors in trucking cost efficiency. The constraint is particularly relevant for remote production areas, where a return load is less certain than on Java-based corridors.
Other drivers and restraints analyzed in the detailed report include:
- Industrial Investment Increasing Export-Oriented Containerized Cargo Demand
- Digitalization Improving Port-Hinterland Coordination and Shipment Visibility
- Port-Hinterland Delays Increasing Overall Container Logistics Costs
For complete list of drivers and restraints, kindly check the Table Of Contents.
Segment Analysis
Domestic and inter-island services held 65.89% of the Indonesia full container load (FCL) market share in 2025. The Tol Laut program served 104 ports in 2025 and received IDR 623.4 billion (USD 37.40 million) in subsidy support. Its 2026 allocation changed to IDR 525.0 billion (USD 31.50 million) under a cargo consignment mechanism. The program can open commercially viable routes to private operators as demand becomes established. Return cargo represented only 31% of Tol Laut volumes in 2025, showing the challenge of assembling cargo in the reverse direction.
International services are the faster-growing trade flow, with an 8.94% CAGR projected from 2026 to 2031. International services carry raw materials and capital goods on the import leg as well as processed products on the export leg. This mix requires carriers to manage both regular industrial demand and trade-lane imbalances. The Indonesia full container load (FCL) market can benefit where operators can combine outbound volumes and secure dependable backhaul cargo. That requirement may remain central to private investment decisions on eastern routes.
Dry containers held 82.37% of the Indonesia full container load (FCL) market size in 2025. Java and Sumatra offer stronger reefer yields because they have more developed cold storage and compliant logistics facilities. Pharmaceutical handling is becoming more demanding as service providers meet Good Distribution Practice requirements. These requirements can favor operators with validated handling procedures and equipment.
Refrigerated containers are expected to register at a 9.45% CAGR through 2031, the highest rate among container types. Pharmaceutical distribution, seafood, processed food, and nutrition-program logistics support demand for temperature-controlled capacity. 30% of pharmaceutical shipments still encounter temperature-storage issues during transit. This gap creates demand for more consistent reefer services in eastern corridors. The Indonesia full container load (FCL) market, therefore, has room for specialized capacity even as dry containers remain the principal volume base.
Complete Report Scope:
- By Trade Flow
- Domestic / Inter-Island FCL
- International FCL
- Import Flow
- Export Flow
- By Container Type
- Dry Containers
- Refrigerated Containers
- Tank Containers
- Special Equipment Containers
- By Container Size
- 20-Foot Containers
- 40-Foot Containers
- By End-User Industry
- Manufacturing and Industrial
- Retail and Consumer Goods
- Food and Beverage
- Automotive and Components
- Chemicals and Petrochemicals
- Electronics and Electrical
- Agriculture and Forestry
- Healthcare and Pharmaceuticals
- Other End Users
- By Region
- Java (Jakarta and BOD)
- Sumatra
- Kalimantan
- Sulawesi
- Bali and Nusa Tenggara
- Papua Region and Maluku Islands
List of Companies Covered in this Report:
- Mediterranean Shipping Company (MSC)
- A.P. Moller - Maersk
- CMA CGM
- COSCO SHIPPING Lines
- Ocean Network Express (ONE)
- Hapag-Lloyd
- Evergreen Marine Corporation
- Yang Ming Marine Transport Corporation
- HMM Co., Ltd.
- Pacific International Lines (PIL)
- ZIM Integrated Shipping Services
- Wan Hai Lines
- SITC International Holdings
- X-Press Feeders
- PT Salam Pacific Indonesia Lines (SPIL)
- Meratus Group
- PT TEMAS Tbk
- PT Samudera Indonesia Tbk
- PT Tanto Intim Line
- DHL Global Forwarding
- Kuehne+Nagel International AG
- DSV A/S
Additional Benefits:
- The market estimate (ME) sheet in Excel format
- 3 months of analyst support
TABLE OF CONTENTS
1 INTRODUCTION
- 1.1 Study Assumptions and Market Definition
- 1.2 Scope of the Study
2 RESEARCH METHODOLOGY
3 EXECUTIVE SUMMARY
- 3.1 Market Size, Growth, and Forecast Outlook
- 3.2 Key Demand Drivers and FCL Shipping Trends
- 3.3 Major FCL Gateways and Cargo Concentration
- 3.4 Competitive Landscape and Leading FCL Providers
4 MARKET LANDSCAPE
- 4.1 Market Overview and Importance of Full Container Load Market
- 4.2 Market Drivers
- 4.2.1 Containerization Growth Increasing Domestic and Export FCL Volumes
- 4.2.2 Port Expansion Improving Container Handling Capacity and Efficiency
- 4.2.3 Industrial Investment Increasing Export-Oriented Containerized Cargo Demand
- 4.2.4 Digitalization Improving Port-Hinterland Coordination and Shipment Visibility
- 4.2.5 Sea-Toll Development Strengthening Eastern Indonesia Container Connectivity
- 4.2.6 Reefer Demand Expanding Specialized Container Shipping Requirements
- 4.3 Market Restraints
- 4.3.1 Empty Container Imbalances Increasing Repositioning and Backhaul Costs
- 4.3.2 Port-Hinterland Delays Increasing Overall Container Logistics Costs
- 4.3.3 Regional Infrastructure Gaps Restricting Efficient Container Accessibility
- 4.3.4 Customs and Documentation Complexity Increasing FCL Processing Friction
- 4.4 Value Chain Structure and FCL Cargo Flow Analysis
- 4.5 Regulatory Framework and FCL Shipping Compliance Analysis
- 4.6 Technology Adoption and FCL Digitalization Trend Analysis
- 4.7 Major Port and FCL Gateway Concentration Analysis
- 4.8 FCL Freight Rate and Surcharge Trend Analysis
- 4.9 Shipping Line Network and Service Coverage Analysis
- 4.10 Porter's Five Forces Analysis
- 4.10.1 Threat of New Entrants
- 4.10.2 Bargaining Power of Buyers
- 4.10.3 Bargaining Power of Suppliers
- 4.10.4 Threat of Substitute Services
- 4.10.5 Intensity of Competitive Rivalry
- 4.11 Impact of Geo-Political Events on Supply Chain Shifts
5 MARKET SIZE AND GROWTH FORECASTS
- 5.1 By Trade Flow
- 5.1.1 Domestic / Inter-Island FCL
- 5.1.2 International FCL
- 5.1.2.1 Import Flow
- 5.1.2.2 Export Flow
- 5.2 By Container Type
- 5.2.1 Dry Containers
- 5.2.2 Refrigerated Containers
- 5.2.3 Tank Containers
- 5.2.4 Special Equipment Containers
- 5.3 By Container Size
- 5.3.1 20-Foot Containers
- 5.3.2 40-Foot Containers
- 5.4 By End-User Industry
- 5.4.1 Manufacturing and Industrial
- 5.4.2 Retail and Consumer Goods
- 5.4.3 Food and Beverage
- 5.4.4 Automotive and Components
- 5.4.5 Chemicals and Petrochemicals
- 5.4.6 Electronics and Electrical
- 5.4.7 Agriculture and Forestry
- 5.4.8 Healthcare and Pharmaceuticals
- 5.4.9 Other End Users
- 5.5 By Region
- 5.5.1 Java (Jakarta and BOD)
- 5.5.2 Sumatra
- 5.5.3 Kalimantan
- 5.5.4 Sulawesi
- 5.5.5 Bali and Nusa Tenggara
- 5.5.6 Papua Region and Maluku Islands
6 COMPETITIVE LANDSCAPE
- 6.1 Market Concentration
- 6.2 Strategic Moves
- 6.3 Market Share Analysis
- 6.4 Company Profiles (includes Global Level Overview, Market Level Overview, Core Segments, Financials as available, Strategic Information, Geographic Coverage, Products and Services, Recent Developments)
- 6.4.1 Mediterranean Shipping Company (MSC)
- 6.4.2 A.P. Moller - Maersk
- 6.4.3 CMA CGM
- 6.4.4 COSCO SHIPPING Lines
- 6.4.5 Ocean Network Express (ONE)
- 6.4.6 Hapag-Lloyd
- 6.4.7 Evergreen Marine Corporation
- 6.4.8 Yang Ming Marine Transport Corporation
- 6.4.9 HMM Co., Ltd.
- 6.4.10 Pacific International Lines (PIL)
- 6.4.11 ZIM Integrated Shipping Services
- 6.4.12 Wan Hai Lines
- 6.4.13 SITC International Holdings
- 6.4.14 X-Press Feeders
- 6.4.15 PT Salam Pacific Indonesia Lines (SPIL)
- 6.4.16 Meratus Group
- 6.4.17 PT TEMAS Tbk
- 6.4.18 PT Samudera Indonesia Tbk
- 6.4.19 PT Tanto Intim Line
- 6.4.20 DHL Global Forwarding
- 6.4.21 Kuehne+Nagel International AG
- 6.4.22 DSV A/S
7 MARKET OPPORTUNITIES AND FUTURE OUTLOOK
- 7.1 White-Space Opportunities and Unmet FCL Service Needs
- 7.2 High-Potential End-User Segments and Trade Opportunities
- 7.3 Strategic Growth Priorities Across FCL Shipping Ecosystem
- 7.4 Future Market Outlook and Emerging FCL Demand Pockets
8 APPENDIX

 2026-2030年全球貨運市場
 2026 年至 2034 年貨物運輸市場的規模、市場佔有率、成長、全球產業分析、區域趨勢和預測。
 中國與歐洲之間的滾裝海運:市場佔有率分析、行業趨勢和統計數據以及成長預測(2026-2031年)全球貨物運輸市場規模、佔有率、趨勢和成長分析報告(2026-2034年)
 日本海運市場:規模、佔有率、趨勢和預測:按運輸方式、應用和地區分類,2026-2034年日本電子商務配送市場規模、佔有率、趨勢和預測:按服務、企業運營商、目的地、最終用戶行業和地區分類,2026-2034年貨物運輸市場按貨物類型、最終用戶產業、船舶類型和地區分類(2026 年至 2032 年)