


 |
市場調查報告書
商品編碼
2156921
印尼製造業和物流業:市場佔有率分析、行業趨勢和統計數據以及成長預測(2026-2031 年)Indonesia Manufacturing Logistics - Market Share Analysis, Industry Trends & Statistics, Growth Forecasts (2026 - 2031) |
||||||

※ 本網頁內容可能與最新版本有所差異。詳細情況請與我們聯繫。
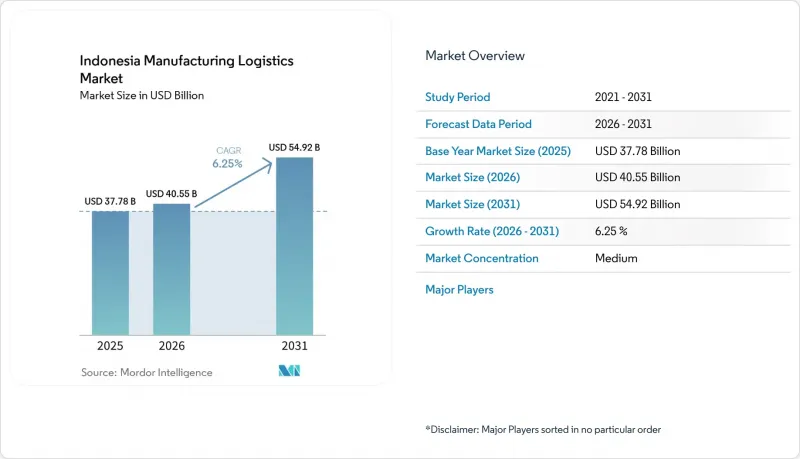
據 Mordor Intelligence 稱,2025 年印尼製造業物流市場價值 377.8 億美元,預計到 2031 年將達到 549.2 億美元,而 2026 年為 405.5 億美元,2026 年至 2031 年的複合年成長率為 6.25%。
印尼製造業物流市場趨勢與洞察
製造業出口與產業走廊擴張
2025年1月至10月,印尼非油氣製造業出口額達1,878億美元,佔國內出口總額的80.3%,較去年同期成長15.8%。 2026年第一季製造業投資金額達182兆印尼幣(約108.6億美元),佔國內投資總額的36.5%。 2025年,經濟特區出口額達44兆印尼幣(約26.3億美元)。氧化鋁、油脂化學品和加工銅等產品需要比一般散裝貨物更專業的處理。 2025年第26號法規自2026年1月起促進經認證的工業園區內的物流整合。這種情況增加了對生產基地附近貨運代理、清關支援和倉儲服務的需求。
國家物流生態系的數位化
截至2024年10月,全國物流生態系已覆蓋46個海港和6個機場,海運量佔97%,空運量佔98%。世界海關組織(WCO)引用的一項研究表明,該系統的實施使清關時間縮短了57.7%,處理成本降低了37.6%。聯合申報系統、追蹤工具和港口閘口使海關、檢疫和過境流程之間的銜接更加可預測。支持該計劃的總統指令已於2025年底到期。政府一直在製定涵蓋互聯互通、服務數位化和人力資源開發等方面的法規。這項監管空白可能會延緩對互通物流系統的投資。
島際基礎設施和轉運的複雜性
空貨櫃的重新分配和較低的返航運轉率導致爪哇島和蘇門答臘島以外地區製造商的往返成本增加。在2025年的評估中,西加里曼丹的基礎設施在全國排名倒數第二。在「海運收費」計畫涵蓋的港口中,僅有58.7%的港口符合基本基礎設施要求,但西行返航運轉率仍低於25%。一項針對印尼東部港口的研究發現,建造更深的乾船塢可將船舶裝載能力提高35%,並將區域物流成本降低22%至28%。此類改善需要長期的公共資金投入和實施。此外,「海運收費」計畫涵蓋的港口在服務要求執行方面存在差異,阻礙了統一營運條件的建立。
細分市場分析
到2025年,貨運將佔印尼製造業物流市場的58.65%。這反映了爪哇島工業走廊內道路運輸的發展趨勢。卡車運輸支撐著該國最大生產區域內工廠到港口的運輸以及省際物流。海運和內河航運連接著島嶼上的製造地。除爪哇島和蘇門答臘島外,鐵路貨運仍有限。政府2025年至2029年的鐵路規劃包括在目前鐵路服務低度開發的島嶼上發展鐵路。空運用於運輸電子設備和藥品等高價值、時效性強的貨物。這些運輸方式為製造商提供了不同的選擇,具體取決於貨物的價值、交付需求和位置。
預計到2031年,倉儲和配送業將以7.50%的複合年成長率成長。製造商正從自建倉儲轉向外包和系統化管理的配送。儘管價值鏈管理和增值物流的規模仍然較小,但全球目的地設備製造商(OEM)的需求日益成長。這些公司需要入庫順序管理、套件組裝和供應商管理庫存(VMI)。 2025年第26號法規強制要求自2026年1月起在經認證的工業區內整合物流。這項要求可能會促進與第三方倉儲供應商的合作。 2025年,凱傲集團在雅加達設立了一家專注於倉儲自動化的子公司。因此,印尼製造業物流業對整合倉儲和處理能力的需求日益成長。
2025年,食品飲料產業佔印尼製造業和物流市場規模的37.39%。該國2.8億人口支撐著遍布群島的廣泛補給需求。 2025年,食品飲料產量增加5.1%,支撐530萬家食品飲料服務企業。生鮮食品的需求推動了頻繁配送和妥善儲存的需求。紡織服裝、木材家具以及橡膠塑膠行業繼續保持適度的貢獻。部分低附加價值紡織品生產正在向中爪哇省轉移,包括梭羅和三寶壟。國內建設活動和出口活動推動了對金屬、加工、機械和設備的需求。
預計2026年至2031年,電子電氣設備產業將以9.56%的複合年成長率成長。全球原始設備製造商(OEM)正在將其生產基地多元化佈局於東南亞。巴淡島經濟特區正受益於此轉變。 DHL Express於2026年初在三寶壟開設了海關口岸,並為電子產品製造商提供巴淡島至新加坡的每日貨運航班。隨著電動車(EV)平台對電池和電力電子元件的謹慎處理,汽車物流也在改變。化學和製藥業對安全且溫控的物流服務需求日益成長。這些需求提升了專業物流合約的價值。
其他好處:
- Excel格式的市場預測(ME)表
- 3個月的分析師支持
目錄
第1章:引言
- 研究假設和市場定義
- 調查範圍
第2章:調查方法
第3章執行摘要
- 印尼製造業物流市場規模及預測
- 製造業物流的關鍵需求與成長趨勢
- 物流需求的主要產業區隔與趨勢
- 競爭格局與策略市場展望
第4章 市場狀況
- 市場概況及製造及物流的重要性
- 市場促進因素
- 製造業出口與產業走廊擴張
- 國內物流生態系的數位化
- 擴大收費公路、港口和機場的通行能力。
- 來自食品、水產品和藥品的冷鏈需求
- 工廠自動化和即時庫存可視性
- 電池、電動車和電子產品供應鏈的在地化
- 市場限制因素
- 島際基礎設施和轉運的複雜性
- 都市區港口擁擠和卡車運輸延誤
- 監管碎片化和數位互通性
- 熟練物流人員及替代燃料基礎設施短缺
- 價值鍊和分銷管道的結構分析
- 法律規範和合規要求概述
- 技術採納與數位化趨勢展望
- 工廠物流與廠內運輸服務分析
- 製造業投資和物流能力擴張的分析
- 對入境和出庫物流流程模式的分析
- 波特五力分析
- 地緣政治事件對供應鏈變化的影響
第5章 市場規模與成長預測
- 按職能分類的物流
- 貨物運輸
- 公路貨運
- 鐵路貨運
- 空運
- 海運和內河航運
- 倉儲/物流
- 供應鏈管理與加值物流
- 貨物運輸
- 透過製造業
- 食品/飲料
- 紡織服裝
- 木材/家具
- 化學品和製藥
- 橡膠和塑膠
- 金屬/加工
- 電子與電機工程
- 機械/設備
- 汽車/運輸設備
- 其他製造業
- 貨物裝卸類別
- 普通貨物
- 溫控貨物
- 危險品貨物
- 高價值貨物/易碎貨物
- 按目的地
- 國內的
- 國際/跨境
- 按地區
- 爪哇島(雅加達和博多)
- 蘇門答臘
- 加里曼丹
- 蘇拉威西
- 峇裡島和努沙登加拉
- 巴布亞地區和摩鹿加群島
第6章 競爭情勢
- 市場集中度
- 策略趨勢
- 市佔率分析
- 公司簡介
- DHL Group
- DSV A/S
- Kuehne+Nagel International AG
- CEVA Logistics
- NX Group/PT NX Lemo Indonesia Logistik
- AP Moller-Maersk
- PT Yusen Logistics Indonesia
- PT Samudera Indonesia Tbk
- APL Logistics
- PT LOGISTEED Indonesia
- PT CJ Logistics Indonesia
- GEODIS
- Meratus Group
- PT Puninar Logistics
- PT Kamadjaja Logistics
- PT Cipta Krida Bahari(CKB Logistics)
- Rhenus Logistics Indonesia
- PT YCH Indonesia
- PT Siba Surya
- PT TEMAS Tbk
- PT BGR Logistik Indonesia
- Kargo Technologies/PT Kargo Online System
第7章 市場機會與未來展望
第8章附錄
According to Mordor Intelligence, the Indonesia manufacturing logistics market size was valued at USD 37.78 billion in 2025 and is estimated to grow from USD 40.55 billion in 2026 to reach USD 54.92 billion by 2031, registering at a CAGR of 6.25% from 2026 to 2031.
Indonesia Manufacturing Logistics Market Trends and Insights
Manufacturing Export and Industrial Corridor Expansion
Indonesia recorded USD 187.8 billion in non-oil and gas manufacturing exports from January through October 2025, equal to 80.3% of national exports and 15.8% higher than the prior year. Manufacturing investment reached IDR 182 trillion (USD 10.86 billion) in the first quarter of 2026, or 36.5% of national investment. Special economic zones recorded IDR 44 trillion (USD 2.63 billion) in exports during 2025. Alumina, oleochemicals, and processed copper require more specialized handling than basic bulk cargo. Regulation No. 26 of 2025 promotes logistics integration within accredited industrial estates from January 2026. These conditions raise demand for freight forwarding, customs support, and warehouse services close to production sites.
National Logistics Ecosystem Digitalization
The National Logistics Ecosystem was deployed at 46 seaports and 6 airports by October 2024, covering 97% of sea cargo and 98% of air cargo volume. A survey cited by the World Customs Organization found that implementation reduced clearance processing time by 57.7% and processing costs by 37.6%. Shared submission systems, tracking tools, and port gates support more predictable handoffs between customs, quarantine, and shipping processes. The presidential instruction supporting the program expired at the end of 2025. The government had prepared a regulation covering connectivity, service digitalization, and workforce development. The regulatory gap may delay investment in interoperable logistics systems.
Inter-Island Infrastructure and Transshipment Complexity
Empty container repositioning and low return-voyage utilization increase round-trip costs for manufacturers outside Java and Sumatra. A 2025 assessment ranked West Kalimantan's physical infrastructure second lowest nationally. While only 58.7% of Sea Toll program ports met basic infrastructure requirements, westbound backhaul utilization remained below 25%. Research on eastern Indonesian ports found that deeper basins could lift vessel carrying capacity by up to 35% and reduce regional logistics costs by 22% to 28%. These upgrades need long-term public funding and execution. Uneven enforcement of service requirements across Sea Toll ports also limits consistent operating conditions.
Other drivers and restraints analyzed in the detailed report include:
- Toll Road, Port, and Airport Capacity Expansion
- Battery, EV, and Electronics Supply-Chain Localization
- Fragmented Regulation and Digital Interoperability
For complete list of drivers and restraints, kindly check the Table Of Contents.
Segment Analysis
Freight transportation held 58.65% of the Indonesia manufacturing logistics market share in 2025. The position reflects road-based movements within Java's industrial corridors. Trucking supports factory-to-port and interstate distribution in the country's largest production areas. Sea and inland waterway freight connects manufacturing centers across the islands. Rail freight remains limited outside Java and Sumatra. The government's 2025 to 2029 rail agenda includes track development on islands without rail service. Air freight serves high-value and time-sensitive electronics and pharmaceutical shipments. These modes give manufacturers different options based on cargo value, delivery needs, and location.
Warehousing and distribution are forecast to grow at a 7.50% CAGR through 2031. Manufacturers are moving from in-house storage toward outsourced and system-managed distribution. Supply Chain Management and Value-Added Logistics is smaller, but it is gaining demand from global original equipment manufacturers. These companies require inbound sequencing, kitting, and vendor-managed inventory. Regulation No. 26 of 2025 requires logistics integration in accredited industrial zones from January 2026. This requirement can encourage third-party warehouse partnerships. KION Group established a direct warehouse automation entity in Jakarta in 2025. The Indonesia manufacturing logistics industry is consequently seeing more demand for integrated storage and handling capabilities.
Food and beverage accounted for 37.39% of the Indonesia manufacturing logistics market size in 2025. A domestic population of 280 million supports broad replenishment needs across the islands. Food and beverage output grew 5.1% in 2025, supporting 5.3 million food and beverage service businesses. Perishable goods increase the need for frequent distribution and suitable storage. Textiles and Apparel, Wood and Furniture, and Rubber and Plastics remain mid-tier contributors. Some lower-value textile production has moved toward Central Java locations, including Solo and Semarang. Metals, Fabrication, Machinery, and Equipment demand depends on domestic construction and export activity.
Electronics and electrical is forecast to expand at a 9.56% CAGR between 2026 and 2031. Global original equipment manufacturers are diversifying production locations in Southeast Asia. Batam's special economic zone has become a beneficiary of this shift. DHL Express established a customs gateway in Semarang in early 2026. It also operates daily cargo services on the Batam to Singapore route for electronics manufacturers. Automotive logistics is also changing as electric-vehicle platforms require careful handling of batteries and power electronics. Chemicals and Pharmaceuticals add demand for secure and temperature-controlled services. These needs raise the value of specialized logistics contracts.
Complete Report Scope:
- By Logistics Function
- Freight Transportation
- Road Freight
- Rail Freight
- Air Freight
- Sea and Inland Waterway Freight
- Warehousing and Distribution
- Supply Chain Management and Value-Added Logistics
- Freight Transportation
- By Manufacturing Industry
- Food and Beverage
- Textiles and Apparel
- Wood and Furniture
- Chemicals and Pharmaceuticals
- Rubber and Plastics
- Metals and Fabrication
- Electronics and Electrical
- Machinery and Equipment
- Automotive and Transportation Equipment
- Other Manufacturing Industries
- By Cargo Handling
- General Cargo
- Temperature-Controlled Cargo
- Hazardous Cargo
- High-Value / Sensitive Cargo
- By Destination
- Domestic
- International / Cross-Border
- By Region
- Java (Jakarta & BOD)
- Sumatra
- Kalimantan
- Sulawesi
- Bali and Nusa Tenggara
- Papua Region and Maluku Islands
List of Companies Covered in this Report:
- DHL Group
- DSV A/S
- Kuehne+Nagel International AG
- CEVA Logistics
- NX Group / PT NX Lemo Indonesia Logistik
- A.P. Moller - Maersk
- PT Yusen Logistics Indonesia
- PT Samudera Indonesia Tbk
- APL Logistics
- PT LOGISTEED Indonesia
- PT CJ Logistics Indonesia
- GEODIS
- Meratus Group
- PT Puninar Logistics
- PT Kamadjaja Logistics
- PT Cipta Krida Bahari (CKB Logistics)
- Rhenus Logistics Indonesia
- PT YCH Indonesia
- PT Siba Surya
- PT TEMAS Tbk
- PT BGR Logistik Indonesia
- Kargo Technologies / PT Kargo Online System
Additional Benefits:
- The market estimate (ME) sheet in Excel format
- 3 months of analyst support
TABLE OF CONTENTS
1 INTRODUCTION
- 1.1 Study Assumptions and Market Definition
- 1.2 Scope of the Study
2 RESEARCH METHODOLOGY
3 EXECUTIVE SUMMARY
- 3.1 Indonesia Manufacturing Logistics Market Size and Forecast
- 3.2 Key Manufacturing Logistics Demand and Growth Trends
- 3.3 Major Industry Segments and Logistics Demand Patterns
- 3.4 Competitive Landscape and Strategic Market Outlook
4 MARKET LANDSCAPE
- 4.1 Market Overview and Importance of Manufacturing Logistics
- 4.2 Market Drivers
- 4.2.1 Manufacturing Export and Industrial Corridor Expansion
- 4.2.2 National Logistics Ecosystem Digitalization
- 4.2.3 Toll-Road, Port, and Airport Capacity Expansion
- 4.2.4 Cold-Chain Demand from Food, Seafood, and Pharmaceuticals
- 4.2.5 Factory Automation and Real-Time Inventory Visibility
- 4.2.6 Battery, EV, and Electronics Supply-Chain Localization
- 4.3 Market Restraints
- 4.3.1 Inter-Island Infrastructure and Transshipment Complexity
- 4.3.2 Port Congestion and Urban Trucking Delays
- 4.3.3 Fragmented Regulation and Digital Interoperability
- 4.3.4 Skilled Logistics Labor and Alternative-Fuel Infrastructure Gaps
- 4.4 Value Chain and Distribution Channel Architecture Analysis
- 4.5 Regulatory Framework and Compliance Requirements Overview
- 4.6 Technology Adoption and Digitalization Trends Outlook
- 4.7 Plant Logistics and In-Factory Handling Service Analysis
- 4.8 Manufacturing Investment and Logistics Capacity Expansion Analysis
- 4.9 Inbound and Outbound Logistics Flow Pattern Analysis
- 4.10 Porter's Five Forces Analysis
- 4.10.1 Threat of New Entrants
- 4.10.2 Bargaining Power of Buyers and Consumers
- 4.10.3 Bargaining Power of Suppliers
- 4.10.4 Threat of Substitute Services
- 4.10.5 Intensity of Competitive Rivalry
- 4.11 Impact of Geo-Political Events on Supply Chain Shifts
5 MARKET SIZE AND GROWTH FORECASTS
- 5.1 By Logistics Function
- 5.1.1 Freight Transportation
- 5.1.1.1 Road Freight
- 5.1.1.2 Rail Freight
- 5.1.1.3 Air Freight
- 5.1.1.4 Sea and Inland Waterway Freight
- 5.1.2 Warehousing and Distribution
- 5.1.3 Supply Chain Management and Value-Added Logistics
- 5.1.1 Freight Transportation
- 5.2 By Manufacturing Industry
- 5.2.1 Food and Beverage
- 5.2.2 Textiles and Apparel
- 5.2.3 Wood and Furniture
- 5.2.4 Chemicals and Pharmaceuticals
- 5.2.5 Rubber and Plastics
- 5.2.6 Metals and Fabrication
- 5.2.7 Electronics and Electrical
- 5.2.8 Machinery and Equipment
- 5.2.9 Automotive and Transportation Equipment
- 5.2.10 Other Manufacturing Industries
- 5.3 By Cargo Handling
- 5.3.1 General Cargo
- 5.3.2 Temperature-Controlled Cargo
- 5.3.3 Hazardous Cargo
- 5.3.4 High-Value / Sensitive Cargo
- 5.4 By Destination
- 5.4.1 Domestic
- 5.4.2 International / Cross-Border
- 5.5 By Region
- 5.5.1 Java (Jakarta & BOD)
- 5.5.2 Sumatra
- 5.5.3 Kalimantan
- 5.5.4 Sulawesi
- 5.5.5 Bali and Nusa Tenggara
- 5.5.6 Papua Region and Maluku Islands
6 COMPETITIVE LANDSCAPE
- 6.1 Market Concentration
- 6.2 Strategic Moves
- 6.3 Market Share Analysis
- 6.4 Company Profiles (includes Global Level Overview, Market Level Overview, Core Segments, Financials as available, Strategic Information, Geographic Coverage, Products and Services, Recent Developments)
- 6.4.1 DHL Group
- 6.4.2 DSV A/S
- 6.4.3 Kuehne+Nagel International AG
- 6.4.4 CEVA Logistics
- 6.4.5 NX Group / PT NX Lemo Indonesia Logistik
- 6.4.6 A.P. Moller - Maersk
- 6.4.7 PT Yusen Logistics Indonesia
- 6.4.8 PT Samudera Indonesia Tbk
- 6.4.9 APL Logistics
- 6.4.10 PT LOGISTEED Indonesia
- 6.4.11 PT CJ Logistics Indonesia
- 6.4.12 GEODIS
- 6.4.13 Meratus Group
- 6.4.14 PT Puninar Logistics
- 6.4.15 PT Kamadjaja Logistics
- 6.4.16 PT Cipta Krida Bahari (CKB Logistics)
- 6.4.17 Rhenus Logistics Indonesia
- 6.4.18 PT YCH Indonesia
- 6.4.19 PT Siba Surya
- 6.4.20 PT TEMAS Tbk
- 6.4.21 PT BGR Logistik Indonesia
- 6.4.22 Kargo Technologies / PT Kargo Online System
7 MARKET OPPORTUNITIES AND FUTURE OUTLOOK
- 7.1 White-Space and Unmet-Need Assessment
- 7.2 Expansion of Inter-Island Manufacturing Fulfillment Networks
- 7.3 Growth in Secure Logistics for High-Value Manufacturing Cargo
- 7.4 Emerging Opportunities in Green and Reverse Logistics Networks
- 7.5 Future Outlook for Manufacturing Logistics Network Expansion
8 APPENDIX

 本地配送網路市場預測至2034年-按服務地點類型、網路模型、服務、技術、位置類型和區域分類的全球分析
 伸縮式整平機市場:全球市場預測,2026-2032年
 2026-2030年全球工業物流市場2026-2030年全球電子商務及物流市場城市物流市場預測至2034年-按服務類型、配送模式、車輛類型、技術、最終用戶和地區分類的全球分析智慧物流市場預測至2034年-按解決方案類型、技術、部署模式、組織規模、最終用戶和地區分類的全球分析
 JIT(即時)物流市場規模、佔有率和成長分析:按服務類型、運輸方式、最終用戶、公司規模、部署和地區分類 - 行業預測,2026-2033 年碼頭邊緣整平機市場:全球市場預測,2026-2032年
 英國預製產品物流:市場佔有率分析、產業趨勢與統計及成長預測(2026-2031)印尼城市物流:市場佔有率分析、產業趨勢與統計、成長預測(2026-2031)