


 |
市場調查報告書
商品編碼
2155661
印尼城市物流:市場佔有率分析、產業趨勢與統計、成長預測(2026-2031)Indonesia Urban Logistics - Market Share Analysis, Industry Trends & Statistics, Growth Forecasts (2026 - 2031) |
||||||

※ 本網頁內容可能與最新版本有所差異。詳細情況請與我們聯繫。
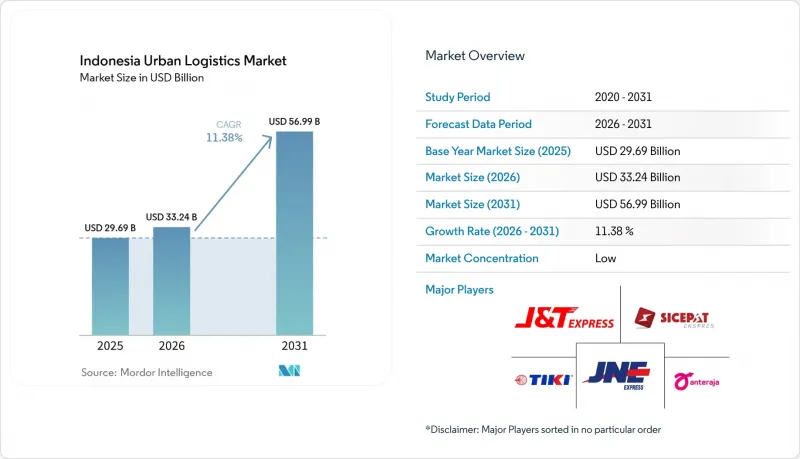
根據 Mordor Intelligence 預測,印尼城市物流市場規模將從 2025 年的 296.9 億美元成長到 2026 年的 332.4 億美元,然後在 2031 年達到 569.9 億美元,2026 年至 2031 年的複合年成長率為 11.38%。
印尼城市物流市場趨勢與洞察
電子商務和社交電商推動小包裹數量成長
預計2025年,印尼電子商務商品交易總額(GMV)將達到710億美元,年增14%。這將使其繼續保持東南亞最大數位消費市場(以GMV計算)的地位。視訊商務是主要的成長要素,預計到2025年,視訊交易量將達到26億筆,年增90%;活躍賣家和網路商店數量增加75%,達到80萬家。這一成長帶動了對高頻次小批量小包裹運輸的需求,包括當日達和即時專遞,以及傳統的標準配送服務。如此龐大的運輸量支撐著都市區經銷商、履約中心和家庭之間的小包裹流通。這種集中的需求使得爪哇島的承運商能夠實現比覆蓋外島的網路更密集的配送路線和更高的資產利用率。因此,印尼的城市物流市場既可以透過擴大現有主要路線上的業務活動,也可以透過逐步擴展到服務不足的都市區,實現成長。
在人口稠密的城市走廊地區,人們對快速交付抱有期望。
都市區消費者越來越希望送貨時間能夠符合他們的日常生活,並優先考慮服務的可靠性。根據 QuickCommerce 的數據,到 2025 年,11 至 30 分鐘內完成的送貨將佔總送貨量的 52.1%。暗店和需求預測系統使雅加達和泗水的企業首次送貨成功率達到了 85%。這些服務模式要求庫存位於高需求區域附近,從而提升了小規模都市區履約中心的重要性。配送網路還必須應對交通狀況的不確定性、駕駛者可用性以及維修成本。那些能夠提高配送路線可靠性的企業,可以比那些僅在「最短送貨時間」上競爭的企業建立更明顯的服務優勢。
都市區堵塞和裝卸空間限制
到2025年,雅加達尖峰時段的平均道路速度將降至11公里/小時,這將限制送貨車輛單次作業可完成的停靠次數。交通堵塞將延長車輛的運作時間,可能需要增加駕駛者或車輛才能完成配送任務。雅加達特區政府已在獨立港碼頭(Tanah Merdeka Terminal)設立了一個佔地5公頃的貨櫃卡車停車場,可容納至少200個貨櫃。此外,為了緩解Cakung Cilingching街的卡車堵塞,政府也宣佈在2026年7月和8月免收停車費。雖然這些措施可能改善區域交通流量,但營運商仍需要製定路線規劃和裝卸貨通道,以應對日常交通中斷。在延誤日益加劇的情況下,擁有高密度設施、路線規劃工具以及確保營運利潤的財務資源的公司將更具優勢。
細分市場分析
在印尼城市物流市場中,運輸服務佔最大佔有率,預計到2025年將佔市場佔有率的67.04%。這是因為日常小包裹運輸能夠帶來廣泛的收入來源。電子商務履約、按需配送和城際貨運都需要定期的運輸活動。即使單次運輸的附加價值服務有限,大量的小包裹也能維持運輸收入。這類服務也仰賴穩定的司機供應、分類能力和路線規劃。隨著經銷商擴大將庫存放置在更靠近都市區買家的位置,履約服務成為成長最快的類別。印尼城市物流市場中履約履行服務的市場規模得益於電商平台和D2C(直接面對消費者)品牌對當日達和隔日達服務的需求。
隨著經銷商將庫存位置向都市區消費者集中,履約服務成為成長最快的類別,預計到2031年將以13.30%的複合年成長率成長。 Blibli的「Gudang Marunda」物流中心透過縮短日常消費品(FMCG)的履約時間70%和降低取消率35%,充分展現了整合庫存和配送管理的營運價值。隨著企業在雅加達大都會圈和周邊城市提升微型倉配能力,倉儲業和都市區儲存業務也不斷擴張。房地產資源的限制促使高需求地區採用多層倉庫模式。逆向物流規模仍然較小,時尚和電子產品的退貨需要更多的檢驗、分類和客戶協調。增值物流服務包括包裝、貼標和品質檢查。這些服務使履約提供者能夠滿足醫療和電子產品客戶對文件和處理的要求。
在印尼城市物流市場,標準配送佔小包裹量最大佔有率,預計到2025年將達到51.28%。這適用於對價格敏感的買家以及無法即時送達的偏遠地區。雖然標準配送服務能夠處理大量貨物,但與更快捷的配送服務相比,單次配送的收入較低。次日達服務為那些希望獲得可靠服務但又不想支付即時送達費用的消費者提供了一個折衷的選擇。準時送達服務也滿足了重視可預測送達時間和訂閱模式的企業的需求。因此,標準配送在印尼都市區物流市場的佔有率主要得益於其廣泛的服務覆蓋範圍和家庭的日常需求。
即時和當日達是配送速度成長最快的類別,預計到2031年將以12.47%的複合年成長率成長,因為都市區對更快履約的需求不斷成長。快速配送網路(QuickCommerce Networks)的即時服務收費可能是標準價格的3到5倍。雅加達、泗水和萬隆擁有足夠的區域履約密度,可以承諾30分鐘內送達。這些服務需要合理的庫存佈局和精準的物流決策。隨著配送中心密度的增加,當日達和隔日達之間的成本差異可能會縮小。這可能會給那些依賴高階次日達服務但缺乏相應區域履約能力的企業帶來壓力。
其他好處:
- Excel格式的市場預測(ME)表
- 3個月的分析師支持
目錄
第1章:引言
- 研究假設和市場定義
- 調查範圍
第2章:調查方法
第3章執行摘要
第4章 市場狀況
- 市場概況及城市物流的重要性
- 市場促進因素
- 電子商務和社交電商推動小包裹數量成長
- 人們期望在人口稠密的城市走廊地區實現更快的配送速度
- 平台整合的履約與配送網路
- 微企業數位商務和隨選物流的成長
- 摩托車電動化所帶來的商機
- 將微型倉配擴展到二線城市
- 市場限制因素
- 都市區交通擁擠與裝卸空間限制
- 群島間服務交付的經濟效率與服務差異
- 充電和電池更換基礎設施不足
- 資金籌措以及車輛電氣化帶來的獲利壓力。
- 產業法規結構
- 價值鍊和分銷管道的結構分析
- 城市物流技術的大趨勢和結構性變化
- 波特五力分析
- 成本結構分析
- 城市基礎設施評估
- 永續性和綠色物流
- 地緣政治事件對供應鏈變化的影響
第5章 市場規模及成長預測(價值,2026-2031 年)
- 按服務類型
- 交通運輸服務
- 倉儲和城市儲存服務
- 履約服務
- 逆向物流服務
- 加值物流(VAL)服務
- 配送速度
- 即時出貨及當日送達
- 隔日送達
- 預定交付
- 標準配送
- 依客戶類型
- 企業對企業 (B2B) 交易
- B2C(企業對消費者)
- 個人對個人(C2C)交易
- 按最終用途行業分類
- 電子商務與零售
- 食品/飲料
- 醫療和藥品
- 家用電子產品
- 時尚與服裝
- 汽車零件
- 工業和製造業
- 其他
- 按城市
- 雅加達
- 萬隆
- 泗水
- 棉蘭
- 塔什克馬拉亞
- 日惹
- 三寶壟
- 登巴薩
- 望加錫
- 其他城市
第6章 競爭情勢
- 關鍵策略趨勢
- 市佔率分析
- 公司簡介
- JNE Express
- SiCepat Ekspres
- TIKI
- AnterAja
- Ninja Van
- Lion Parcel
- Paxel
- Deliveree
- Lalamove
- GoSend
- GrabExpress
- SAPX Express
- RPX Indonesia
- Indah Logistik Cargo
- IDexpress
- DHL Indonesia
- FedEx
- UPS
- SF Express Indonesia
- SPX Express
第7章 市場機會與未來展望
According to Mordor Intelligence, the Indonesia urban logistics market size is expected to grow from USD 29.69 billion in 2025 to USD 33.24 billion in 2026 and is forecast to reach USD 56.99 billion by 2031 at 11.38% CAGR over 2026-2031.
Indonesia Urban Logistics Market Trends and Insights
E-Commerce and Social-Commerce Parcel Growth
Indonesia's e-commerce GMV reached USD 71 billion in 2025, growing 14% year on year, sustaining its position as Southeast Asia's largest digital consumer market by GMV. Video commerce was a major growth driver, with transaction volumes increasing 90% year on year to 2.6 billion in 2025, while active sellers and online shops grew 75% to 800,000. This expansion increased demand for high-frequency, small-batch parcel movements, including same-day and instant deliveries, alongside conventional standard-delivery services. This volume supports regular parcel flows between urban sellers, fulfillment sites, and households. The concentration gives carriers in Java denser routes and stronger asset utilization than networks serving outer islands. The Indonesia urban logistics market, therefore, has room to grow through both higher activity in established corridors and gradual extension to less-served urban locations.
Faster Delivery Expectations in Dense Urban Corridors
Urban buyers increasingly expect delivery windows that fit daily routines and favor dependable service. Quick commerce data showed that deliveries completed within 11 to 30 minutes represented 52.1% of volumes in 2025. Dark stores and demand forecasting systems have helped operators achieve 85% first-attempt delivery success in Jakarta and Surabaya. These service models need inventory close to demand clusters, which raises the importance of small urban fulfillment sites. A delivery network must also manage traffic uncertainty, driver availability, and the cost of maintaining local stock. Operators that improve route reliability can build a clearer service advantage than those that compete only on the shortest stated delivery time.
Urban Congestion and Loading-Space Constraints
Jakarta's peak-hour average road speed fell to 11 km/h in 2025, limiting the number of stops that delivery fleets can complete during a shift. Congestion raises vehicle operating time and can require additional drivers or vehicles to maintain delivery commitments. The DKI Jakarta Provincial Government established a 5-hectare container truck parking facility at Terminal Tanah Merdeka with a capacity for at least 200 containers. It also waived parking fees in July and August 2026 to reduce truck queuing on Jalan Cakung-Cilincing. These steps may improve local flow, but operators still need route planning and loading access that can absorb daily traffic disruption. Higher delays favor businesses that have capital for dense facilities, routing tools, and operational buffers.
Other drivers and restraints analyzed in the detailed report include:
- Platform-Integrated Fulfillment and Delivery Networks
- Growth of MSME Digital Commerce and On-Demand Logistics
- Archipelagic Delivery Economics and Service Variability
For complete list of drivers and restraints, kindly check the Table Of Contents.
Segment Analysis
Transportation services held the largest position in the Indonesian urban logistics market, accounting for 67.04% of the market in 2025, as daily parcel movement creates a broad revenue base. E-commerce fulfillment, on-demand delivery, and intercity cargo all require regular transportation activity. Large parcel counts can sustain transport revenue even when individual shipments have limited value-added services. This service type also depends on consistent driver availability, sorting capacity, and route planning. Fulfillment services represent the fastest-growing category as sellers position inventory closer to urban buyers. The Indonesia urban logistics market size for fulfillment is supported by demand for same-day and next-day service from marketplaces and direct-to-consumer brands.
Fulfillment services represent the fastest-growing category, expanding at a CAGR of 13.30% through 2031 as sellers position inventory closer to urban buyers. Blibli's Gudang Marunda hub reduced FMCG fulfillment time by 70% and cancellation rates by 35%, showing the operating value of integrated inventory and delivery management. Warehousing and urban storage are also expanding as operators add micro-fulfillment capacity in Greater Jakarta and secondary cities. Real estate constraints are encouraging multi-story warehouse formats in high-demand locations. Reverse logistics remains smaller, but fashion and electronics returns require more inspection, sorting, and customer coordination. Value-added logistics services include packaging, labeling, and quality checks. These capabilities can help fulfillment providers meet the documentation and handling requirements of healthcare and electronics customers.
Standard delivery held the largest parcel-volume position in the Indonesia urban logistics market, accounting for 51.28% in 2025. It suits price-sensitive buyers and routes outside the limited areas where instant delivery is practical. Standard services support high shipment counts but earn less per item than faster tiers. Next-day delivery provides a middle option for consumers who want dependable service without the price of an instant option. Scheduled delivery also serves businesses and subscription models that value predictable timing. The Indonesia urban logistics market share of standard delivery is therefore supported by broad coverage and routine household demand.
Instant and same-day delivery is the fastest-growing delivery-speed category, expanding at a CAGR of 12.47% through 2031 as demand increases for faster urban fulfillment. Quick commerce networks can charge 3 to 5 times the standard tariff for immediate service. Jakarta, Surabaya, and Bandung have sufficient local fulfillment density to support sub-30-minute delivery commitments. These services require close inventory placement and accurate dispatch decisions. As hub density increases, the cost gap between same-day and next-day delivery can narrow. This could place pressure on operators that rely on a premium next-day proposition without comparable local fulfillment capacity.
Complete Report Scope:
- By Service Type
- Transportation Services
- Warehousing and Urban Storage Services
- Fulfillment Services
- Reverse Logistics Services
- Value-Added Logistics (VAL) Services
- By Delivery Speed
- Instant and Same-Day Delivery
- Next-Day Delivery
- Scheduled Delivery
- Standard Delivery
- By Customer Type
- Business-to-Business (B2B)
- Business-to-Consumer (B2C)
- Consumer-to-Consumer (C2C)
- By End-Use Industry
- E-commerce and Retail
- Food and Beverage
- Healthcare and Pharmaceuticals
- Consumer Electronics
- Fashion and Apparel
- Automotive Parts
- Industrial and Manufacturing
- Others
- By City
- Jakarta
- Bandung
- Surabaya
- Medan
- Tasikmalaya
- Yogyakarta
- Semarang
- Denpasar
- Makassar
- Rest of Cities
List of Companies Covered in this Report:
- JNE Express
- SiCepat Ekspres
- TIKI
- AnterAja
- Ninja Van
- Lion Parcel
- Paxel
- Deliveree
- Lalamove
- GoSend
- GrabExpress
- SAPX Express
- RPX Indonesia
- Indah Logistik Cargo
- IDexpress
- DHL Indonesia
- FedEx
- UPS
- SF Express Indonesia
- SPX Express
Additional Benefits:
- The market estimate (ME) sheet in Excel format
- 3 months of analyst support
TABLE OF CONTENTS
1 Introduction
- 1.1 Study Assumptions and Market Definition
- 1.2 Scope of the Study
2 Research Methodology
3 Executive Summary
4 Market Landscape
- 4.1 Market Overview and Importance of Urban Logistics
- 4.2 Market Drivers
- 4.2.1 E-commerce and Social-Commerce Parcel Growth
- 4.2.2 Faster Delivery Expectations in Dense Urban Corridors
- 4.2.3 Platform-Integrated Fulfillment and Delivery Networks
- 4.2.4 Growth of MSME Digital Commerce and On-Demand Logistics
- 4.2.5 Motorcycle Fleet Electrification Opportunity
- 4.2.6 Micro-Fulfillment Expansion into Tier-2 Cities
- 4.3 Market Restraints
- 4.3.1 Urban Congestion and Loading-Space Constraints
- 4.3.2 Archipelagic Delivery Economics and Service Variability
- 4.3.3 Insufficient Charging and Battery-Swapping Infrastructure
- 4.3.4 Courier Financing and Income Pressure During Fleet Electrification
- 4.4 Industry Regulatory Framework
- 4.5 Value Chain and Distribution Channel Architecture Analysis
- 4.6 Technology Megatrends and Structural Shifts in Urban Logistics
- 4.7 Porter's Five Forces Analysis
- 4.7.1 Threat of New Entrants
- 4.7.2 Bargaining Power of Suppliers
- 4.7.3 Bargaining Power of Buyers
- 4.7.4 Threat of Substitutes
- 4.7.5 Rivalry Among Competitors
- 4.8 Cost Structure Analysis
- 4.9 Urban Infrastructure Assessment
- 4.10 Sustainability and Green Logistics
- 4.11 Impact of Geo-Political Events on Supply Chain Shifts
5 Market Size & Growth Forecasts (Value, 2026-2031)
- 5.1 By Service Type
- 5.1.1 Transportation Services
- 5.1.2 Warehousing and Urban Storage Services
- 5.1.3 Fulfillment Services
- 5.1.4 Reverse Logistics Services
- 5.1.5 Value-Added Logistics (VAL) Services
- 5.2 By Delivery Speed
- 5.2.1 Instant and Same-Day Delivery
- 5.2.2 Next-Day Delivery
- 5.2.3 Scheduled Delivery
- 5.2.4 Standard Delivery
- 5.3 By Customer Type
- 5.3.1 Business-to-Business (B2B)
- 5.3.2 Business-to-Consumer (B2C)
- 5.3.3 Consumer-to-Consumer (C2C)
- 5.4 By End-Use Industry
- 5.4.1 E-commerce and Retail
- 5.4.2 Food and Beverage
- 5.4.3 Healthcare and Pharmaceuticals
- 5.4.4 Consumer Electronics
- 5.4.5 Fashion and Apparel
- 5.4.6 Automotive Parts
- 5.4.7 Industrial and Manufacturing
- 5.4.8 Others
- 5.5 By City
- 5.5.1 Jakarta
- 5.5.2 Bandung
- 5.5.3 Surabaya
- 5.5.4 Medan
- 5.5.5 Tasikmalaya
- 5.5.6 Yogyakarta
- 5.5.7 Semarang
- 5.5.8 Denpasar
- 5.5.9 Makassar
- 5.5.10 Rest of Cities
6 Competitive Landscape
- 6.1 Key Strategic Moves
- 6.2 Market Share Analysis
- 6.3 Company Profiles (includes Global level Overview, Market level overview, Core Segments, Financials as available, Strategic Information, Geographic/Network Coverage, Products & Services, and Recent Developments)
- 6.3.1 JNE Express
- 6.3.2 SiCepat Ekspres
- 6.3.3 TIKI
- 6.3.4 AnterAja
- 6.3.5 Ninja Van
- 6.3.6 Lion Parcel
- 6.3.7 Paxel
- 6.3.8 Deliveree
- 6.3.9 Lalamove
- 6.3.10 GoSend
- 6.3.11 GrabExpress
- 6.3.12 SAPX Express
- 6.3.13 RPX Indonesia
- 6.3.14 Indah Logistik Cargo
- 6.3.15 IDexpress
- 6.3.16 DHL Indonesia
- 6.3.17 FedEx
- 6.3.18 UPS
- 6.3.19 SF Express Indonesia
- 6.3.20 SPX Express
7 Market Opportunities & Future Outlook
- 7.1 White-space & Unmet-Need Assessment

 本地配送網路市場預測至2034年-按服務地點類型、網路模型、服務、技術、位置類型和區域分類的全球分析
 伸縮式整平機市場:全球市場預測,2026-2032年
 2026-2030年全球工業物流市場2026-2030年全球電子商務及物流市場城市物流市場預測至2034年-按服務類型、配送模式、車輛類型、技術、最終用戶和地區分類的全球分析智慧物流市場預測至2034年-按解決方案類型、技術、部署模式、組織規模、最終用戶和地區分類的全球分析
 JIT(即時)物流市場規模、佔有率和成長分析:按服務類型、運輸方式、最終用戶、公司規模、部署和地區分類 - 行業預測,2026-2033 年碼頭邊緣整平機市場:全球市場預測,2026-2032年
 英國預製產品物流:市場佔有率分析、產業趨勢與統計及成長預測(2026-2031)印尼製造業和物流業:市場佔有率分析、行業趨勢和統計數據以及成長預測(2026-2031 年)