


 |
市場調查報告書
商品編碼
2155287
亞太地區5G服務:市佔率分析、產業趨勢與統計及成長預測(2026-2031年)Asia-Pacific 5G Services - Market Share Analysis, Industry Trends & Statistics, Growth Forecasts (2026 - 2031) |
||||||

※ 本網頁內容可能與最新版本有所差異。詳細情況請與我們聯繫。
根據 Mordor Intelligence 預測,亞太地區的 5G 服務市場規模預計將從 2025 年的 442.7 億美元成長到 2026 年的 590.2 億美元,然後在 2031 年達到 1026.4 億美元,2026 年至 2031 年的複合年成長率為 1.70%。
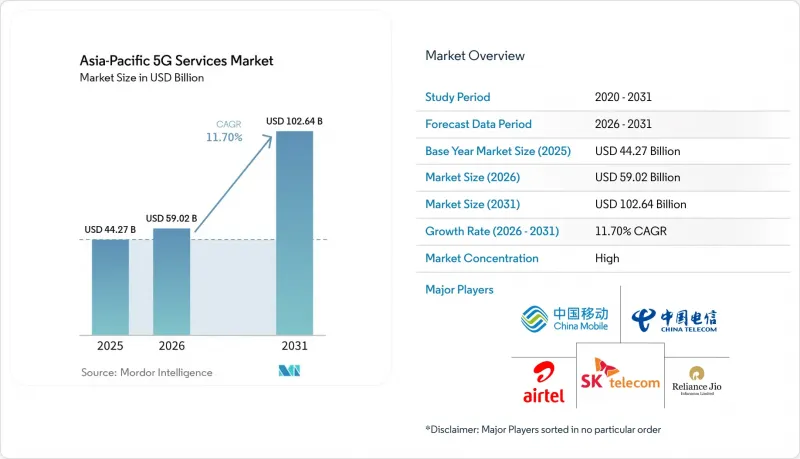
亞太地區 5G 服務市場趨勢及洞察。
行動數據流量的爆炸性成長正在重塑網路容量的經濟格局。
2025年底,5G流量佔全球行動數據流量的48%,高於2024年底的34%。預計到2031年,這一比例將達到85%。在東北亞,2025年每部活躍智慧型手機的月均流量達23GB,預計2031年將達到45GB。在東南亞和大洋洲,2025年每支活躍智慧型手機的月均流量達到21GB,預計2031年將達到40GB。受印度和東北亞地區成長的推動,2026年第一季包括固定無線存取在內的網路流量較去年同期成長22%。由於需求集中在特定時間和地點,營運商需要的是更高密度的容量和更有效率的流量管理,而不是均勻的網路擴展。因此,儘管營運商正在尋求更低成本的方式來滿足尖峰時段需求,但亞太地區的5G服務市場正受益於持續的基礎設施投資。
AI-RAN 和邊緣雲端工作負載將為電信業者帶來新的收入來源。
AI-RAN 可以利用基地台的運算資源來運行 AI 工作負載,從而為電信業者帶來除傳統資料收費之外的額外收入來源。 2025 年 12 月,KT 公司和三星電子在 KT 的商用 5G 網路上展示了 AI-RAN 最佳化,透過用戶級 AI 配置減少了服務中斷。Softbank Corporation於 2026 年將其「AITRAS」平台商業化,使第三方工業邊緣工作負載能夠在基地台 GPU 資源上運作。 2026 年 7 月,韓國科學技術資訊通訊部選定由 SK Telecom 和 KT 牽頭的財團,啟動一項價值 160 億韓元(約 1,140 萬美元)的「超人工智慧網路」試點計畫。 2026年6月,諾基亞與印尼電信公司Indosat O'Orid Hutchison簽署了一項多年協議,旨在對印尼的5G無線網路進行現代化改造並開發AI-RAN服務,計劃於2026年底進行現場測試。這些項目表明,亞太地區的5G服務市場正與企業運算和工業應用日益緊密地連結在一起。
高昂的實施成本和較長的投資回收期限制了提高網路密度的可能性。
高密度5G部署需要整合天線無線電、基頻設備、光纖去程傳輸和軟體,這會增加其七年生命週期內的擁有成本。整合天線無線電佔高密度站點組件成本的45%至55%。由於在計算和人工智慧基礎設施方面的投入增加,中國移動在2025會計年度投資1,509億元人民幣(約208億美元)用於資本支出,並計劃在2026年投資1,366億元人民幣(約188億美元)。從非獨立組網(NSA)核心網過渡到獨立組網(SA)核心網可能會進一步延遲投資回報,因為營運商必須在所有企業功能商用之前進行投資。在韓國,政府已強制要求5G基站在2026年前接入獨立組網核心網設備,並已採取措施降低符合要求的室內5G部署的LTE頻譜重分配費用。亞太地區的 5G 服務市場取決於電信業者能否有效地將合約和投資結合起來,從而認可可靠、低延遲服務的價值。
細分市場分析
2025年,增強型行動寬頻在亞太地區5G服務市佔率中佔比高達62.97%。這一地位反映了中國和印度大規模的用戶群體,5G正被廣泛應用於影片、遊戲、通訊和一般行動數據使用。中國移動報告稱,2025年其5G網路用戶將達6.42億。固定無線存取(FWA)正在將這種以消費者為主導的模式擴展到家庭和中小企業。截至2025年12月,中國及亞太其他地區超過50%的固定無線接入用戶端設備(CPE)出貨量為5G設備。 Jio AirFiber在2026會計年度涵蓋了1,300萬戶家庭,為利用5G容量提供了一個全新的實用寬頻應用場景。超高可靠性、低延遲通訊(URLC)雖然目前規模較小,但在工業控制和安全關鍵型應用中發揮著至關重要的作用。 Indosat 在印尼一家工廠進行的一項案例研究中,觀察到運行控制迴路小於 30 毫秒。
預計到2031年,大規模機器類型通訊(MMC)將以12.18%的複合年成長率成長。這項服務將支援工廠、物流中心和農業領域的大量連網設備。功能精簡的裝置無需智慧型手機等全功能5G裝置的成本與電力消耗,即可支援較簡單的物聯網連線。這使得它們能夠應用於以往僅由傳統低功耗網路支援基本感測器的應用場景。亞太地區5G服務市場中mMTC的規模取決於專用網路和設備生態系統的普及程度。網路切片也至關重要,因為它能夠確保特定企業應用所需的服務特性。與依賴傳統核心系統的營運商相比,採用獨立組網(SA)核心網的營運商在提供這些功能方面仍然更具優勢。 3GPP第17版和第18版定義了RedCap和5G Advanced的關鍵要求,這些要求將作為設備和網路的認證指南。隨著工業部署的擴展,這些標準將有助於減少互通性障礙。
2025年,非獨立組網(NSA)5G在亞太地區5G服務市佔率中佔66.31%。這種架構允許營運商在部署5G無線網路的同時,充分利用其現有的4G核心網路投資。這降低了初始成本,並加速了全部區域消費者服務的早期交付。然而,它無法提供專用網路切片或某些低延遲企業服務所需的所有功能。 2025年第四季,中國5G獨立網路架構的市佔率達到80.9%,而印度為49.2%。 Reliance Jio在全國範圍內採用完全獨立組網架構,這支撐了印度的高市場佔有率。新加坡於2026年完成了獨立組網架構的全國性過渡。這些市場表明,網路架構不僅是一種技術選擇,更成為一種商業性差異化因素。
預計從2026年到2031年,獨立組網(SA)5G將以12.52%的複合年成長率成長。截至2025年,全球5G獨立網路滲透率排名前十的國家中,有六個位於亞太地區。 NTT Docomo和NEC於2026年3月在AWS上推出了日本首個商用5G核心網。該部署利用人工智慧技術實現了核心網路設計和建造的自動化,將建造時間縮短了80%。 SK Telecom、KT Corporation和LG Uplus計劃在2026年12月前推出全國性的獨立網路服務。這些轉型可望提高企業服務等級協定(SLA)的可用性,並促進差異化網路層級的交付。亞太地區的5G服務市場有強烈的動力轉向獨立組網系統,因為這將有助於提供更清晰的服務包。然而,投資負擔仍然很高,尤其是在那些附加功能尚未反映在消費者價格中的地區。
其他好處:
- Excel格式的市場預測(ME)表
- 3個月的分析師支持
目錄
第1章:引言
- 研究假設和市場定義
- 調查範圍
第2章:調查方法
第3章執行摘要
第4章 市場狀況
- 市場概覽
- 市場促進因素
- 行動資料通訊使用量爆炸性成長
- 消費者對高速行動寬頻的需求旺盛
- 企業數位轉型的應用案例
- 政府為解放頻率所做的努力
- 3.5 GHz 頻段的跨境頻率協調和漫遊差異正在催生對在地化的需求。
- AI-RAN 和邊緣雲端工作負載正在推動對優質連接的需求。
- 市場限制因素
- 實施成本高,投資回報期長。
- 新興市場對5G相容設備的普及程度有限。
- 東南亞市場頻率政策片段化
- 高密度5G基地台的電網限制和能源成本
- 宏觀經濟因素對市場的影響
- 產業價值鏈分析
- 監理情勢
- 技術展望
- 波特五力分析
第5章 市場規模與成長預測
- 按服務類型
- 高級行動寬頻
- 超高可靠性、低延遲通訊
- 大規模機器類型通訊
- 固定無線存取
- 透過網路架構
- 非獨立組網 5G
- 獨立組網 5G
- 按頻段
- 低頻段
- 中頻
- 毫米波
- 按最終用戶行業分類
- IT/通訊
- 汽車、旅行和交通
- 製造業、能源和公共產業
- 醫療保健和生命科學
- 銀行、金融服務、保險和監理科技
- 零售、媒體、電子商務
- 政府、國防、教育、公共部門
- 其他終端用戶產業
- 透過使用
- 溝通與協作
- 資產追蹤
- 智慧城市
- 智慧建築
- 自動駕駛汽車和V2X
- 智慧醫療
- 工業4.0
- 智慧公用事業
- 身臨其境型媒體與遊戲
- 公共安全和關鍵任務通訊
- 按地區
- 中國
- 印度
- 日本
- 韓國
- 澳洲和紐西蘭
- 印尼
- 新加坡
- 其他亞太國家
第6章 競爭情勢
- 市場集中度
- 策略趨勢
- 市佔率分析
- 公司簡介
- China Mobile Limited
- China Telecom Corporation Limited
- China Unicom(Hong Kong)Limited
- Reliance Jio Infocomm Limited
- Bharti Airtel Limited
- NTT DOCOMO, INC.
- KDDI Corporation
- SoftBank Corp.
- Rakuten Mobile, Inc.
- SK Telecom Co., Ltd.
- KT Corporation
- LG Uplus Corp.
- Telstra Group Limited
- Singtel Group
- Huawei Technologies Co., Ltd.
- ZTE Corporation
- Telefonaktiebolaget LM Ericsson
- Nokia Corporation
- Samsung Electronics Co., Ltd.
- Qualcomm Incorporated
- Cisco Systems, Inc.
- NEC Corporation
- Fujitsu Limited
第7章 市場機會與未來展望
According to Mordor Intelligence, the Asia-Pacific 5G services market size is expected to grow from USD 44.27 billion in 2025 to USD 59.02 billion in 2026 and is forecast to reach USD 102.64 billion by 2031 at 11.70% CAGR over 2026-2031.
Asia-Pacific 5G Services Market Trends and Insights
Exploding Mobile Data Traffic Reshapes Network Capacity Economics
5G carried 48% of global mobile data traffic at the end of 2025, compared with 34% at the end of 2024, and its share is forecast to reach 85% by 2031. Northeast Asia recorded average monthly traffic of 23 GB per active smartphone in 2025, and usage is forecast to reach 45 GB by 2031. Southeast Asia and Oceania recorded 21 GB per active smartphone in 2025, and usage is forecast to reach 40 GB by 2031. Network traffic, including fixed wireless access, increased 22% year over year in Q1 2026, led by India and Northeast Asia. Demand is concentrated at certain hours and locations, so operators need denser capacity and better traffic management rather than uniform network expansion. The Asia-Pacific 5G services market therefore benefits from sustained infrastructure spending, even as operators seek lower-cost ways to handle peak demand.
AI-RAN and Edge-Cloud Workloads Drive a New Revenue Layer for Operators
AI-RAN can use base-station computing resources for AI workloads and may give operators a revenue source beyond traditional data pricing. KT Corporation and Samsung Electronics validated AI-RAN optimization on KT's commercial 5G network in December 2025, using user-level AI configurations to reduce service disruption. SoftBank made its AITRAS platform commercially available in 2026, enabling third-party industrial edge workloads on GPU resources at base stations. South Korea's Ministry of Science and ICT selected SK Telecom and KT-led consortia for a KRW 16 billion, USD 11.4 million, Hyper AI Network pilot in July 2026. Nokia and Indosat Ooredoo Hutchison signed a multiyear agreement in June 2026 to modernize Indonesia's 5G radio network and develop AI-RAN services, with field trials planned by the end of 2026. These projects show that the Asia-Pacific 5G services market is increasingly linked to enterprise computing and industrial applications.
High Deployment Costs and Long Return Horizons Constrain Network Densification
Dense 5G deployments require antenna-integrated radios, baseband equipment, optical fronthaul, and software, which can extend ownership costs across a 7-year life cycle. Antenna-integrated radios account for 45-55% of a dense site's bill of materials. China Mobile spent RMB 150.9 billion, USD 20.8 billion, on capital expenditure in FY2025 and plans RMB 136.6 billion, USD 18.8 billion, in 2026 as it directs more spending toward computing and AI infrastructure. The transition from Non-Standalone to Standalone cores can further delay returns because operators must invest before all enterprise features become commercially available. South Korea required 5G base stations to connect to Standalone core equipment by 2026 and offered lower LTE spectrum reallocation fees for qualifying indoor 5G deployments. The Asia-Pacific 5G services market will depend on operators matching investments with contracts that recognize the value of reliable, low-latency service.
Other drivers and restraints analyzed in the detailed report include:
- High Consumer Demand for Enhanced Mobile Broadband Strains Legacy ARPU Models
- Enterprise Digital Transformation Use Cases Accelerate B2B Revenue Diversification
- Limited 5G Device Readiness Delays Revenue Ramp in Emerging Markets
For complete list of drivers and restraints, kindly check the Table Of Contents.
Segment Analysis
Enhanced mobile broadband held 62.97% of the Asia-Pacific 5G services market share in 2025. Its position reflects a large consumer subscriber base in China and India, where 5G is used for video, gaming, communications, and general mobile data. China Mobile reported 642 million 5G network customers in 2025. Fixed wireless access is extending this consumer-led model into homes and small businesses. More than 50% of fixed wireless access customer-premises equipment shipments in China and the rest of Asia-Pacific were 5G devices in December 2025. Jio AirFiber reached 13 million homes in FY26, adding a practical broadband use case for 5G capacity. Ultra-reliable low-latency communications remain smaller but are relevant for industrial control and safety-critical uses. Indosat's Indonesian factory deployments documented operational control loops below 30 milliseconds.
Massive machine-type communications is projected to expand at a 12.18% CAGR through 2031. The service supports large numbers of connected devices in factories, logistics sites, and agricultural operations. Reduced Capability devices can support lower-complexity IoT connections without the cost or power needs of full smartphone-class 5G devices. This makes them relevant where legacy low-power networks have served basic sensors. The Asia-Pacific 5G services market size for mMTC will depend on wider adoption of private networks and device ecosystems. Network slicing is also important because it can reserve service characteristics for a specific enterprise application. Operators using Standalone cores are better placed to offer these features than operators still dependent on legacy core systems. 3GPP Release 17 and Release 18 define key RedCap and 5G Advanced requirements that guide device and network certification. These standards can reduce interoperability barriers as industrial deployments scale.
Non-Standalone 5G held 66.31% of the Asia-Pacific 5G services market share in 2025. The architecture lets operators use existing 4G core investments while deploying 5G radio coverage. This reduced the initial cost and sped early consumer launches across the region. However, it does not provide all the capabilities needed for dedicated network slices and some low-latency enterprise services. China recorded an 80.9% 5G Standalone sample share in Q4 2025, while India recorded a 49.2% share. Reliance Jio's nationwide architecture is fully Standalone, supporting India's higher result. Singapore completed its nationwide Standalone transition in 2026. These markets show how architecture is becoming a commercial differentiator rather than only a technical choice.
Standalone 5G is projected to expand at a 12.52% CAGR from 2026 to 2031. Six of the world's top 10 countries by 5G Standalone reach were in Asia-Pacific in 2025. NTT DOCOMO and NEC launched Japan's first commercial 5G core network on AWS in March 2026. The deployment used AI to automate core-network design and construction, reducing construction time by 80%. SK Telecom, KT Corporation, and LG Uplus aim to launch nationwide Standalone services by December 2026. Their migration may improve the availability of enterprise service-level agreements and differentiated network tiers. The Asia-Pacific 5G services market has a strong incentive to move toward Standalone systems because they enable more distinct service packages. The investment burden remains significant, particularly where consumer pricing has not yet reflected the added capability.
Complete Report Scope:
- By Service Type
- Enhanced Mobile Broadband
- Ultra-Reliable Low-Latency Communications
- Massive Machine-Type Communications
- Fixed Wireless Access
- By Network Architecture
- Non-Standalone 5G
- Standalone 5G
- By Frequency Band
- Low Band
- Mid Band
- Millimeter-Wave
- By End-User Industry
- IT and Telecom
- Automotive, Mobility and Transportation
- Manufacturing, Energy and Utilities
- Healthcare and Life Sciences
- Banking, Financial Services, Insurance and RegTech
- Retail, Media and E-Commerce
- Government, Defense, Education and Public Sector
- Other End-User Industries
- By Application
- Communication and Collaboration
- Asset Tracking
- Smart Cities
- Smart Buildings
- Autonomous Vehicles and Vehicle-to-Everything
- Smart Healthcare
- Industry 4.0
- Smart Utilities
- Immersive Media and Gaming
- Public Safety and Mission-Critical Communications
- By Geography
- China
- India
- Japan
- South Korea
- Australia and New Zealand
- Indonesia
- Singapore
- Rest of Asia-Pacific
List of Companies Covered in this Report:
- China Mobile Limited
- China Telecom Corporation Limited
- China Unicom (Hong Kong) Limited
- Reliance Jio Infocomm Limited
- Bharti Airtel Limited
- NTT DOCOMO, INC.
- KDDI Corporation
- SoftBank Corp.
- Rakuten Mobile, Inc.
- SK Telecom Co., Ltd.
- KT Corporation
- LG Uplus Corp.
- Telstra Group Limited
- Singtel Group
- Huawei Technologies Co., Ltd.
- ZTE Corporation
- Telefonaktiebolaget LM Ericsson
- Nokia Corporation
- Samsung Electronics Co., Ltd.
- Qualcomm Incorporated
- Cisco Systems, Inc.
- NEC Corporation
- Fujitsu Limited
Additional Benefits:
- The market estimate (ME) sheet in Excel format
- 3 months of analyst support
TABLE OF CONTENTS
1 INTRODUCTION
- 1.1 Study Assumptions and Market Definition
- 1.2 Scope of the Study
2 RESEARCH METHODOLOGY
3 EXECUTIVE SUMMARY
4 MARKET LANDSCAPE
- 4.1 Market Overview
- 4.2 Market Drivers
- 4.2.1 Exploding Mobile Data Traffic
- 4.2.2 High Consumer Demand for Enhanced Mobile Broadband
- 4.2.3 Enterprise Digital-Transformation Use Cases
- 4.2.4 Government Spectrum-Release Initiatives
- 4.2.5 Cross-Border 3.5 GHz Harmonization and Roaming Gaps Creating Localization Demand
- 4.2.6 AI-RAN and Edge-Cloud Workloads Increasing Premium Connectivity Demand
- 4.3 Market Restraints
- 4.3.1 High Deployment Costs and Long ROI Horizons
- 4.3.2 Limited 5G Device Readiness in Emerging Markets
- 4.3.3 Fragmented Spectrum Policy Across Southeast Asian Markets
- 4.3.4 Power-Grid Constraints and Energy Costs for Dense 5G Sites
- 4.4 Impact of Macroeconomic Factors on the Market
- 4.5 Industry Value Chain Analysis
- 4.6 Regulatory Landscape
- 4.7 Technological Outlook
- 4.8 Porter's Five Forces Analysis
- 4.8.1 Threat of New Entrants
- 4.8.2 Bargaining Power of Buyers
- 4.8.3 Bargaining Power of Suppliers
- 4.8.4 Threat of Substitutes
- 4.8.5 Intensity of Competitive Rivalry
5 MARKET SIZE AND GROWTH FORECASTS (VALUE)
- 5.1 By Service Type
- 5.1.1 Enhanced Mobile Broadband
- 5.1.2 Ultra-Reliable Low-Latency Communications
- 5.1.3 Massive Machine-Type Communications
- 5.1.4 Fixed Wireless Access
- 5.2 By Network Architecture
- 5.2.1 Non-Standalone 5G
- 5.2.2 Standalone 5G
- 5.3 By Frequency Band
- 5.3.1 Low Band
- 5.3.2 Mid Band
- 5.3.3 Millimeter-Wave
- 5.4 By End-User Industry
- 5.4.1 IT and Telecom
- 5.4.2 Automotive, Mobility and Transportation
- 5.4.3 Manufacturing, Energy and Utilities
- 5.4.4 Healthcare and Life Sciences
- 5.4.5 Banking, Financial Services, Insurance and RegTech
- 5.4.6 Retail, Media and E-Commerce
- 5.4.7 Government, Defense, Education and Public Sector
- 5.4.8 Other End-User Industries
- 5.5 By Application
- 5.5.1 Communication and Collaboration
- 5.5.2 Asset Tracking
- 5.5.3 Smart Cities
- 5.5.4 Smart Buildings
- 5.5.5 Autonomous Vehicles and Vehicle-to-Everything
- 5.5.6 Smart Healthcare
- 5.5.7 Industry 4.0
- 5.5.8 Smart Utilities
- 5.5.9 Immersive Media and Gaming
- 5.5.10 Public Safety and Mission-Critical Communications
- 5.6 By Geography
- 5.6.1 China
- 5.6.2 India
- 5.6.3 Japan
- 5.6.4 South Korea
- 5.6.5 Australia and New Zealand
- 5.6.6 Indonesia
- 5.6.7 Singapore
- 5.6.8 Rest of Asia-Pacific
6 COMPETITIVE LANDSCAPE
- 6.1 Market Concentration
- 6.2 Strategic Moves
- 6.3 Market Share Analysis
- 6.4 Company Profiles (includes Global Level Overview, Market Level Overview, Core Segments, Financials as available, Strategic Information, Market Rank/Share, Products and Services, Recent Developments)
- 6.4.1 China Mobile Limited
- 6.4.2 China Telecom Corporation Limited
- 6.4.3 China Unicom (Hong Kong) Limited
- 6.4.4 Reliance Jio Infocomm Limited
- 6.4.5 Bharti Airtel Limited
- 6.4.6 NTT DOCOMO, INC.
- 6.4.7 KDDI Corporation
- 6.4.8 SoftBank Corp.
- 6.4.9 Rakuten Mobile, Inc.
- 6.4.10 SK Telecom Co., Ltd.
- 6.4.11 KT Corporation
- 6.4.12 LG Uplus Corp.
- 6.4.13 Telstra Group Limited
- 6.4.14 Singtel Group
- 6.4.15 Huawei Technologies Co., Ltd.
- 6.4.16 ZTE Corporation
- 6.4.17 Telefonaktiebolaget LM Ericsson
- 6.4.18 Nokia Corporation
- 6.4.19 Samsung Electronics Co., Ltd.
- 6.4.20 Qualcomm Incorporated
- 6.4.21 Cisco Systems, Inc.
- 6.4.22 NEC Corporation
- 6.4.23 Fujitsu Limited
7 MARKET OPPORTUNITIES AND FUTURE OUTLOOK
- 7.1 White-Space and Unmet-Need Assessment

 中東地區 5G 服務:市場佔有率分析、產業趨勢與統計及成長預測(2026-2031 年)5G服務:市場佔有率分析、產業趨勢與統計、成長預測(2026-2031年)
 5G服務市場規模、佔有率和趨勢分析報告:按通訊類型、行業和細分市場分類的預測(2026-2033年)
 2026-2030年全球5G服務市場
 2026年全球5G服務市場報告
 5G服務市場分析及預測(至2035年):依類型、產品類型、服務、技術、組件、應用、部署類型、最終用戶及功能分類
 2026-2034年全球5G服務市場規模、佔有率、趨勢和成長分析報告
 5G服務市場-全球產業規模、佔有率、趨勢、機會及預測(依通訊類型、產業垂直領域、最終用途、地區及競爭格局分類,2021-2031年)
 5G服務市場:產業趨勢·全球預測 (~2035年):服務類型·通訊類型·技術·用途·終端用戶·企業規模·各地區
 5G 服務市場規模、佔有率及成長分析(按通訊類型、企業、應用、最終用戶和地區)- 產業預測(2025 年至 2032 年)