


 |
市場調查報告書
商品編碼
2123281
5G服務:市場佔有率分析、產業趨勢與統計、成長預測(2026-2031年)5G Services - Market Share Analysis, Industry Trends & Statistics, Growth Forecasts (2026 - 2031) |
||||||

※ 本網頁內容可能與最新版本有所差異。詳細情況請與我們聯繫。
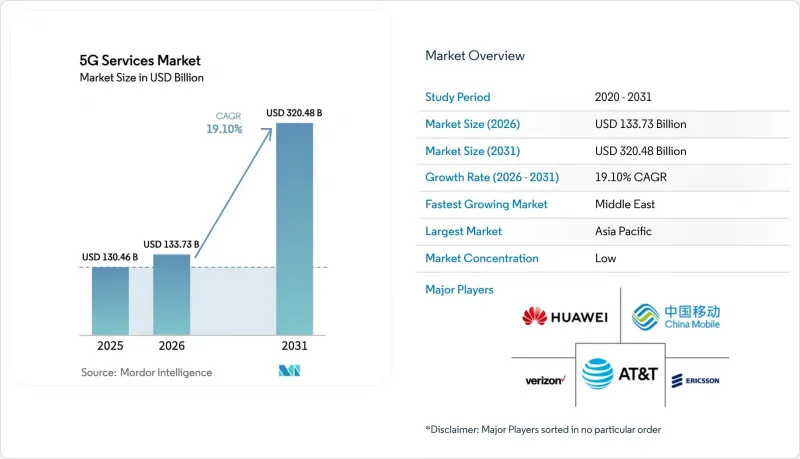
預計 5G 服務市場將從 2025 年的 1304.6 億美元成長到 2026 年的 1337.3 億美元,到 2031 年達到 3204.8 億美元,2026 年至 2031 年的複合年成長率預計為 19.1%。
本報告按服務類型(例如,高級行動寬頻、超高可靠性和低延遲通訊)、網路架構(非獨立組網 5G 和獨立組網 5G)、頻段(低頻寬、中頻寬、毫米波)、終端用戶行業(例如,IT 和電信、媒體和娛樂、汽車和旅行)以及地區進行細分。市場預測以美元計價。
全球5G服務市場趨勢及洞察
行動數據流量爆炸性成長
預計每月流量將從2025年的141Exabyte成長到2031年的約400Exabyte,這將加重郊區宏網路的負擔,並導致中頻段小區拆分的增加。在北美,固定無線網路的容量逐年翻番,部分容量正從行動通訊頻道重新分配,同時毫米波小型基地台的經濟效益也正在得到驗證。超高清影片目前佔下行鏈路流量的72%,而雲端遊戲則產生了突發的上行鏈路峰值,需要動態頻譜共享。始終線上穿戴式設備和車用通訊系統正在使會話模式多樣化,迫使營運商實施人工智慧驅動的流量控制,以即使在擁塞情況下也能維持用戶體驗品質(QoE)。
消費者對eMBB服務的需求很高
無限Gigabit套餐佔5G總收入的52.84%,美國營運商報告稱,由於用戶套餐升級,平均每位用戶的收入增加了4.20美元。韓國業者透過捆綁雲端儲存和串流服務,在六個月內將高階套餐的採用率提升至38%以上。智慧型手機上的8K影片導致網路流量出現對稱性激增,迫使營運商聚合上行鏈路並投資建造更多頻段。業者正透過免利息分期付款計畫鼓勵用戶更換設備,從而縮短設備更換週期,並將用戶留在費率方案中,以增加收入。
實施成本高,投資回報期長。
預計2024年至2027年間,全球獨立核心網路、高密度中頻段網路和回程傳輸的升級將推動支出超過1,500億美元,投資回收期為7至9年。一家美國電信業者透露,需要額外180億美元的資本支出才能提高C頻段的覆蓋密度。同時,在沒有光纖基礎設施的農村地區,每個基地台的建設成本高達25萬美元,加劇了數位落差。由於電力價格比4G高出30%至40%,電信業者面臨簽署可再生能源供應合約的壓力,以履行碳排放承諾並控制營運成本。融資限制正在減緩成本敏感地區向獨立網路的轉型。
細分市場分析
預計到2025年,「增強型行動寬頻」將佔總營收的52.84%,反映出市場對Gigabit級消費級套餐和郊區固定無線鏈路的需求。同時,「大規模機器類型通訊(MMC)」到2031年將以19.21%的年均成長率成長,顯示市場正朝著電池效率更高的感測器方向發展,這些感測器將滲透到製造業、公共產業和智慧城市網路中。隨著營運商重新分配保護頻段和傳統2G頻段用於低功耗疊加通訊,面向窄帶物聯網終端的5G服務市場規模正在擴大。這將使每個模組能夠支援每個小區5萬個設備,而單價低於5美元。
URLLC目前仍處於小眾領域,僅限於V2X(車聯網)試點計畫和等待建立問責機制的遠端操控機器人。然而,到2028年,Release 18調度和邊緣運算的整合將模糊服務類型之間的界線。電信業者將mMTC切片與分析平台捆綁銷售,正在創造穩定的企業收入,並推動5G服務市場的長期成長。
到2025年,非獨立組網(NSA)部署將佔據63.72%的市場佔有率,這得益於LTE核心網縮短產品上市時間的能力。然而,獨立組網(SA)網路以19.53%的成長率持續成長,是網路切片、確定性延遲和新空口語音(VoNR)服務不可或缺的前提條件。美國一家業者在全國部署SA網路後,呼叫建立時間縮短了35%。隨著企業客戶要求提供NSA網路無法保證的專用服務等級協定(SLA),5G服務的市場佔有率正在加速轉移。
儘管資本支出 (Capex) 障礙仍然存在,但營運商透過資料中心整合和雲端原生自動化逐步淘汰傳統封包核心網路,從而降低了營運成本 (OpEx)。 NSA 模式在新興市場可能還會持續更長時間,但那些沒有 LTE 負面歷史包袱的新參與企業正直接轉向雲端原生 SA 模式,從而推動 5G 服務市場在服務欠缺地區的擴張。
區域分析
亞太地區預計在2025年佔總營收的40.92%,這主要得益於中國擁有400萬個站點的中等頻寬網路以及印度兩大電信業者快速擴張的都市區覆蓋範圍。中國移動將於2025年下半年在300個城市推出「5G-Advanced」服務,並捆綁10Gbps高級套餐和遊戲通行證。在日本,開放式無線接取網路(Open RAN)的引進使本地基地台成本降低了28%,而韓國則擁有全球領先的5G普及率,高達72%。
中東是成長最快的地區,年複合成長率高達20.01%。阿拉伯聯合大公國電信營運商的目標是到2025年中期覆蓋95%的人口,並支援智慧城市試點項目,引入自動駕駛班車和人工智慧交通控制系統。沙烏地阿拉伯電信業者已在主要都會區為石油、物流和醫療保健等產業部署了獨立核心網,以配合其「2030願景」目標。同時,土耳其已在其三大城市推出5G服務,旨在與固定無線網路競爭。
在北美和歐洲,用戶主導成長正在放緩,但重點正轉向拓展企業和固定無線服務。到2025年12月,美國一家營運商的C頻段網路將覆蓋2.3億人口,並從400萬條固定無線線路中獲得收入。德國電信的跨國網路切片服務使其企業營收年增了14%。由於頻率競標延遲、終端價格差異和回程傳輸短缺,南美和非洲的發展相對滯後,但巴西和南非的選擇性部署正在幫助現有行動電話營運商應對光纖網路的轉型。
其他好處:
- Excel格式的市場預測(ME)表
- 3個月的分析師支持
目錄
第1章:引言
- 研究假設和市場定義
- 調查範圍
第2章:調查方法
第3章執行摘要
第4章 市場狀況
- 市場概覽
- 市場促進因素
- 行動數據流量的爆炸性成長
- 消費者對eMBB服務的需求很高
- 企業數位轉型的應用案例
- 政府為解放頻率所做的努力
- CBRS和區域授權頻寬中私有5G的部署現狀
- 透過網路切片和 SLA 分級實現盈利
- 市場限制因素
- 實施成本高,投資回報期長。
- 碎片化且過時的頻率政策
- 新興市場對5G相容設備的普及程度有限。
- 地緣政治因素導致的供應商限制和貿易禁令
- 價值鏈分析
- 監理情勢
- 技術展望
- 波特五力模型
第5章 市場規模與成長預測
- 按服務類型
- 高級行動寬頻(eMBB)
- 超高可靠性、低延遲通訊(URLLC)
- 大規模機器通訊(mMTC)
- 透過網路架構
- 非獨立組網(NSA)5G
- 獨立組網(SA)5G
- 按頻段
- 低頻段(低於 1 GHz)
- 中頻段(1–6 GHz)
- 毫米波(24 GHz 以上)
- 按最終用戶行業分類
- 資訊科技/通訊
- 媒體與娛樂
- 汽車與出行
- 能源公用事業
- 航太/國防
- 製造業
- 衛生保健
- 其他終端用戶產業
- 按地區
- 北美洲
- 美國
- 加拿大
- 墨西哥
- 南美洲
- 巴西
- 阿根廷
- 其他南美國家
- 歐洲
- 德國
- 英國
- 法國
- 義大利
- 俄羅斯
- 其他歐洲國家
- 亞太地區
- 中國
- 印度
- 日本
- 韓國
- 其他亞太國家
- 中東
- 沙烏地阿拉伯
- 阿拉伯聯合大公國
- 土耳其
- 其他中東國家
- 非洲
- 南非
- 奈及利亞
- 其他非洲國家
- 北美洲
第6章 競爭情勢
- 市場集中度
- 策略趨勢
- 市佔率分析
- 公司簡介
- China Mobile Ltd.
- Verizon Communications Inc.
- AT&T Inc.
- T-Mobile US Inc.
- China Telecom Corp. Ltd.
- Telefonaktiebolaget LM Ericsson
- Nokia Corp.
- Huawei Technologies Co. Ltd.
- Deutsche Telekom AG
- Vodafone Group Plc
- Orange SA
- Telefonica SA
- BT Group plc
- Swisscom AG
- Telstra Corp. Ltd.
- SK Telecom Co. Ltd.
- KT Corp.
- Rakuten Mobile Inc.
- Reliance Jio Infocomm Ltd.
- Qualcomm Inc.
- Samsung Electronics Co. Ltd.
- ZTE Corp.
- NTT Docomo Inc.
- Bharti Airtel Ltd.
第7章 市場機會與未來展望
According to Mordor Intelligence, the 5G services market size is expected to increase from USD 130.46 billion in 2025 to USD 133.73 billion in 2026 and reach USD 320.48 billion by 2031, growing at a CAGR of 19.1% over 2026-2031.
This report is Segmented by Service Type (Enhanced Mobile Broadband, Ultra-Reliable Low-Latency Comms, and More), Network Architecture (Non-Standalone 5G and Standalone 5G), Frequency Band (Low-Band, Mid-Band, and Millimetre-Wave), End-User Industry (IT and Telecom, Media and Entertainment, Automotive and Mobility, and More), and Geography. The Market Forecasts are Provided in Terms of Value (USD).
Global 5G Services Market Trends and Insights
Exploding Mobile Data Traffic
Monthly traffic rose from 141 exabytes in 2025 to an estimated 400 exabytes by 2031, straining suburban macro layers and triggering extra mid-band cell splits. Fixed-wireless lines doubled year-on-year in North America, diverting capacity from mobility channels and validating the economics of millimeter-wave small cells. Ultra-HD video now represents 72% of downlink volumes, while cloud gaming introduces bursty uplink peaks that require dynamic spectrum sharing. Always-connected wearables and automotive telematics diversify session profiles, pushing carriers toward AI-driven traffic steering that sustains quality of experience during congestion events.
High Consumer Demand for eMBB Services
Unlimited gigabit plans account for 52.84% of total 5G revenue, and U.S. operators report average revenue per user uplifts of USD 4.20 from plan migration. South Korean carriers bundled cloud storage and streaming perks, boosting premium-tier adoption to more than 38% within 6 months. Smartphone-based 8K capture creates symmetrical traffic bursts, forcing investment in uplink carrier aggregation and supplemental spectrum blocks. Operators monetize handset upgrades through zero-interest financing that shortens replacement cycles and locks subscribers into higher-margin tiers.
High Deployment Cost and Long ROI Horizons
Standalone cores, dense mid-band grids, and upgraded backhaul exceed USD 150 billion in global outlays over 2024-2027, stretching payback to 7-9 years. A U.S. carrier revealed USD 18 billion incremental capex for C-band densification, while rural sites without fiber need USD 250,000 each, widening digital divides. Energy bills rise 30-40% versus 4G, pushing operators to sign renewable power agreements to satisfy carbon pledges and control opex. Capital pressure delays stand-alone migration in cost-sensitive regions.
Other drivers and restraints analyzed in the detailed report include:
- Enterprise Digital-Transformation Use Cases
- Government Spectrum-Release Initiatives
- Fragmented and Delayed Spectrum Policy
For complete list of drivers and restraints, kindly check the Table Of Contents.
Segment Analysis
Enhanced Mobile Broadband accounted for 52.84% of 2025 revenue, reflecting demand for gigabit-rate consumer packages and suburban fixed-wireless links. Massive Machine-Type Communications, however, is expanding at 19.21% through 2031, signaling a pivot toward battery-efficient sensors that flood manufacturing, utilities, and smart-city grids. The 5G services market size for narrowband IoT endpoints is rising as operators refarm guard bands and legacy 2G spectrum for low-power overlays, enabling support for 50,000 devices per cell at module prices below 5 USD.
URLLC remains niche, limited to vehicle-to-everything pilots and remote control robotics awaiting mature liability frameworks. Still, by 2028, Release 18 scheduling and edge-compute convergence will blur the lines between service types. Operators bundling mMTC slices with analytics platforms generate sticky enterprise revenue, bolstering long-term growth of the 5G services market.
Non-Standalone deployments held 63.72% share in 2025 because LTE cores enabled quick time-to-market. Yet Standalone networks, growing at 19.53%, are a prerequisite for slicing, deterministic latency, and voice-over-new-radio services. A U.S. carrier trimmed call set-up times 35% after national SA activation. The 5G services market share shift accelerates as enterprise clients demand dedicated SLAs that NSA cannot guarantee.
Capex hurdles remain, but operators retiring legacy packet cores realize opex savings from data-center consolidation and cloud-native automation. Emerging markets may retain NSA longer, yet greenfield entrants without LTE baggage leapfrog straight to cloud-native SA, expanding the 5G services market footprint in underserved geographies.
Complete Report Scope:
- By Service Type
- Enhanced Mobile Broadband (eMBB)
- Ultra-Reliable Low-Latency Comms (URLLC)
- Massive Machine-Type Comms (mMTC)
- By Network Architecture
- Non-Standalone (NSA) 5G
- Standalone (SA) 5G
- By Frequency Band
- Low-Band (Less than 1 GHz)
- Mid-Band (1- 6 GHz)
- Millimetre-Wave (Greater than 24 GHz)
- By End-User Industry
- IT and Telecom
- Media and Entertainment
- Automotive and Mobility
- Energy and Utilities
- Aerospace and Defense
- Manufacturing
- Healthcare
- Other End-User Industries
- By Geography
- North America
- United States
- Canada
- Mexico
- South America
- Brazil
- Argentina
- Rest of South America
- Europe
- Germany
- United Kingdom
- France
- Italy
- Russia
- Rest of Europe
- Asia Pacific
- China
- India
- Japan
- South Korea
- Rest of Asia Pacific
- Middle East
- Saudi Arabia
- United Arab Emirates
- Turkey
- Rest of Middle East
- Africa
- South Africa
- Nigeria
- Rest of Africa
- North America
Geography Analysis
Asia Pacific supplied 40.92% of 2025 revenue, anchored by China's four-million-site mid-band footprint and India's rapid urban coverage by two national carriers. China Mobile launched 5G-Advanced in 300 cities late in 2025, bundling 10 Gbps premium tiers and gaming passes. Japan's Open RAN buildouts cut rural site costs 28%, while South Korea boasts 72% 5G penetration, the world's highest.
The Middle East is the fastest-growing territory at a 20.01% CAGR. United Arab Emirates operators achieved 95% population reach by mid-2025, underpinning smart-city pilots with autonomous shuttles and AI traffic controls. Saudi carriers launched standalone cores across major metros to serve oil, logistics, and healthcare verticals in line with Vision 2030 ambitions, while Turkey switched on 5G in its three largest cities, targeting fixed-wireless competition
North America and Europe exhibit slower subscriber-driven growth but pivot to enterprise and fixed-wireless scaling. A U.S. carrier's C-band network covered 230 million people by December 2025, monetizing 4 million fixed-wireless lines. Deutsche Telekom's cross-border slices boosted enterprise revenue 14% year-on-year. South America and Africa trail because of auction delays, device affordability gaps, and backhaul shortfalls, although selective rollouts in Brazil and South Africa defend mobile incumbents against fiber overtures.
- China Mobile Ltd.
- Verizon Communications Inc.
- AT&T Inc.
- T-Mobile US Inc.
- China Telecom Corp. Ltd.
- Telefonaktiebolaget LM Ericsson
- Nokia Corp.
- Huawei Technologies Co. Ltd.
- Deutsche Telekom AG
- Vodafone Group Plc
- Orange S.A.
- Telefonica S.A.
- BT Group plc
- Swisscom AG
- Telstra Corp. Ltd.
- SK Telecom Co. Ltd.
- KT Corp.
- Rakuten Mobile Inc.
- Reliance Jio Infocomm Ltd.
- Qualcomm Inc.
- Samsung Electronics Co. Ltd.
- ZTE Corp.
- NTT Docomo Inc.
- Bharti Airtel Ltd.
Additional Benefits:
- The market estimate (ME) sheet in Excel format
- 3 months of analyst support
TABLE OF CONTENTS
1 INTRODUCTION
- 1.1 Study Assumptions and Market Definition
- 1.2 Scope of the Study
2 RESEARCH METHODOLOGY
3 EXECUTIVE SUMMARY
4 MARKET LANDSCAPE
- 4.1 Market Overview
- 4.2 Market Drivers
- 4.2.1 Exploding Mobile Data Traffic
- 4.2.2 High Consumer Demand For eMBB Services
- 4.2.3 Enterprise Digital-Transformation Use-Cases
- 4.2.4 Government Spectrum-Release Initiatives
- 4.2.5 Private-5G Uptake in CBRS and Local-Licence Bands
- 4.2.6 Monetisation Via Network Slicing and SLA Tiers
- 4.3 Market Restraints
- 4.3.1 High Deployment Cost and Long ROI Horizons
- 4.3.2 Fragmented and Delayed Spectrum Policy
- 4.3.3 Limited 5G Device Readiness In Emerging Markets
- 4.3.4 Geopolitical Vendor Restrictions and Trade Bans
- 4.4 Value Chain Analysis
- 4.5 Regulatory Landscape
- 4.6 Technological Outlook
- 4.7 Porter's Five Forces
- 4.7.1 Threat of New Entrants
- 4.7.2 Bargaining Power of Buyers
- 4.7.3 Bargaining Power of Suppliers
- 4.7.4 Threat of Substitutes
- 4.7.5 Intensity of Competitive Rivalry
5 MARKET SIZE AND GROWTH FORECASTS (VALUE)
- 5.1 By Service Type
- 5.1.1 Enhanced Mobile Broadband (eMBB)
- 5.1.2 Ultra-Reliable Low-Latency Comms (URLLC)
- 5.1.3 Massive Machine-Type Comms (mMTC)
- 5.2 By Network Architecture
- 5.2.1 Non-Standalone (NSA) 5G
- 5.2.2 Standalone (SA) 5G
- 5.3 By Frequency Band
- 5.3.1 Low-Band (Less than 1 GHz)
- 5.3.2 Mid-Band (1- 6 GHz)
- 5.3.3 Millimetre-Wave (Greater than 24 GHz)
- 5.4 By End-User Industry
- 5.4.1 IT and Telecom
- 5.4.2 Media and Entertainment
- 5.4.3 Automotive and Mobility
- 5.4.4 Energy and Utilities
- 5.4.5 Aerospace and Defense
- 5.4.6 Manufacturing
- 5.4.7 Healthcare
- 5.4.8 Other End-User Industries
- 5.5 By Geography
- 5.5.1 North America
- 5.5.1.1 United States
- 5.5.1.2 Canada
- 5.5.1.3 Mexico
- 5.5.2 South America
- 5.5.2.1 Brazil
- 5.5.2.2 Argentina
- 5.5.2.3 Rest of South America
- 5.5.3 Europe
- 5.5.3.1 Germany
- 5.5.3.2 United Kingdom
- 5.5.3.3 France
- 5.5.3.4 Italy
- 5.5.3.5 Russia
- 5.5.3.6 Rest of Europe
- 5.5.4 Asia Pacific
- 5.5.4.1 China
- 5.5.4.2 India
- 5.5.4.3 Japan
- 5.5.4.4 South Korea
- 5.5.4.5 Rest of Asia Pacific
- 5.5.5 Middle East
- 5.5.5.1 Saudi Arabia
- 5.5.5.2 United Arab Emirates
- 5.5.5.3 Turkey
- 5.5.5.4 Rest of Middle East
- 5.5.6 Africa
- 5.5.6.1 South Africa
- 5.5.6.2 Nigeria
- 5.5.6.3 Rest of Africa
- 5.5.1 North America
6 COMPETITIVE LANDSCAPE
- 6.1 Market Concentration
- 6.2 Strategic Moves
- 6.3 Market Share Analysis
- 6.4 Company Profiles {(includes Global level Overview, Market level overview, Core Segments, Financials as available, Strategic Information, Market Rank/Share for key companies, Products and Services, and Recent Developments)}
- 6.4.1 China Mobile Ltd.
- 6.4.2 Verizon Communications Inc.
- 6.4.3 AT&T Inc.
- 6.4.4 T-Mobile US Inc.
- 6.4.5 China Telecom Corp. Ltd.
- 6.4.6 Telefonaktiebolaget LM Ericsson
- 6.4.7 Nokia Corp.
- 6.4.8 Huawei Technologies Co. Ltd.
- 6.4.9 Deutsche Telekom AG
- 6.4.10 Vodafone Group Plc
- 6.4.11 Orange S.A.
- 6.4.12 Telefonica S.A.
- 6.4.13 BT Group plc
- 6.4.14 Swisscom AG
- 6.4.15 Telstra Corp. Ltd.
- 6.4.16 SK Telecom Co. Ltd.
- 6.4.17 KT Corp.
- 6.4.18 Rakuten Mobile Inc.
- 6.4.19 Reliance Jio Infocomm Ltd.
- 6.4.20 Qualcomm Inc.
- 6.4.21 Samsung Electronics Co. Ltd.
- 6.4.22 ZTE Corp.
- 6.4.23 NTT Docomo Inc.
- 6.4.24 Bharti Airtel Ltd.
7 MARKET OPPORTUNITIES AND FUTURE OUTLOOK
- 7.1 White-space and Unmet-need Assessment

 5G服務市場:按組件、架構、應用和最終用戶產業分類-2026-2032年全球市場預測
 5G服務市場預測至2034年——全球通訊方式、服務類型、應用、產業、最終用戶和地區分析——產業特定分析
 5G服務市場規模、佔有率和趨勢分析報告:按通訊類型、行業和細分市場分類的預測(2026-2033年)
 2026-2030年全球5G服務市場
 2026年全球5G服務市場報告
 5G服務市場分析及預測(至2035年):依類型、產品類型、服務、技術、組件、應用、部署類型、最終用戶及功能分類
 2026-2034年全球5G服務市場規模、佔有率、趨勢和成長分析報告
 5G服務市場-全球產業規模、佔有率、趨勢、機會及預測(依通訊類型、產業垂直領域、最終用途、地區及競爭格局分類,2021-2031年)
 5G服務市場:產業趨勢·全球預測 (~2035年):服務類型·通訊類型·技術·用途·終端用戶·企業規模·各地區
 5G 服務市場規模、佔有率及成長分析(按通訊類型、企業、應用、最終用戶和地區)- 產業預測(2025 年至 2032 年)