


 |
市場調查報告書
商品編碼
2154296
卡車拖車:市場佔有率分析、行業趨勢和統計數據、成長預測(2026-2031 年)Truck Trailer - Market Share Analysis, Industry Trends & Statistics, Growth Forecasts (2026 - 2031) |
||||||

※ 本網頁內容可能與最新版本有所差異。詳細情況請與我們聯繫。
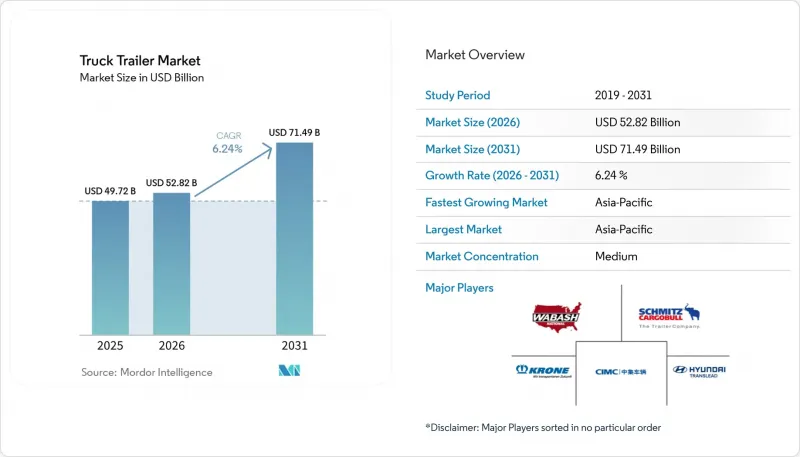
根據 Mordor Intelligence 估計,到 2025 年,卡車拖車市值將達到 497.2 億美元,到 2026 年將達到 528.2 億美元。
此外,預計在預測期(2026-2031 年)內,複合年成長率將達到 6.24%,到 2031 年將達到 714.9 億美元。
全球卡車拖車市場趨勢與洞察
電子商務導致小包裹處理量增加
為實現當日送達而建構的小包裹網路依賴微型倉配中心和分類中心之間的高密度穿梭環線,從而增加了每日空車(無貨物)的運輸次數。亞馬遜推出自有品牌拖車用於Prime配送,顯示零售商如何確保自身運輸能力以維持服務水準。標準裝卸平台高度配置可實現高效的越庫作業,而配備升降尾板的車輛則提高了都市區的配送密度。此外,隨著對包裝最佳化的日益重視,市場對配備可調節E型軌道和物流立柱的拖車的需求不斷成長,這些拖車的設計旨在適應不同高度的瓦楞紙箱。透過利用即時位置和停留時間分析,車隊管理人員可以更有效地最佳化拖車在區域樞紐的運行,從而減少閒置時間,並有效利用系統中先前未開發的運輸能力。
基礎設施和建設產業蓬勃發展。
中國、印度和東南亞的新建公路、鐵路和可再生能源項目使平板車和低底盤組裝裝配線保持運作運轉。中國的「一帶一路」舉措正在沿著洲際走廊運輸水泥、結構鋼和渦輪機葉片等大宗貨物,從而推動了對伸縮式和多軸拖車的需求。印度的國家基礎設施計畫包含9,000多個項目,鼓勵當地運輸商採用負載容量51至100噸的車輛運輸重型設備。風力發電廠的開發需要配備油壓輔助轉向系統的葉片運輸車,以便在當地道路上高效行駛;而太陽能發電廠的開發商則傾向於使用可最佳化組件裝載密度的低框架平板車。長期的目的地公私合營資金籌措使原始設備製造商能夠在關鍵項目現場附近規劃和建立本地化的焊接和噴漆設施。
鋼鐵和鋁價格波動
2024年,熱軋捲板基準價格波動幅度高達40%,嚴重影響了整車製造商的毛利率,並為長期訂單定價帶來挑戰。美國對鋁材徵收進口關稅,導致每噸鋁材成本增加250美元,縮小了鋁材與複合材料之間的成本差距。為應對這些挑戰,製造商實施了季度價格調整條款,但小規模經銷商難以將這些額外成本轉嫁給終端用戶。雖然避險協議在一定程度上緩解了價格波動的影響,但需要現金抵押,限制了營運資金。因此,部分車主推遲了車輛更換週期,導致原物料需求暫時下降,直到原物料價格穩定下來。
細分市場分析
到2025年,乾貨車將佔據卡車拖車市場36.17%的佔有率,凸顯了其在運輸對體積要求較高的小型和普通貨物方面的適用性。冷藏拖車雖然市佔率較小,但預計到2031年將以6.55%的複合年成長率成長,這主要得益於生鮮食品和藥品物流需求的成長。平板拖車在運輸建築鋼材、木材和機械設備方面發揮著至關重要的作用,尤其是在需要側面或頂部裝載的情況下。此外,低底盤對於運輸基礎設施項目中使用的超大型挖土機不可或缺。罐車仍然是運輸危險液體的必備工具,而伸縮式刀片運輸車在支援風力發電工程的重要性日益凸顯。
電子商務營運商正在對乾貨車進行改造,加裝專用物流樁和係緊桿,以提高小包裹裝載密度。同時,冷鏈專家正在投資配備氫燃料電池或電力備用系統的多溫區冷藏拖車,以滿足都市區排放氣體法規的要求。在預測期內,卡車拖車市場預計將看到所有類型拖車廣泛採用遠端資訊處理技術,從而實現即時貨物監控和預測性維護計劃。將互聯功能作為目的地保固包一部分的原始設備製造商 (OEM) 預計將獲得長期車隊契約,進一步整合分散的供應商市場。
到2025年,鋼材將佔據卡車拖車市場63.22%的佔有率,這主要得益於其成本績效效益和完善的服務網路。然而,隨著車隊營運商日益重視燃油效率和耐腐蝕性,複合材料和鋁製產品預計將以6.28%的複合年成長率成長,到2031年可能佔到新增產量的三分之一。鋼材的可回收性和較低的初始成本優勢鞏固了其在對成本敏感的乾貨車隊中的地位。儘管如此,對重量敏感的冷藏船和油輪營運商正逐漸選擇更先進的材料,這主要是出於降低營運成本的考量。
與傳統的鋼製外板相比,複合材料夾芯板具有極高的抗分層性能,並能長期保持良好的隔熱性能(R值),從而降低整個生命週期的能耗。此外,混合設計將鋼製連接件與鋁製側軌相結合,實現了成本和重量之間的平衡。材料供應商與原始設備製造商 (OEM) 的設計工作室合作,利用有限元素建模來最佳化面板的層壓結構,確保足夠的強度裕度,同時避免不必要的過度設計。隨著以永續性發展為導向的採購政策日益普及,生命週期評估 (LCA) 的結果預計將促使採用替代材料的訂單數量增加,並有望推動卡車拖車市場中鋼材和複合材料的逐步重新分配。
區域分析
預計到2025年,亞太地區將佔據卡車掛車市場38.74%的顯著佔有率。這主要得益於中國龐大的製造地和印度在商品及服務稅(GST)政策推動下的物流整合。隨著電子商務滲透率的不斷提高和基礎設施投資的持續成長,預計到2031年,該地區市場將以6.34%的複合年成長率成長。此外,政府為推廣歐VI排放氣體標準而獎勵正在加速車輛更新換代,從而帶動區域內目的地設備製造商(OEM)的產量成長。
在市場佔有率位居第二的北美地區,遠端資訊處理技術和輕量化材料的使用持續推進。在美國,大型小包裹遞送公司正在擴大複合材料的使用;而在加拿大,資源依賴型經濟結構維持著對多軸油輪和散裝拖車的強勁需求。 《美墨加協定》(USMCA)的框架促進了跨境運輸能力的重新配置,使車隊能夠透過跨區域重新分配資產來應對季節性貨運量激增,而無需購買新設備。
永續性是歐洲的優先事項,歐盟綠色交易鼓勵原始設備製造商(OEM)採用可回收複合材料和替代燃料冷卻裝置。成員國之間軸荷規定的差異給長途運輸帶來了挑戰,但持續推進的運輸走廊協調工作預計將在預測期內實現44總噸的標準化限值。英國脫歐後,為因應進口關稅,英國正在重組其供應鏈,增加成品拖車的進口,並加強國內維修能力,以延長資產使用壽命。同時,東歐新興的組裝製造商憑藉著更低的營運成本和瞄準價格敏感型車隊,正對西歐的老牌製造商構成挑戰。
其他好處:
- Excel格式的市場預測(ME)表
- 3個月的分析師支持
目錄
第1章:引言
- 研究假設和市場定義
- 調查範圍
第2章:調查方法
第3章執行摘要
第4章 市場狀況
- 市場概覽
- 市場促進因素
- 電子商務導致小包裹處理量增加
- 基礎設施和建設產業蓬勃發展
- 冷鏈網路的擴展
- 用輕量材料替換車輛
- 用於拖車利用的智慧遠端資訊處理
- 氫動力冷凍和冷凍技術的普及
- 市場限制因素
- 鋼鐵和鋁價格波動
- 軸荷限制
- 執照拖車技工短缺
- 互聯車隊的網路安全風險
- 價值供應鏈分析
- 監理情勢
- 技術展望
- 波特五力分析
第5章 市場規模與成長預測
- 依拖車類型
- 乾貨廂式拖車
- 平板拖車
- 冷藏拖車
- 低底盤拖車
- 油船
- 伸縮式拖車
- 材料
- 鋼
- 鋁
- 複合材料
- 按運輸能力
- 不到25噸
- 25-50噸
- 51-100噸
- 超過100噸
- 按長度
- 不到40英尺
- 28-45英尺
- 超過45英尺
- 按最終用途行業分類
- 食品/飲料
- 建造
- 石油和天然氣
- 農業
- 零售與電子商務
- 化學品
- 其他
- 按地區
- 北美洲
- 美國
- 加拿大
- 其他北美國家
- 南美洲
- 巴西
- 阿根廷
- 其他南美國家
- 歐洲
- 英國
- 德國
- 西班牙
- 義大利
- 法國
- 俄羅斯
- 其他歐洲國家
- 亞太地區
- 印度
- 中國
- 日本
- 韓國
- 其他亞太國家
- 中東和非洲
- 阿拉伯聯合大公國
- 沙烏地阿拉伯
- 土耳其
- 埃及
- 南非
- 其他中東和非洲國家
- 北美洲
第6章 競爭情勢
- 市場集中度
- 策略趨勢
- 市佔率分析
- 公司簡介
- CIMC Vehicles(Group)Co., Ltd.
- Wabash National Corporation
- Utility Trailer Manufacturing Company
- Great Dane LLC
- Hyundai Translead
- Schmitz Cargobull AG
- Fahrzeugwerk Bernard Krone GmbH
- Kogel Trailer GmbH & Co. KG
- Stoughton Trailers LLC
- Lamberet SAS
- Randon Implementos
- Kassbohrer
- Fontaine Trailer Company
- Vanguard National Trailer Corp.
- Titan Trailers Inc.
- MAC Trailer Enterprises Inc.
- Schwarzmuller Group
- SDC Trailers Ltd.
第7章 市場機會與未來展望
According to Mordor Intelligence, the truck trailer market size was valued at USD 49.72 billion in 2025 and is estimated to reach USD 52.82 billion in 2026, and is projected to reach USD 71.49 billion by 2031, at a CAGR of 6.24% during the forecast period (2026-2031).
Global Truck Trailer Market Trends and Insights
E-Commerce-Driven Parcel Volumes
Parcel networks built for same-day fulfillment rely on dense shuttle loops between micro-fulfillment centers and sorting hubs, increasing dry van turns per day. Amazon's rollout of branded trailers for Prime fulfillment demonstrates how retailers internalize capacity to safeguard service levels. Standard dock height configurations facilitate efficient cross-docking, while lift gate-equipped vehicles enhance urban delivery density. Furthermore, the increasing focus on packaging right-sizing is driving the demand for trailers equipped with adjustable e-tracks and logistics posts, which are designed to accommodate varying carton heights. The use of real-time location and dwell-time analytics allows fleet managers to optimize trailer movement through regional hubs more effectively, thereby reducing idle time and unlocking previously unused capacity within the system.
Infrastructure and Construction Up-Cycle
New road, rail, and renewable-energy projects in China, India, and Southeast Asia keep flatbed and lowboy assembly lines busy. China's Belt and Road Initiative channels bulk cement, structural steel, and turbine blades across transcontinental corridors, elevating demand for extendable and multi-axle trailers. India's National Infrastructure Pipeline includes more than 9,000 projects, encouraging local fleets to adopt rigs with capacities ranging from 51 to 100 tons for heavy equipment transportation. Wind farm developments require blade carriers equipped with hydraulic steering systems to effectively navigate rural access roads, while solar farm developers prefer drop-frame flatbeds designed to optimize module stack density. The availability of long-term public-private funding provides original equipment manufacturers (OEMs) with the opportunity to plan and establish localized welding and painting facilities in proximity to major project hubs.
Volatile Steel and Aluminum Prices
Benchmark hot-rolled coil prices experienced a fluctuation of 40% in 2024, which significantly impacted OEM gross margins and created challenges in determining the pricing of long-term order books. The introduction of aluminum import tariffs in the United States resulted in an additional cost of USD 250 per ton, thereby reducing the cost difference between aluminum and composite builds. To address these challenges, manufacturers adopted quarterly price-adjustment clauses; however, smaller dealers encountered difficulties in transferring these surcharges to end users. Although hedging contracts provided partial mitigation against price volatility, they required cash collateral, which placed constraints on working capital. Consequently, some fleets deferred their replacement cycles, leading to a temporary reduction in demand until raw material prices achieved greater stability.
Other drivers and restraints analyzed in the detailed report include:
- Cold-Chain Network Expansion
- Fleet Renewal to Lightweight Materials
- Axle-Weight Regulatory Limits
For complete list of drivers and restraints, kindly check the Table Of Contents.
Segment Analysis
In 2025, dry vans accounted for 36.17% of the truck trailer market share, emphasizing their suitability for cube-oriented parcels and general merchandise transportation. While refrigerated trailers represent a smaller market segment, they are projected to grow at a CAGR of 6.55% through 2031, driven by increasing demand in fresh grocery and pharmaceutical logistics. Flatbeds play a critical role in transporting construction steel, lumber, and machinery, particularly in scenarios where side or top loading is required. Additionally, lowboys are essential for moving oversized excavators used in infrastructure projects. Tankers remain indispensable for the transportation of hazardous liquids, while extendable blade carriers are gaining importance in supporting wind-energy projects.
E-commerce operators are retrofitting dry vans with captive logistics posts and load bars to enhance parcel cube density. In contrast, cold-chain specialists are investing in multi-zone reefers equipped with hydrogen or electric standby systems to comply with urban emissions regulations. Over the forecast period, the truck trailer market is expected to witness increased adoption of telematics across all trailer types, enabling real-time load monitoring and predictive maintenance scheduling. Original Equipment Manufacturers (OEMs) that offer connectivity features as part of standard warranty packages are likely to secure long-term fleet contracts, further consolidating the fragmented supplier landscape.
In 2025, steel accounted for 63.22% of the truck trailer market share, driven by its cost-effectiveness and established service networks. However, as fleets increasingly prioritize fuel efficiency and corrosion resistance, composite and aluminum variants are anticipated to grow at a 6.28% CAGR, potentially representing one-third of new builds by 2031. Steel's recyclability and upfront cost advantage continue to secure its position in cost-sensitive dry van fleets. Nevertheless, operators of weight-sensitive reefers and tankers are progressively opting for advanced materials with higher capital expenditures, citing reduced operating expenses as a key factor.
Composite sandwich panels, in contrast to traditional steel skins, demonstrate resistance to delamination and maintain insulation R-values for extended periods, thereby reducing energy consumption over their life cycle. Additionally, hybrid designs integrate steel coupler regions with aluminum side rails, achieving a balance between cost and weight. Material suppliers, in collaboration with OEM design studios, are utilizing finite-element modeling to optimize panel lay-ups, ensuring adequate strength margins without unnecessary over-engineering. As sustainability-focused procurement policies become more widespread, life-cycle assessments are expected to influence a greater number of orders toward alternative materials, gradually redistributing the truck trailer market size shares between steel and composites.
Complete Report Scope:
- By Trailer Type
- Dry Van Trailers
- Flatbed Trailers
- Refrigerated (Reefer) Trailers
- Lowboy Trailers
- Tankers
- Extendable Trailers
- By Material
- Steel
- Aluminum
- Composite Materials
- By Tonnage Capacity
- Below 25 Tons
- 25 to 50 Tons
- 51 to 100 Tons
- Above 100 Tons
- By Length
- Up to 40 Feet
- 28 to 45 Feet
- Above 45 Feet
- By End-Use Industry
- Food and Beverage
- Construction
- Oil and Gas
- Agriculture
- Retail and E-Commerce
- Chemicals
- Others
- By Geography
- North America
- United States
- Canada
- Rest of North America
- South America
- Brazil
- Argentina
- Rest of South America
- Europe
- United Kingdom
- Germany
- Spain
- Italy
- France
- Russia
- Rest of Europe
- Asia-Pacific
- India
- China
- Japan
- South Korea
- Rest of Asia-Pacific
- Middle East and Africa
- United Arab Emirates
- Saudi Arabia
- Turkey
- Egypt
- South Africa
- Rest of Middle East and Africa
- North America
Geography Analysis
In 2025, Asia-Pacific accounted for a significant 38.74% share of the truck trailer market, supported by China's extensive manufacturing corridor and India's logistics consolidation facilitated by the Goods and Services Tax (GST). With rising e-commerce penetration and steady infrastructure investment, the region is expected to lead with a 6.34% CAGR through 2031. Additionally, government incentives promoting Euro-VI-equivalent emission standards are accelerating fleet replacement cycles, thereby boosting production for regional original equipment manufacturers (OEMs).
North America, which holds the second-largest market volume, continues to drive advancements in telematics adoption and the use of lightweight materials. In the United States, large parcel carriers are increasingly adopting composites, while Canada's resource-dependent economy sustains demand for multi-axle tankers and bulk trailers. The United States-Mexico-Canada Agreement (USMCA) framework facilitates cross-border capacity rebalancing, enabling fleets to reposition assets across regions to manage seasonal freight surges without necessitating new purchases.
Europe is emphasizing sustainability, encouraging OEMs to incorporate recyclable composites and alternative-fuel refrigeration units in alignment with the EU Green Deal. Although axle-weight disparities among member states present challenges for long-haul routes, ongoing efforts to harmonize corridors could enable standardized 44-ton gross limits during the forecast period. Following Brexit, the United Kingdom is restructuring its supply chains by increasing imports of finished trailers and enhancing domestic refurbishment capabilities to extend asset lifespans in response to import tariffs. Meanwhile, emerging assemblers in Eastern Europe are targeting price-sensitive fleets by leveraging lower operating costs, thereby challenging established players in the western regions.
- CIMC Vehicles (Group) Co., Ltd.
- Wabash National Corporation
- Utility Trailer Manufacturing Company
- Great Dane LLC
- Hyundai Translead
- Schmitz Cargobull AG
- Fahrzeugwerk Bernard Krone GmbH
- Kogel Trailer GmbH & Co. KG
- Stoughton Trailers LLC
- Lamberet SAS
- Randon Implementos
- Kassbohrer
- Fontaine Trailer Company
- Vanguard National Trailer Corp.
- Titan Trailers Inc.
- MAC Trailer Enterprises Inc.
- Schwarzmuller Group
- SDC Trailers Ltd.
Additional Benefits:
- The market estimate (ME) sheet in Excel format
- 3 months of analyst support
TABLE OF CONTENTS
1 Introduction
- 1.1 Study Assumptions and Market Definition
- 1.2 Scope of the Study
2 Research Methodology
3 Executive Summary
4 Market Landscape
- 4.1 Market Overview
- 4.2 Market Drivers
- 4.2.1 E-Commerce-Driven Parcel Volumes
- 4.2.2 Infrastructure and Construction Up-Cycle
- 4.2.3 Cold-Chain Network Expansion
- 4.2.4 Fleet Renewal to Lightweight Materials
- 4.2.5 Smart Telematics for Trailer Utilization
- 4.2.6 Hydrogen-Powered Refrigeration Adoption
- 4.3 Market Restraints
- 4.3.1 Volatile Steel and Aluminum Prices
- 4.3.2 Axle-Weight Regulatory Limits
- 4.3.3 Shortage of Certified Trailer Mechanics
- 4.3.4 Cyber-Security Risks in Connected Fleets
- 4.4 Value/Supply-Chain Analysis
- 4.5 Regulatory Landscape
- 4.6 Technological Outlook
- 4.7 Porter's Five Forces Analysis
- 4.7.1 Bargaining Power of Suppliers
- 4.7.2 Bargaining Power of Buyers
- 4.7.3 Threat of New Entrants
- 4.7.4 Threat of Substitutes
- 4.7.5 Competitive Rivalry
5 Market Size and Growth Forecasts (Value (USD) and Volume (Units))
- 5.1 By Trailer Type
- 5.1.1 Dry Van Trailers
- 5.1.2 Flatbed Trailers
- 5.1.3 Refrigerated (Reefer) Trailers
- 5.1.4 Lowboy Trailers
- 5.1.5 Tankers
- 5.1.6 Extendable Trailers
- 5.2 By Material
- 5.2.1 Steel
- 5.2.2 Aluminum
- 5.2.3 Composite Materials
- 5.3 By Tonnage Capacity
- 5.3.1 Below 25 Tons
- 5.3.2 25 to 50 Tons
- 5.3.3 51 to 100 Tons
- 5.3.4 Above 100 Tons
- 5.4 By Length
- 5.4.1 Up to 40 Feet
- 5.4.2 28 to 45 Feet
- 5.4.3 Above 45 Feet
- 5.5 By End-Use Industry
- 5.5.1 Food and Beverage
- 5.5.2 Construction
- 5.5.3 Oil and Gas
- 5.5.4 Agriculture
- 5.5.5 Retail and E-Commerce
- 5.5.6 Chemicals
- 5.5.7 Others
- 5.6 By Geography
- 5.6.1 North America
- 5.6.1.1 United States
- 5.6.1.2 Canada
- 5.6.1.3 Rest of North America
- 5.6.2 South America
- 5.6.2.1 Brazil
- 5.6.2.2 Argentina
- 5.6.2.3 Rest of South America
- 5.6.3 Europe
- 5.6.3.1 United Kingdom
- 5.6.3.2 Germany
- 5.6.3.3 Spain
- 5.6.3.4 Italy
- 5.6.3.5 France
- 5.6.3.6 Russia
- 5.6.3.7 Rest of Europe
- 5.6.4 Asia-Pacific
- 5.6.4.1 India
- 5.6.4.2 China
- 5.6.4.3 Japan
- 5.6.4.4 South Korea
- 5.6.4.5 Rest of Asia-Pacific
- 5.6.5 Middle East and Africa
- 5.6.5.1 United Arab Emirates
- 5.6.5.2 Saudi Arabia
- 5.6.5.3 Turkey
- 5.6.5.4 Egypt
- 5.6.5.5 South Africa
- 5.6.5.6 Rest of Middle East and Africa
- 5.6.1 North America
6 Competitive Landscape
- 6.1 Market Concentration
- 6.2 Strategic Moves
- 6.3 Market Share Analysis
- 6.4 Company Profiles (Includes Global Level Overview, Market Level Overview, Core Segments, Financials as Available, Strategic Information, Market Rank/Share for Key Companies, Products and Services, SWOT Analysis, and Recent Developments)
- 6.4.1 CIMC Vehicles (Group) Co., Ltd.
- 6.4.2 Wabash National Corporation
- 6.4.3 Utility Trailer Manufacturing Company
- 6.4.4 Great Dane LLC
- 6.4.5 Hyundai Translead
- 6.4.6 Schmitz Cargobull AG
- 6.4.7 Fahrzeugwerk Bernard Krone GmbH
- 6.4.8 Kogel Trailer GmbH & Co. KG
- 6.4.9 Stoughton Trailers LLC
- 6.4.10 Lamberet SAS
- 6.4.11 Randon Implementos
- 6.4.12 Kassbohrer
- 6.4.13 Fontaine Trailer Company
- 6.4.14 Vanguard National Trailer Corp.
- 6.4.15 Titan Trailers Inc.
- 6.4.16 MAC Trailer Enterprises Inc.
- 6.4.17 Schwarzmuller Group
- 6.4.18 SDC Trailers Ltd.
7 Market Opportunities and Future Outlook
- 7.1 White-space and Unmet-Need Assessment

 氫氣管束容器市場:全球市場預測,2026-2032年氫氣長管拖車市場:全球市場預測,2026-2032年活底料斗市場:全球市場預測,2026-2032年
 2026-2030年全球汽車拖吊市場
 低平板拖車(LBT)全球市場轉盤式牽引桿拖車市場:全球市場預測,2026-2032年
 低平板拖車(LBT)市場:按產品類型、應用、軸配置、負載容量、材質、國家和地區分類-全球產業分析、市場規模、市場佔有率及2026年至2033年預測
 馬來西亞拖車市場:市場佔有率分析、產業趨勢與統計、成長預測(2026-2031)歐洲輕型商用拖車:市場佔有率分析、產業趨勢與統計及成長預測(2026-2031 年)
 低平板拖車(LBT)市場規模:按產品類型、應用、地區和預測分類