


 |
市場調查報告書
商品編碼
2154221
能源物流:市場佔有率分析、產業趨勢與統計、成長預測(2026-2031)Energy Logistics - Market Share Analysis, Industry Trends & Statistics, Growth Forecasts (2026 - 2031) |
||||||

※ 本網頁內容可能與最新版本有所差異。詳細情況請與我們聯繫。
據 Mordor Intelligence 稱,2025 年能源物流市場價值為 1930.2 億美元,預計到 2031 年將達到 3067.3 億美元,而 2026 年為 2102.1 億美元,2026 年至 2031 年的複合年成長率為 7.85%預計為 7.85%。
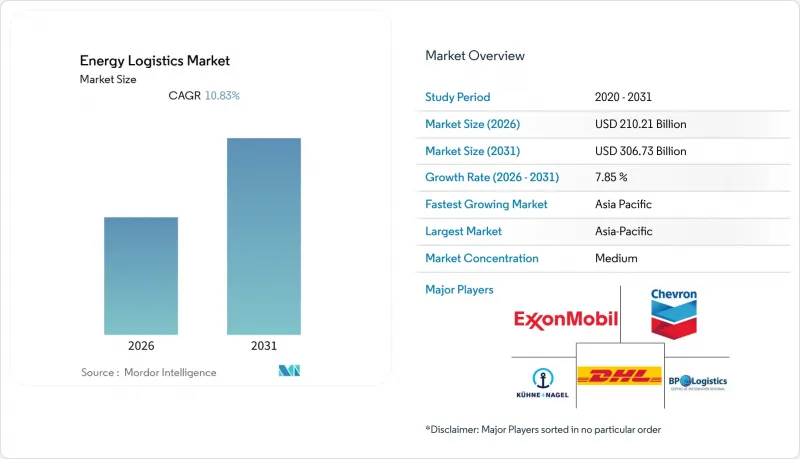
無論發生在生產地或消費地,液化天然氣、石油產品、關鍵礦產和可再生能源設備的跨境貿易都在持續改變貨運規劃。本報告按服務(運輸、倉儲、附加價值服務)、最終用戶(石油和天然氣、發電和公共產業、可再生能源、採礦和金屬、EPC承包商、政府和公共基礎設施、其他)以及地區(北美、南美、歐洲、亞太、中東和非洲)進行細分。市場預測以美元計價。
全球能源物流市場趨勢及洞察
擴大跨境能源貿易與能源安全投資
跨境能源貿易持續推動出口設施和接收基礎設施的貨運需求。預計2025年全球液化天然氣(LNG)貿易量將成長6.7%,2026年底,LNG供應量預計將成長超過7%。北美地區將佔2026年新增供應量的85%以上。北美地區的LNG出口能力預計將從2024年初的每日114億立方英尺增加到2029年的每日287億立方英尺。 2026年上半年,LNG出口量平均為每日174億立方英尺,較去年同期成長23%。新建出口碼頭需要建築材料,而進口碼頭則需要設備採購、運輸和倉儲能力。美國國際發展金融公司(USIDFC)和I Squared Capital宣布啟動一項價值30億美元的平台,用於建設南亞和東南亞地區的LNG和石油產品進口、倉儲和運輸基礎設施。
擴大可再生能源和電池儲能專案的物流
隨著可再生能源裝置容量的成長,整個能源物流市場對專業運輸、倉儲和最後一公里配送的需求也隨之上升。預計在2025年至2030年間,可再生能源裝置容量將增加近4,600吉瓦,其中太陽能發電預計將佔新增裝置容量的80%。由於需要危險品認證、溫度控制以及與電網運作時間同步交付,電池能源儲存系統已成為專案貨物的主要類別。 DHL集團宣布計劃將新能源物流收入從2025年的6.5億美元成長到2030年的33億美元。因此,能源物流市場要求供應商同時具備處理能力和貨物工程能力。與支撐它們的光學模組相比,電池系統更重、更複雜,並且需要危險品處理。早期可再生能源專案的預算並非總是能充分反映這些處理方面的複雜性。
基礎設施分散且多式聯運成本高昂
基礎設施碎片化增加了偏遠地區設施依賴多種運輸方式時的專案執行風險。進出路線通常結合了港口、公路、堆場、水路和區域配送能力,但可靠性參差不齊。在非洲的下游網路中,政府的價格補貼擠壓了利潤空間,阻礙了私人對配送基礎設施的投資。由此產生的缺口增加了專案開發的物流成本,並限制了網路處理更大吞吐量的能力。港口、航運和重型運輸的瓶頸也限制了亞太、歐洲以及中東和非洲的可再生能源專案。在能源物流市場,這些瓶頸延誤了超大型零件的運輸,減少了原本正在擴張的專案管道的可用運力。
細分市場分析
2025年,運輸業佔能源物流市場的67.19%。這一佔有率反映了液化天然氣貿易和分散式可再生能源項目持續的運輸需求。運輸業涵蓋了貨物從港口、堆場和生產基地到遠端能源資產的實際運輸。倉儲業與電池專案和液化天然氣接收站同步發展。隨著處理量的成長,永久性集散設施逐漸取代臨時儲存地點,成為越來越普遍的選擇。 2025年下半年,紐卡斯爾港獲得州政府批准,可在梅菲爾德碼頭暫時存放一套電網級電池系統。該港口還投資2500萬美元擴建泊位,以容納更大的專案貨船。這些設施支援貨物在運往工程現場之前的儲存、集散和可控運輸。
在能源物流市場,附加價值服務預計在2026年至2031年間將以10.37%的複合年成長率成長,成為成長最快的領域。這類服務包括清關、天然放射性物質(NORM)廢棄物管理、健康、安全、安保、環境和品質合規以及貨物運輸可視性。能源運營商利用這些服務來管理監管要求,並執行運輸任務。在一體化合約中,運輸、臨時倉儲、清關和現場交付均由單一供應商集中管理。這種模式有利於能夠協調專案全部流程的物流公司。 2025年6月,ASCO在北海獲得了一份價值數億美元的服務契約,這表明在成熟的能源行業貿易關係中,長期契約模式正在被廣泛採用。能源物流行業受益於此類捆綁式合約,因為它們比獨立的專案運輸更具連續性。可再生能源領域的合約尚未大規模複製這種持續的業務收益水準。
區域分析
2025年,亞太地區佔全球營收的42.54%,預計2026年至2031年複合年成長率(CAGR)最高,達9.61% 。全部區域的貨運活動因液化天然氣進口項目、可再生能源開發和跨境能源互聯互通而成長。 2026年7月,INPEX在印尼啟動了價值210億美元的阿巴迪液化天然氣計畫。同年7月,澳洲更新了“國家可再生能源優先清單”,新增11個項目,其中包括超過4吉瓦時的電池儲能項目。在整個預測期內,亞太地區預計將佔全球基礎設施投資的52.4%以上,其中公用事業規模的儲能投資預計將成長300%。中國、印度、日本和韓國透過碼頭營運和可再生能源項目支撐了需求。
在北美,能源物流領域發生了顯著變化,液化天然氣出口能力、管道、港口和專用船舶運輸能力都已擴展。 2026年上半年,美國液化天然氣日均出口量達1,74億立方英尺,較上年同期成長23%。切尼爾能源公司於2025年6月最終決定投資興建更多液化天然氣生產線,目標是2028年實現年產能超過6,000萬噸。南美洲也發展成為一個成長區域,這得益於巴西的近海開發、阿根廷的瓦卡穆埃爾塔油田開發以及圭亞那的生產設施。 2026年6月,ASCO公司和NV Dordt Gateway公司簽署了一份合作備忘錄,將在蘇利南建造一個擁有550公尺碼頭的近海支持樞紐計畫。該計畫旨在滿足圭亞那-蘇利南盆地的近海物流需求。
2026年,歐洲在油氣、氫氣、離岸風電和碳捕獲方面面臨獨特的物流需求。 「歐洲氫能骨幹網」項目匯集了33家能源基礎設施營運商,並確定了40個管道項目,其中包括一條計劃於2030年投入運作的31500公里長的氫氣管道。透過阿姆斯特丹和杜伊斯堡向德國進口氫氣在技術上是可行的,內河航道、鐵路、公路以及未來的管道運輸都被納入了物流規劃。在中東和非洲地區,有不同的風險因素,霍爾木茲海峽危機限制了全球20%的液化天然氣供應(相當於全球天然氣總供應量的3%)。在這些地區的能源物流市場中,路線多元化以及可靠的海陸運輸和儲存能力尤其重要。
其他好處:
- Excel格式的市場預測(ME)表
- 3個月的分析師支持
目錄
第1章:引言
- 研究假設和市場定義
- 調查範圍
第2章:調查方法
第3章執行摘要
第4章 市場狀況
- 市場概覽
- 市場促進因素
- 擴大跨境能源貿易並投資能源安全
- 擴大可再生能源和電池儲能專案的物流
- 數位化追蹤、控制塔和物流自動化
- 多模態基礎設施和能源項目開發
- 偏遠和海外地區的供應鏈的重要性
- 為超大貨物、危險物品和需要嚴格遵守交貨時間的貨物提供專業物流服務。
- 市場限制因素
- 基礎設施分散且多式聯運成本高昂
- 涉及安全、關稅和環境方面的複雜合規要求。
- 可再生能源專案中港口、航運和重型貨物運輸的瓶頸
- 範圍 3 排放的可見度低且資料標準不一致
- 價值供應鏈分析
- 監理情勢
- 技術展望
- 波特五力分析
- 地緣政治事件對市場的影響
第5章 市場規模與成長預測
- 按服務
- 運輸
- 路
- 鐵路
- 航空
- 海路和內河航道
- 倉庫/存儲
- 附加價值服務
- 運輸
- 最終用戶
- 石油和天然氣
- 發電和公共產業
- 可再生能源
- 採礦和金屬
- EPC承包商和能源設備製造商
- 政府和公共基礎設施
- 其他
- 按地區
- 北美洲
- 美國
- 加拿大
- 墨西哥
- 南美洲
- 巴西
- 阿根廷
- 秘魯
- 智利
- 其他南美國家
- 歐洲
- 德國
- 英國
- 法國
- 義大利
- 西班牙
- 俄羅斯
- 北歐國家(丹麥、芬蘭、冰島、挪威、瑞典)
- 其他歐洲國家
- 亞太地區
- 中國
- 印度
- 日本
- 韓國
- 澳洲
- 東南亞(東協)
- 其他亞太國家
- 中東和非洲
- 沙烏地阿拉伯
- 阿拉伯聯合大公國
- 卡達
- 南非
- 奈及利亞
- 埃及
- 其他中東和非洲國家
- 北美洲
第6章 競爭情勢
- 市場集中度
- 關鍵策略趨勢
- 市佔率分析
- 公司簡介
- DHL Group
- Kuehne+Nagel
- AP Moller-Maersk A/S
- DSV A/S
- CH Robinson Worldwide, Inc.
- Expeditors International of Washington, Inc.
- CMA CGM Group(Including CEVA Logistics)
- GEODIS
- Rhenus Group
- Hellmann Worldwide Logistics
- NYK Line(Including Yusen Logistics Co., Ltd.)
- ASCO Group
- Peterson Energy Logistics
- ADNOC Logistics and Services plc
- Gulf Agency Company(GAC)
- Mammoet Group
- DP World
- deugro Group
- Fracht FWO, Inc.
- The Bertling Group
第7章 市場機會與未來展望
According to Mordor Intelligence, the energy logistics market size was valued at USD 193.02 billion in 2025, and is estimated to grow from USD 210.21 billion in 2026 to reach USD 306.73 billion by 2031, registering a CAGR of 7.85% between 2026 and 2031.
Cross-border trade in LNG, petroleum products, critical minerals, and renewable equipment continued to reshape freight planning across producing and consuming regions. This report is Segmented by Service (Transportation, Warehousing and Storage, Value-Added Services), by End-User (Oil and Gas, Power Generation and Utilities, Renewable Energy, Mining and Metals, EPC Contractors, Government and Public Infrastructure, Others), and by Geography (North America, South America, Europe, Asia-Pacific, Middle East and Africa). The Market Forecasts are Provided in Terms of Value (USD).
Global Energy Logistics Market Trends and Insights
Growth in Cross-Border Energy Trade and Energy-Security Investment
Cross-border energy trade created sustained freight requirements at export facilities and receiving infrastructure. Global LNG trade grew 6.7% in 2025, while LNG supply is forecast to expand by more than 7% by the end of 2026. North America accounted for more than 85% of incremental supply growth during 2026. North American LNG export capacity was on track to rise from 11.4 billion cubic feet per day at the start of 2024 to 28.7 billion cubic feet per day by 2029. LNG exports averaged 17.4 billion cubic feet per day in the first half of 2026, up 23% from the prior year. New export terminals required construction cargo, while import terminals required equipment procurement, transport, and storage capacity. The United States International Development Finance Corporation and I Squared Capital announced a USD 3 billion platform for LNG and petroleum products import, storage, and transport infrastructure across South and Southeast Asia.
Renewable Energy and Battery Storage Project Logistics Expansion
Renewable capacity additions increased demand for specialized transport, storage, and final-mile delivery across the energy logistics market. Renewable power capacity is projected to increase by nearly 4,600 GW between 2025 and 2030, with solar PV representing 80% of the expansion. Battery energy storage systems became a core project-cargo category because they needed hazardous-goods certification, thermal controls, and delivery timed to grid commissioning. DHL Group announced that it planned to expand New Energy logistics revenue from USD 650 million in 2025 to USD 3.3 billion by 2030. The energy logistics market, therefore, required providers to combine throughput capacity with cargo engineering. Battery systems created heavier-lift and more complex, dangerous-goods work than the solar modules they supported. Early renewable project budgets did not always fully reflect that handling complexity.
Fragmented Infrastructure and High Intermodal Transfer Costs
Fragmented infrastructure raised execution risk where remote facilities depended on several transport modes. Access routes often combined ports, roads, storage yards, river links, and local delivery capacity with uneven reliability. In African downstream networks, government price subsidies reduced margins and discouraged private investment in distribution infrastructure. The resulting gaps added logistics costs to project development and limited the ability of networks to handle greater volumes. Port, vessel, and heavy-lift bottlenecks also constrained renewable projects in Asia-Pacific, Europe, the Middle East, and Africa. In the energy logistics market, these bottlenecks delayed the movement of oversized components and reduced the usable capacity of otherwise growing project pipelines.
Other drivers and restraints analyzed in the detailed report include:
- Digital Tracking, Control Towers, and Logistics Automation
- Multimodal Infrastructure and Energy Project Development
- Complex Safety, Customs, and Environmental Compliance
For complete list of drivers and restraints, kindly check the Table Of Contents.
Segment Analysis
Transportation held 67.19% of the energy logistics market share in 2025. Its position reflected the continuous movement required by LNG trade and distributed renewable projects. Transportation covered the physical flow of cargo from ports, yards, and production sites to remote energy assets. Warehousing and storage developed alongside battery projects and LNG receiving terminals. Permanent staging facilities increasingly replaced temporary laydown areas as volumes increased. Port of Newcastle received state approval in late 2025 to stage grid-scale battery systems at its Mayfield Terminal. The port also invested USD 25 million in a berth extension for larger project-cargo vessels. These assets supported storage, consolidation, and controlled transfer before site delivery.
Value-added services recorded the highest forecast CAGR of 10.37% from 2026 to 2031 in the energy logistics market. This service group included customs brokerage, NORM waste management, health, safety, security, environment, and quality compliance, and shipment visibility. Energy operators used these services to manage regulatory requirements alongside transport execution. Integrated contracts placed transportation, staging, customs, and site delivery under one provider. This structure favored logistics companies that could coordinate the full project scope. ASCO secured a nine-figure North Sea services contract in June 2025, showing the long-duration model used in established energy relationships. The energy logistics industry benefited from such bundled contracts because they provided greater continuity than stand-alone project moves. Renewable contracts still had not replicated that level of recurring service revenue at scale.
Complete Report Scope:
- By Service
- Transportation
- Road
- Rail
- Air
- Sea and Inland Waterways
- Warehousing and Storage
- Value-added Services
- Transportation
- By End-User
- Oil and Gas
- Power Generation and Utilities
- Renewable Energy
- Mining and Metals
- EPC Contractors and Energy Equipment Manufacturers
- Government and Public Infrastructure
- Others
- By Geography
- North America
- United States
- Canada
- Mexico
- South America
- Brazil
- Argentina
- Peru
- Chile
- Rest of South America
- Europe
- Germany
- United Kingdom
- France
- Italy
- Spain
- Russia
- Nordics (Denmark, Finland, Iceland, Norway, and Sweden)
- Rest of Europe
- Asia-Pacific
- China
- India
- Japan
- South Korea
- Australia
- Southeast Asia (ASEAN)
- Rest of Asia-Pacific
- Middle East and Africa
- Saudi Arabia
- United Arab Emirates
- Qatar
- South Africa
- Nigeria
- Egypt
- Rest of Middle East and Africa
- North America
Geography Analysis
Asia-Pacific held 42.54% of revenue in 2025 and recorded the highest forecast CAGR of 9.61% from 2026 to 2031. LNG import projects, renewable developments, and cross-border energy links increased freight activity across the region. Inpex began work on the USD 21 billion Abadi LNG project in Indonesia in July 2026. Australia's July 2026 National Renewable Energy Priority List added 11 projects, including more than 4 GWh of battery storage. Asia-Pacific was estimated to account for more than 52.4% of global infrastructure investment through the forecast period, while utility-scale storage investment was projected to grow 300%. China, India, Japan, and South Korea supported demand through terminal operations and renewable project work.
North America underwent a major energy logistics transformation as LNG export capacity, pipelines, ports, and specialized carrier capacity expanded. United States LNG exports averaged 17.4 billion cubic feet per day during the first half of 2026, up 23% year-over-year. Cheniere took final investment decisions on additional trains in June 2025 and targeted a capacity of more than 60 million tonnes per annum by 2028. South America also developed as a growth area through Brazil's offshore expansion, Argentina's Vaca Muerta development, and Guyana's production base. ASCO and N.V. Dordt Gateway signed heads of terms in June 2026 for a Suriname marine-support-base venture with a 550-meter quay. The asset targeted offshore logistics demand in the Guyana-Suriname Basin.
Europe had separate logistics needs for hydrocarbons, hydrogen, offshore wind, and carbon capture during 2026. The European Hydrogen Backbone included 33 energy infrastructure operators and identified 40 pipeline projects with 31,500 kilometers of hydrogen pipelines planned for commissioning before 2030. Hydrogen imports into Germany through Amsterdam and Duisburg were technically feasible, with inland waterways, rail, trucks, and future pipelines included in the logistics design. Middle East and Africa carried a different set of risks because the Hormuz crisis constrained 20% of global LNG supply, equal to 3% of total global gas supply. The energy logistics market in these regions placed a premium on route diversification and reliable marine, road, and storage capacity.
- DHL Group
- Kuehne+Nagel
- A.P. Moller - Maersk A/S
- DSV A/S
- C.H. Robinson Worldwide, Inc.
- Expeditors International of Washington, Inc.
- CMA CGM Group (Including CEVA Logistics)
- GEODIS
- Rhenus Group
- Hellmann Worldwide Logistics
- NYK Line (Including Yusen Logistics Co., Ltd.)
- ASCO Group
- Peterson Energy Logistics
- ADNOC Logistics and Services plc
- Gulf Agency Company (GAC)
- Mammoet Group
- DP World
- deugro Group
- Fracht FWO, Inc.
- The Bertling Group
Additional Benefits:
- The market estimate (ME) sheet in Excel format
- 3 months of analyst support
TABLE OF CONTENTS
1 Introduction
- 1.1 Study Assumptions and Market Definition
- 1.2 Scope of the Study
2 Research Methodology
3 Executive Summary
4 Market Landscape
- 4.1 Market Overview
- 4.2 Market Drivers
- 4.2.1 Growth in Cross-Border Energy Trade and Energy-Security Investment
- 4.2.2 Renewable-Energy and Battery-Storage Project Logistics Expansion
- 4.2.3 Digital Tracking, Control Towers, and Logistics Automation
- 4.2.4 Multimodal Infrastructure and Energy-Project Development
- 4.2.5 Remote-Site and Offshore Supply-Chain Criticality
- 4.2.6 Specialized Logistics for Oversized, Hazardous, and Time-Critical Cargo
- 4.3 Market Restraints
- 4.3.1 Fragmented Infrastructure and High Intermodal Transfer Costs
- 4.3.2 Complex Safety, Customs, and Environmental Compliance
- 4.3.3 Port, Vessel, and Heavy-Lift Bottlenecks for Renewable Projects
- 4.3.4 Low Visibility of Scope-3 Emissions and Inconsistent Data Standards
- 4.4 Value / Supply-Chain Analysis
- 4.5 Regulatory Landscape
- 4.6 Technological Outlook
- 4.7 Porter's Five Forces Analysis
- 4.7.1 Bargaining Power of Suppliers
- 4.7.2 Bargaining Power of Buyers
- 4.7.3 Threat of New Entrants
- 4.7.4 Threat of Substitutes
- 4.7.5 Industry Rivalry
- 4.8 Impact of Geopolitical Events on the Market
5 Market Size and Growth Forecasts (Value in USD)
- 5.1 By Service
- 5.1.1 Transportation
- 5.1.1.1 Road
- 5.1.1.2 Rail
- 5.1.1.3 Air
- 5.1.1.4 Sea and Inland Waterways
- 5.1.2 Warehousing and Storage
- 5.1.3 Value-added Services
- 5.1.1 Transportation
- 5.2 By End-User
- 5.2.1 Oil and Gas
- 5.2.2 Power Generation and Utilities
- 5.2.3 Renewable Energy
- 5.2.4 Mining and Metals
- 5.2.5 EPC Contractors and Energy Equipment Manufacturers
- 5.2.6 Government and Public Infrastructure
- 5.2.7 Others
- 5.3 By Geography
- 5.3.1 North America
- 5.3.1.1 United States
- 5.3.1.2 Canada
- 5.3.1.3 Mexico
- 5.3.2 South America
- 5.3.2.1 Brazil
- 5.3.2.2 Argentina
- 5.3.2.3 Peru
- 5.3.2.4 Chile
- 5.3.2.5 Rest of South America
- 5.3.3 Europe
- 5.3.3.1 Germany
- 5.3.3.2 United Kingdom
- 5.3.3.3 France
- 5.3.3.4 Italy
- 5.3.3.5 Spain
- 5.3.3.6 Russia
- 5.3.3.7 Nordics (Denmark, Finland, Iceland, Norway, and Sweden)
- 5.3.3.8 Rest of Europe
- 5.3.4 Asia-Pacific
- 5.3.4.1 China
- 5.3.4.2 India
- 5.3.4.3 Japan
- 5.3.4.4 South Korea
- 5.3.4.5 Australia
- 5.3.4.6 Southeast Asia (ASEAN)
- 5.3.4.7 Rest of Asia-Pacific
- 5.3.5 Middle East and Africa
- 5.3.5.1 Saudi Arabia
- 5.3.5.2 United Arab Emirates
- 5.3.5.3 Qatar
- 5.3.5.4 South Africa
- 5.3.5.5 Nigeria
- 5.3.5.6 Egypt
- 5.3.5.7 Rest of Middle East and Africa
- 5.3.1 North America
6 Competitive Landscape
- 6.1 Market Concentration
- 6.2 Key Strategic Moves
- 6.3 Market Share Analysis
- 6.4 Company Profiles (includes Global Level Overview, Market Level Overview, Core Segments, Financials as available, Strategic Information, Geographic Coverage, Products and Services, Recent Developments)
- 6.4.1 DHL Group
- 6.4.2 Kuehne+Nagel
- 6.4.3 A.P. Moller - Maersk A/S
- 6.4.4 DSV A/S
- 6.4.5 C.H. Robinson Worldwide, Inc.
- 6.4.6 Expeditors International of Washington, Inc.
- 6.4.7 CMA CGM Group (Including CEVA Logistics)
- 6.4.8 GEODIS
- 6.4.9 Rhenus Group
- 6.4.10 Hellmann Worldwide Logistics
- 6.4.11 NYK Line (Including Yusen Logistics Co., Ltd.)
- 6.4.12 ASCO Group
- 6.4.13 Peterson Energy Logistics
- 6.4.14 ADNOC Logistics and Services plc
- 6.4.15 Gulf Agency Company (GAC)
- 6.4.16 Mammoet Group
- 6.4.17 DP World
- 6.4.18 deugro Group
- 6.4.19 Fracht FWO, Inc.
- 6.4.20 The Bertling Group
7 Market Opportunities and Future Outlook
- 7.1 White-Space and Unmet-Need Assessment

 能源即服務 (EaaS) 市場預測至 2034 年-全球分析(按服務類型、能源來源、經營模式、部署方式、系統容量、合約期限、應用領域、最終用戶和地區分類)
 能源即服務 (EaaS):市場佔有率分析、產業趨勢與統計數據、成長預測 (2026-2031)電力服務公司:市場佔有率分析、產業趨勢與統計、成長預測(2026-2031)
 能源韌性市場-全球產業規模、佔有率、趨勢、機會、預測:按類型、應用、地區和競爭格局分類,2021-2031年
 2026年全球電力服務市場報告能源轉型融資市場預測至2034年-按資金籌措方式、組成部分、能源來源、應用、最終用戶和地區分類的全球分析2026年全球能源物流市場報告
 能源物流市場:2026-2032年全球市場預測(依能源來源、服務類型、最終用戶產業及運輸方式分類)
 能源即服務 (EaaS) 市場規模、佔有率、成長和全球產業分析:按類型、應用和地區分類的洞察,2026-2034 年預測
 能源即服務市場:按服務類型、最終用戶和地區分類