


 |
市場調查報告書
商品編碼
2124323
能源即服務 (EaaS):市場佔有率分析、產業趨勢與統計數據、成長預測 (2026-2031)Energy As A Service (EaaS) - Market Share Analysis, Industry Trends & Statistics, Growth Forecasts (2026 - 2031) |
||||||

※ 本網頁內容可能與最新版本有所差異。詳細情況請與我們聯繫。
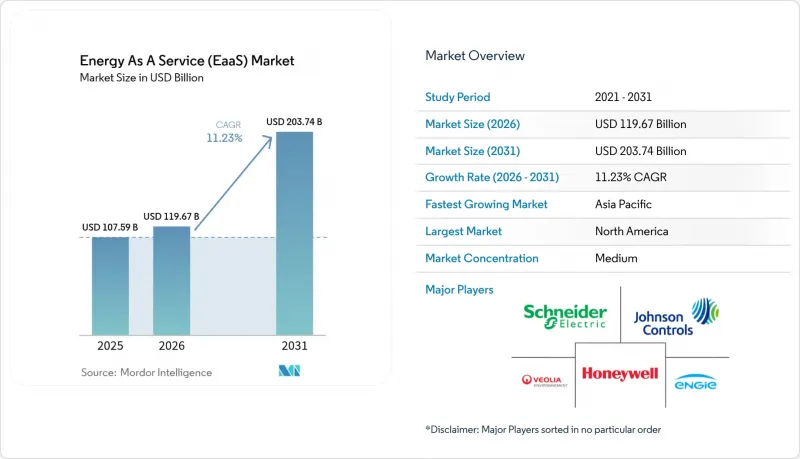
據 Mordor Intelligence 稱,能源即服務 (EaaS) 市場在 2025 年的價值為 1075.9 億美元,預計到 2031 年將達到 2037.4 億美元,而 2026 年為 1196.7 億美元,預測期(2026-2031 年)的複合年成長率為 1.123%(2026-2031 年)的複合年成長率 1.23%。
本報告按服務類型(能源供應服務、微電網即服務、能源基礎設施服務等)、服務交付模式(付費使用制、租賃模式等)、技術(分散式發電、電動車充電基礎設施等)、最終用戶(商業和工業)以及地區(北美、歐洲、亞太地區、南美等)進行分類。
全球能源即服務 (EaaS) 市場趨勢與洞察
企業脫碳義務和來自範圍3的壓力
溫室氣體資訊揭露法規,例如加州的SB 253法案,將要求年收入超過10億美元的公司從2027年開始報告範圍3的排放量,這促使採購部門優先考慮再生能源和檢驗的排放量計算。跨國買家正在將這些要求擴展到其整個供應鏈,從而推動了對結合綠色能源、能源效率和透明報告的承包「能源即服務」(EaaS)市場解決方案的需求。隨著金融機構也將氣候風險納入其貸款決策,企業正將能源服務合約視為一種便利的「能源即服務(EaaS)」市場,為建立更具環保意識的資產負債表鋪平道路。沒有內部永續發展團隊的中型企業受益最大,因為它們可以將技術選擇和監控外包。隨著資訊揭露截止日期的臨近,「能源即服務(EaaS)」市場的潛在客戶群正在所有主要產業中不斷擴大。
電網的不穩定性正在推動微電網的普及應用。
基礎設施老化、極端天氣事件頻繁以及資料中心的擴張正給傳統電網帶來巨大壓力。國際能源總署 (IEA) 估計,到 2040 年,將有 8,000 萬公里的輸電線路需要維修或更換。微電網透過隔離關鍵負載並實現自給自足,從而降低停電風險。加州能源委員會資助的一個試點計畫表明,微電網能夠在停電期間維持電力運作,同時降低 20% 至 60% 的能源成本。如今,企業不再僅僅將微電網視為備用資產,而是將其視為設施管理策略的組成部分,服務供應商也開始根據多年期、基於績效的合約提供微電網服務。監管政策因地區而異,但諸如基於績效的定價和降低併網費用等政策試點正在推動能源即服務 (EaaS) 市場的新需求。
長期合約帶來的鎖定風險令人擔憂
標準的能源效率績效合約期限為5至20年,引發了人們對技術過時和營運柔軟性的擔憂。美國能源局建議進行嚴格的測量和檢驗,以保障客戶利益並為審計做好準備。服務供應商擴大在合約中加入升級和終止條款,這可能導致價格上漲。因此,規避風險的潛在客戶可能會推遲簽訂契約,從而可能降低能源即服務(EaaS)市場的短期成長潛力。
細分市場分析
到2025年,能源供應服務將佔總收入的39.12%,反映出企業優先考慮以具競爭力的價格獲得低碳電力,同時避免管理複雜的採購流程。在該領域,「能源即服務」(EaaS)透過捆綁式購電協議、避險策略和可再生能源證書管理,保持其市場佔有率的主導地位。 「微電網即服務」(Microgrids as a Service)預計到2031年將以14.05%的複合年成長率(CAGR)實現最高成長,因為醫院、機場和製造園區在電網故障時需要孤島模式容錯能力。在電池價格下降和授權程序簡化的推動下,微電網「能源即服務(EaaS)」市場規模預計將在2026年至2031年間成長一倍以上。涵蓋營運維護(O&M)和生命週期升級的服務提供了穩定且持續的收入來源,進一步鞏固了服務提供者的地位。
同時,隨著客戶對發電、儲能和先進控制系統無縫整合的需求日益成長,能源基礎設施服務(工程設計、併網和資產監控)的重要性也與日俱增。 「能源即服務」市場正迎來不斷成長的交叉銷售機會,涵蓋了單一合約下的能源供應、效率最佳化和現場發電。擁有強大軟體平台和覆蓋全國的現場服務團隊的供應商備受青睞,這體現了整合服務所帶來的協同效應。
到2025年,基於服務的合約將佔總收入的39.55%,從而將波動較大的公用事業成本轉化為單一、可預測的月度支出項目。這些合約通常包含績效保證,由於供應商的報酬與實際節省的費用掛鉤,因此增強了客戶的信心。租賃模式正以18.02%的複合年成長率快速發展,其合約期限更短,表外處理也更簡便,因此對租期有限的租戶和物業經理極具吸引力。在能源即服務(EaaS)產業,雖然市政當局偶爾會採用建設-擁有-營運-移交(BOOT)模式以期未來獲得所有權,但訂閱模式在私營部門仍佔據主導地位。與傳統的能源服務公司(ESCO)合約不同,現代基於服務的合約強調模組化附加服務,例如參與需量反應、電動車充電和碳排放報告。
基於績效的合約在公共和機構投資者領域仍然普遍存在,並有法律體制支持,允許從保證的節能收益中分期償還多年。與傳統的能源服務公司(ESCO)合約相比,現代的「按服務付費」合約更注重模組化附加服務,例如參與需量反應、電動車充電和碳排放報告平台。這種演變強化了「能源即服務」市場的定位,使其不再是一次性的維修項目,而是一個擴充性的、技術驅動的解決方案。
區域分析
到2025年,北美將佔全球整體收入的42.18%,這得益於《通貨膨脹控制法案》(IRA)下3700億美元的獎勵策略、省級強制性儲能政策以及成熟的企業採購計劃。溫室氣體減量基金正將低利資金用於扶持弱勢群體,並拓展基本客群,不再侷限於財富500強企業。在加拿大,碳定價和省級清潔能源競標進一步增強了區域發展勢頭。智慧電錶標準的跨境互通性和開放資料政策正在加速參與企業的平台擴充性。
亞太地區正經歷最快成長,預計到2031年複合年成長率將達到16.32%,這反映了該地區快速的都市化和持續的公共部門投資。中國數吉瓦級分散式發電專案和印度電網擴建為承包微電網和儲能解決方案創造了巨大的商機。日本和韓國已實現較高的可再生能源滲透率,並結合先進的預測性維護分析,為東南亞國協樹立了可複製的典範。儘管部分地區的資金籌措成本仍然較高,但混合融資方案和出口信貸支援正在降低風險,並刺激區域能源即服務(EaaS)市場的發展。
歐洲憑藉其「Fit-for-55」脫碳目標,保持相當大的市場佔有率。此目標強制要求高排放企業簽訂可再生能源契約,並提供能源效率保證。統一的資料共用框架簡化了跨國部署,但各成員國在製定使用者側獎勵方面仍擁有自主權,這增加了營運的複雜性。南美洲和中東及非洲地區的市場佔有率正在穩步成長,但在全球整體收入中所佔佔有率仍然不大。儘管外匯波動和政策不確定性阻礙了能源即服務模式的推廣,但摩洛哥日處理量達82.2萬立方米的海水淡化廠(根據35年特許經營契約,結合了太陽能發電和儲能技術)等開創性項目證明了“能源即服務”市場結構在資金籌措的。
其他好處:
- Excel格式的市場預測(ME)表
- 3個月的分析師支持
目錄
第1章:引言
- 研究假設和市場定義
- 調查範圍
第2章:調查方法
第3章執行摘要
第4章 市場狀況
- 市場概覽
- 市場促進因素
- 企業脫碳義務與向範圍3轉型的壓力
- 電網波動性正在推動微電網的普及應用。
- 財富1000強企業設施從資本支出轉向營運支出的轉變
- 人工智慧驅動的能源分析正在提高投資報酬率。
- 《降低通膨法案》及其他綠色資金籌措框架
- 面向工商業(電池與進料組合)的「即服務」電池儲能解決方案的興起
- 市場限制因素
- 對長期合約約束的擔憂
- 關於第三方資產的網路安全責任
- 電錶後獎勵政策的不確定性
- 新興國家能源基礎設施加權平均資本成本不斷上升
- 供應鏈分析
- 監理情勢
- 技術展望
- 波特五力模型
第5章 市場規模與成長預測
- 按服務類型
- 能源供應服務
- 能源效率和最佳化服務
- 營運和維護服務
- 能源基礎設施服務
- 微電網即服務
- 按服務交付模式
- 計量收費(訂閱)
- 基於績效的合約(ESCO/EPC)
- 建設、所有權、營運和移交(BOOT)
- 租賃和出租模式
- 透過技術
- 分散式發電(太陽能發電、風力發電、熱電聯產、燃料電池)
- 儲能(電池儲能和熱能儲能)
- 智慧型能源管理與分析
- 電動車充電基礎設施
- 最終用戶
- 商業設施(資料中心、零售商店/購物中心、醫療設施、教育機構、飯店設施等)
- 工業(重工業、食品飲料加工、化學製藥、採礦冶金等)
- 按地區
- 北美洲
- 美國
- 加拿大
- 墨西哥
- 歐洲
- 德國
- 英國
- 法國
- 義大利
- 北歐國家
- 俄羅斯
- 其他歐洲國家
- 亞太地區
- 中國
- 印度
- 日本
- 韓國
- 東南亞國協
- 其他亞太國家
- 南美洲
- 巴西
- 阿根廷
- 其他南美國家
- 中東和非洲
- 沙烏地阿拉伯
- 阿拉伯聯合大公國
- 南非
- 埃及
- 其他中東和非洲國家
- 北美洲
第6章 競爭情勢
- 市場集中度
- 策略趨勢(併購、聯盟、購電協議)
- 市場佔有率分析(主要公司的市場排名和佔有率)
- 公司簡介
- Schneider Electric SE
- Engie SA
- Honeywell International Inc.
- Veolia Environnement SA
- Electricite de France(EDF)SA
- Johnson Controls International plc
- Bernhard
- Enel SpA
- Sparkfund
- Siemens AG
- ABB Ltd.
- Centrica Business Solutions
- Ameresco
- NRG Energy
- Shell Energy
- Duke Energy Sustainable Solutions
- Orsted A/S
- TotalEnergies
- E.ON SE
- Brookfield Renewable
- Generate Capital
第7章 市場機會與未來展望
According to Mordor Intelligence, the energy as a service market size was valued at USD 107.59 billion in 2025 and estimated to grow from USD 119.67 billion in 2026 to reach USD 203.74 billion by 2031, at a CAGR of 11.23% during the forecast period (2026-2031).
This report is Segmented by Service Type (Energy Supply Services, Microgrid-As-A-Service, Energy Infrastructure Services, and More), Service-Delivery Model (Pay-For-Service, Leasing and Rental Models, and More), Technology (Distributed Generation, EV-Charging Infrastructure, and More), End User (Commercial and Industrial), and Geography (North America, Europe, Asia-Pacific, South America, and More).
Global Energy As A Service (EaaS) Market Trends and Insights
Corporate Decarbonization Mandates & Scope-3 Pressure
Mandatory greenhouse-gas disclosure rules, such as California's SB 253, require firms with revenue exceeding USD 1 billion to report Scope 3 emissions starting in 2027, prompting procurement teams to prioritize renewable electricity and verified emissions accounting. Multinational buyers extend these requirements along their supply chains, amplifying demand for turnkey Energy as a Service market solutions that bundle green power, energy efficiency, and transparent reporting. Financial institutions also factor climate risk into lending decisions, so companies perceive service-based energy contracts as a convenient Energy-as-a-Service market that expands the path to greener balance sheets. Mid-sized enterprises lacking in-house sustainability staff benefit the most, outsourcing both technology selection and monitoring. As disclosure deadlines approach, the addressable customer pool for the Energy as a Service market widens across every major sector.
Grid Volatility Driving Microgrid Adoption
Ageing infrastructure, extreme weather, and data center growth stress legacy grids; the International Energy Agency estimates that 80 million km of power lines will need refurbishment or replacement by 2040. Microgrids mitigate outage risk by allowing critical loads to island and self-supply. Demonstrations funded by the California Energy Commission have shown 20-60% energy cost savings while maintaining uptime during blackouts. Corporations now view microgrids not as backup assets, but as integrated components of their facility management strategies, and service providers supply them under multi-year pay-for-performance contracts. Regulatory treatment varies by jurisdiction, yet policy experimentation-such as performance-based tariffs and reduced interconnection fees-continues to unlock new demand pockets for the Energy as a Service market.
Long-Term Contract Lock-In Concerns
Standard Energy Savings Performance Contracts span 5-20 years, raising anxiety about technology obsolescence and operational flexibility. The U.S. Department of Energy advises rigorous measurement and verification to safeguard customer value and audit readiness. Service providers are increasingly inserting mid-term upgrade clauses or opt-out windows, but these features can raise pricing. Consequently, risk-averse prospects may delay signing, reducing immediate growth potential for the Energy as a Service market.
Other drivers and restraints analyzed in the detailed report include:
- Shift from CAPEX to OPEX in Fortune-1000 Facilities
- AI-Driven Energy Analytics Improving ROI
- Cyber-Security Liabilities on Third-Party Assets
For complete list of drivers and restraints, kindly check the Table Of Contents.
Segment Analysis
Energy Supply Services generated 39.12% of 2025 turnover, reflecting enterprises' priority to secure competitively priced, low-carbon electricity without managing complex procurement processes. Within this segment, the Energy as a Service market share advantage stems from bundled power-purchase arrangements, hedging strategies, and management of renewable certificates. Microgrid-as-a-Service is projected to record the fastest 14.05% CAGR through 2031, as hospitals, airports, and manufacturing parks seek island-mode resiliency during grid disturbances. The Energy as a Service market size for microgrids is projected to more than double between 2026 and 2031, supported by falling battery prices and streamlined permitting. Services covering operations & maintenance, as well as lifecycle upgrades, add sticky recurring revenue streams, further entrenching providers.
In parallel, Energy Infrastructure Services-engineering, interconnection, and asset monitoring-gain importance as clients demand seamless integration of generation, storage, and advanced controls. The Energy as a Service market is seeing rising cross-sell opportunities, where a single contract now spans supply, efficiency optimization, and on-site generation. Providers with deep software stacks and nationwide field service crews command premium valuations, reflecting the synergistic value created by integrated offerings.
Pay-for-service agreements accounted for 39.55% of 2025 revenue, as they transform volatile utility expenses into a single, predictable monthly line item. These contracts typically bundle performance guarantees and align provider compensation with realized savings, reinforcing customer confidence. Leasing & Rental models gain traction at an 18.02% CAGR by offering shorter tenures and simplified off-balance-sheet treatment, which appeals to tenants or property managers with limited lease horizons. While the Energy as a Service industry occasionally employs Build-Own-Operate-Transfer structures for municipalities seeking eventual ownership, subscription plans are the dominant form of private-sector uptake.to legacy ESCO arrangements, modern Pay-for-Service contracts emphasize modular add-ons, such as demand-response participation, electric vehicle charging, and carbon reporting
Performance-based contracts remain prevalent in the public and institutional arena, supported by statutory frameworks that authorize multi-year repayment from guaranteed savings. Compared with legacy ESCO arrangements, modern Pay-for-Service contracts emphasize modular add-ons such as demand-response participation, electric-vehicle charging, and carbon-reporting dashboards. This evolution reinforces the Energy as a Service market's positioning as a scalable, tech-enabled solution rather than a one-off retrofit scheme.
Complete Report Scope:
- By Service Type
- Energy Supply Services
- Energy Efficiency and Optimisation Services
- Operation and Maintenance Services
- Energy Infrastructure Services
- Microgrid-as-a-Service
- By Service-Delivery Model
- Pay-for-Service (Subscription)
- Performance-based Contracting (ESCO/EPC)
- Build-Own-Operate-Transfer (BOOT)
- Leasing and Rental Models
- By Technology
- Distributed Generation (Solar PV, Wind, Combined Heat & Power and Fuel Cells)
- Energy Storage (Battery Storage, and Thermal Storage)
- Smart Energy Management & Analytics
- EV-Charging Infrastructure
- By End User
- Commercial (Data Centres, Retail & Shopping Malls, Healthcare Facilities, Educational Institutions, Hospitality and Others)
- Industrial (Heavy Manufacturing, Food & Beverage Processing, Chemicals & Pharmaceuticals, Mining & Metals and Others)
- By Geography
- North America
- United States
- Canada
- Mexico
- Europe
- Germany
- United Kingdom
- France
- Italy
- NORDIC Countries
- Russia
- Rest of Europe
- Asia-Pacific
- China
- India
- Japan
- South Korea
- ASEAN Countries
- Rest of Asia-Pacific
- South America
- Brazil
- Argentina
- Rest of South America
- Middle East and Africa
- Saudi Arabia
- United Arab Emirates
- South Africa
- Egypt
- Rest of Middle East and Africa
- North America
Geography Analysis
North America retained 42.18% of global revenue in 2025, powered by the IRA's USD 370 billion stimulus, state-level storage mandates, and mature corporate procurement programs. The Greenhouse Gas Reduction Fund steers low-interest capital to disadvantaged communities, broadening the customer base beyond Fortune 500 enterprises. Canada reinforces regional momentum through carbon pricing and provincial clean-energy auctions. Cross-border interoperability of smart-metering standards and open-data policies further accelerates platform scalability for energy-as-a-service market participants.
The Asia-Pacific region records the fastest growth, with a 16.32% CAGR to 2031, reflecting rapid urbanization and sustained public-sector investment. China's multi-gigawatt distributed-generation schemes and India's transmission build-out unlock substantial opportunities for turnkey microgrid and storage offerings. Japan and South Korea deploy high-penetration renewables paired with advanced predictive maintenance analytics, establishing templates that are replicable across ASEAN nations. Although financing costs remain elevated in certain jurisdictions, blended-finance facilities and export-credit support mitigate risk and catalyze the regional Energy-as-a-Service market.
Europe maintains a sizable share, bolstered by the Fit-for-55 decarbonization targets that compel large emitters to contract for renewable power and energy efficiency guarantees. Harmonized data-sharing frameworks simplify multi-country rollouts, though each member state retains discretion over behind-the-meter incentive design, which introduces execution complexity. South America, the Middle East, and Africa together contribute a modest but growing slice of global revenue. Currency volatility and policy uncertainty temper uptake, yet landmark projects-such as Morocco's 822,000 m3/day desalination plant incorporating solar-plus-storage under a 35-year concession-demonstrate feasibility for bankable Energy as a Service market structures
- Schneider Electric SE
- Engie SA
- Honeywell International Inc.
- Veolia Environnement SA
- Electricite de France (EDF) SA
- Johnson Controls International plc
- Bernhard
- Enel SpA
- Sparkfund
- Siemens AG
- ABB Ltd.
- Centrica Business Solutions
- Ameresco
- NRG Energy
- Shell Energy
- Duke Energy Sustainable Solutions
- Orsted A/S
- TotalEnergies
- E.ON SE
- Brookfield Renewable
- Generate Capital
Additional Benefits:
- The market estimate (ME) sheet in Excel format
- 3 months of analyst support
TABLE OF CONTENTS
1 Introduction
- 1.1 Study Assumptions & Market Definition
- 1.2 Scope of the Study
2 Research Methodology
3 Executive Summary
4 Market Landscape
- 4.1 Market Overview
- 4.2 Market Drivers
- 4.2.1 Corporate decarbonisation mandates & Scope-3 pressure
- 4.2.2 Grid volatility driving micro-grid adoption
- 4.2.3 Shift from CAPEX to OPEX in Fortune-1000 facilities
- 4.2.4 AI-driven energy analytics improving ROI
- 4.2.5 Inflation Reduction Act & other green-funding pools
- 4.2.6 Rise of C&I battery storage "as-a-service" offers
- 4.3 Market Restraints
- 4.3.1 Long-term contract lock-in concerns
- 4.3.2 Cyber-security liabilities on third-party assets
- 4.3.3 Policy uncertainty on behind-the-meter incentives
- 4.3.4 Inflated WACC on energy infrastructure in EMs
- 4.4 Supply-Chain Analysis
- 4.5 Regulatory Landscape
- 4.6 Technological Outlook
- 4.7 Porter's Five Forces
- 4.7.1 Bargaining Power of Suppliers
- 4.7.2 Bargaining Power of Buyers
- 4.7.3 Threat of New Entrants
- 4.7.4 Threat of Substitutes
- 4.7.5 Intensity of Rivalry
5 Market Size & Growth Forecasts
- 5.1 By Service Type
- 5.1.1 Energy Supply Services
- 5.1.2 Energy Efficiency and Optimisation Services
- 5.1.3 Operation and Maintenance Services
- 5.1.4 Energy Infrastructure Services
- 5.1.5 Microgrid-as-a-Service
- 5.2 By Service-Delivery Model
- 5.2.1 Pay-for-Service (Subscription)
- 5.2.2 Performance-based Contracting (ESCO/EPC)
- 5.2.3 Build-Own-Operate-Transfer (BOOT)
- 5.2.4 Leasing and Rental Models
- 5.3 By Technology
- 5.3.1 Distributed Generation (Solar PV, Wind, Combined Heat & Power and Fuel Cells)
- 5.3.2 Energy Storage (Battery Storage, and Thermal Storage)
- 5.3.3 Smart Energy Management & Analytics
- 5.3.4 EV-Charging Infrastructure
- 5.4 By End User
- 5.4.1 Commercial (Data Centres, Retail & Shopping Malls, Healthcare Facilities, Educational Institutions, Hospitality and Others)
- 5.4.2 Industrial (Heavy Manufacturing, Food & Beverage Processing, Chemicals & Pharmaceuticals, Mining & Metals and Others)
- 5.5 By Geography
- 5.5.1 North America
- 5.5.1.1 United States
- 5.5.1.2 Canada
- 5.5.1.3 Mexico
- 5.5.2 Europe
- 5.5.2.1 Germany
- 5.5.2.2 United Kingdom
- 5.5.2.3 France
- 5.5.2.4 Italy
- 5.5.2.5 NORDIC Countries
- 5.5.2.6 Russia
- 5.5.2.7 Rest of Europe
- 5.5.3 Asia-Pacific
- 5.5.3.1 China
- 5.5.3.2 India
- 5.5.3.3 Japan
- 5.5.3.4 South Korea
- 5.5.3.5 ASEAN Countries
- 5.5.3.6 Rest of Asia-Pacific
- 5.5.4 South America
- 5.5.4.1 Brazil
- 5.5.4.2 Argentina
- 5.5.4.3 Rest of South America
- 5.5.5 Middle East and Africa
- 5.5.5.1 Saudi Arabia
- 5.5.5.2 United Arab Emirates
- 5.5.5.3 South Africa
- 5.5.5.4 Egypt
- 5.5.5.5 Rest of Middle East and Africa
- 5.5.1 North America
6 Competitive Landscape
- 6.1 Market Concentration
- 6.2 Strategic Moves (M&A, Partnerships, PPAs)
- 6.3 Market Share Analysis (Market Rank/Share for key companies)
- 6.4 Company Profiles (includes Global level Overview, Market level overview, Core Segments, Financials as available, Strategic Information, Products & Services, and Recent Developments)
- 6.4.1 Schneider Electric SE
- 6.4.2 Engie SA
- 6.4.3 Honeywell International Inc.
- 6.4.4 Veolia Environnement SA
- 6.4.5 Electricite de France (EDF) SA
- 6.4.6 Johnson Controls International plc
- 6.4.7 Bernhard
- 6.4.8 Enel SpA
- 6.4.9 Sparkfund
- 6.4.10 Siemens AG
- 6.4.11 ABB Ltd.
- 6.4.12 Centrica Business Solutions
- 6.4.13 Ameresco
- 6.4.14 NRG Energy
- 6.4.15 Shell Energy
- 6.4.16 Duke Energy Sustainable Solutions
- 6.4.17 Orsted A/S
- 6.4.18 TotalEnergies
- 6.4.19 E.ON SE
- 6.4.20 Brookfield Renewable
- 6.4.21 Generate Capital
7 Market Opportunities & Future Outlook
- 7.1 White-space & Unmet-Need Assessment

 能源即服務 (EaaS) 市場:全球市場預測 (2026-2032)
 電力服務公司:市場佔有率分析、產業趨勢與統計、成長預測(2026-2031)
 農村與離網電力供應解決方案市場預測至2034年-全球能源儲存與管理、資金籌措與所有權模式、電力容量、技術、應用與區域分析
 能源韌性市場-全球產業規模、佔有率、趨勢、機會、預測:按類型、應用、地區和競爭格局分類,2021-2031年
 2026年全球電力服務市場報告能源轉型融資市場預測至2034年-按資金籌措方式、組成部分、能源來源、應用、最終用戶和地區分類的全球分析
 2026-2034年全球電力服務公司市場規模、佔有率、趨勢和成長分析報告2026年全球能源物流市場報告能源物流市場:2026-2032年全球市場預測(依能源來源、服務類型、最終用戶產業及運輸方式分類)能源即服務 (EaaS) 市場規模、佔有率、成長和全球產業分析:按類型、應用和地區分類的洞察,2026-2034 年預測