


 |
市場調查報告書
商品編碼
2100032
電力服務公司:市場佔有率分析、產業趨勢與統計、成長預測(2026-2031)Electric Service Companies - Market Share Analysis, Industry Trends & Statistics, Growth Forecasts (2026 - 2031) |
||||||

※ 本網頁內容可能與最新版本有所差異。詳細情況請與我們聯繫。
根據 Mordor Intelligence 預測,電力服務公司的市場規模預計將在 2025 年達到 350 億美元,2026 年達到 372.7 億美元,到 2031 年達到 507.4 億美元,2026 年至 2031 年的複合年成長率為 6.36%。
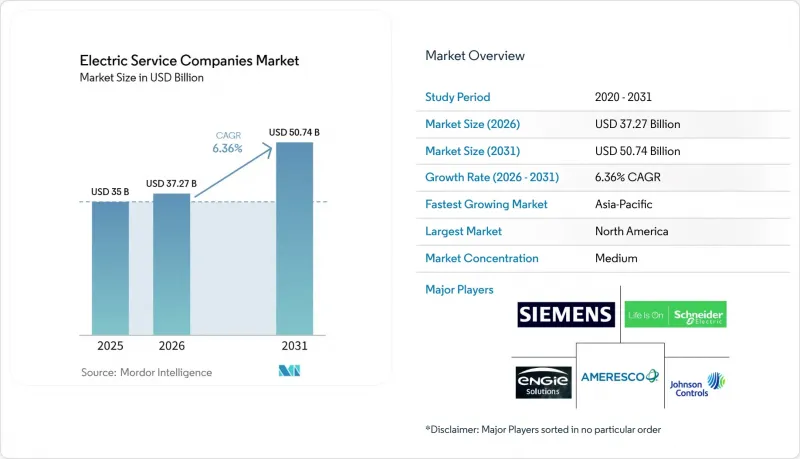
本報告按客戶類型(大型企業和中小企業)、服務模式(EPC、節能保障、能源即服務、維運)、技術(暖通空調、LED、建築管理系統、可再生能源和儲能、電動車充電)、最終用戶(商業、工業、公共/機構和住宅)以及地區進行細分。市場預測以美元計價。
全球電力服務市場趨勢及洞察
快速轉向利用可再生能源的績效合約
Amersco指出,到2025年,美國聯邦政府新合約中太陽能發電和儲能系統的整合率將顯著提高,從2023年的38%上升至62%。這一趨勢凸顯了聯邦計畫中可再生能源解決方案的日益普及。這種將現場太陽能發電系統與電池儲能結合的方案,能夠進一步確保節能,從根本上改變了能源產業的風險分配模式。此方案不僅為建築業主提供了抵禦電網波動的有效保障,還有助於他們實現範圍2減排目標,這對於實現永續性目標至關重要。隨著美國投資稅額扣抵的逐步縮減,相關人員努力在抵免額度減少之前最大限度地提高經濟效益,從而進一步加快專案進度。此外,虛擬電廠(VPP)軟體的引入透過收入多元化創造了新的機會。該軟體能夠實現需量反應的貨幣化,並增加第三種收入來源,從而提高太陽能發電和儲能聯合專案的整體財務可行性。
政府強制資助的零碳維修
公共部門應對氣候變遷的承諾正日益轉向具有約束力的競標,並輔以大量的專款。歐盟已在其「翻新浪潮」舉措下,專門撥款1500億歐元(約1690億美元)用於公共建築的維修。該舉措要求成員國每年維修其總占地面積的3%,旨在提高能源效率並減少全部區域的碳排放。同時,在美國,《通貨膨脹削減法案》設立了270億美元的循環貸款基金。該基金透過延長允許的還款期限來鼓勵更多企業參與,並促使專案集中到已獲得資格並在政府採購平台上註冊的現有企業。這些措施反映出公共部門機構日益致力於透過切實可行的策略來應對氣候變遷。
利率上升會延長能源績效合約的投資回收期。
由於聯準會在2026年上半年維持4.25%至4.50%的政策利率區間,能源服務公司(ESCO)的加權平均資本成本在2025年上升至6.2%。資本成本的上升對財務計算和專案可行性評估產生了重大影響。因此,Ameresco的平均投資回收期從2023年的11.4年延長至2025年的13.7年。更長的投資回收期給相關人員帶來了挑戰,一些市政當局在重新評估其投資的財務可行性和長期效益後,推遲了原定項目。
細分市場分析
從2026年到2031年,中小企業預計將實現9.45%的強勁複合年成長率,反映出中小企業在電力服務市場中日益重要的地位。到2025年,大型企業仍將維持主導地位,佔據電力服務市場46.78%的顯著佔有率。這種成長模式的差異歸因於能源即服務(EaaS)平台的日益普及。這些平台無需傳統的信用審核,使中小企業能夠獲得每月費用低於5000美元的經濟實惠的能源套餐。Schneider Electric專為中小企業設計的EcoStruxure訂閱服務就是這一趨勢的一個顯著例證。這項訂閱服務在年用電支出低於20萬美元的用戶中實現了34%的驚人普及率,凸顯了其對注重成本的企業的吸引力。
中小企業越來越傾向於選擇營運費用契約,因為根據ASC 842會計準則,此類合約符合表外處理的要求。這種方式使中小企業能夠在不影響資產負債表的情況下更有效地管理能源成本。同時,大型企業通常選擇使用自有資金投資於能源效率,從而享受稅收折舊免稅額優惠。在歐洲,區域採購集團透過將數十家中小企業聯合起來簽訂能源即服務(EaaS)主契約,在市場中發揮著至關重要的作用。這種策略不僅擴大了營運規模,而且顯著增強了這些中小企業的議價能力,使它們能夠以更優惠的價格獲得所需的能源。
預計到2025年,能源績效合約將佔據市場主導地位,佔據高達52.14%的收入佔有率,凸顯其在行業中的強勢地位。然而,能源即服務(EaaS)合約正以7.60%的年成長率保持強勁成長,顯示客戶偏好正轉向更靈活、擴充性的解決方案。客戶越來越傾向於可預測的收費結構,這有助於他們避免節能保證合約中常見的計量和檢驗流程的複雜性和爭議。這一趨勢凸顯了市場對能源服務合約透明度和簡化性的日益成長的需求。值得注意的是,Honeywell推出了一款「碳指數掛鉤」產品,該產品將付款與檢驗的減排量直接掛鉤,提供了一種獨特的解決方案,可與企業的ESG(環境、社會和管治)指標無縫銜接。這項創新反映了企業界對永續性和可衡量的環境影響日益重視。
西門子率先推出了「EaaS+」混合模式,該模式將固定基礎費用與利潤分成機制相結合,有效挑戰並重新定義了能源服務市場的傳統分類。這種創新結構既能為客戶提供穩定性,又能讓他們共用經濟利益,使其成為尋求客製化解決方案的企業的理想選擇。同時,專注於營運和維護的合約在市場上佔據了獨特的地位,尤其是在針對超過初始保固期的資產方面。這些合約滿足了老舊基礎設施的持續需求,在確保效率和性能的同時,為資產管理提供了經濟高效的解決方案。
區域分析
到2025年,北美將佔電力服務市場收入的36.41%。這一顯著佔有率得益於聯邦稅額扣抵和現有的績效合約法規,這些政策在推動市場成長方面發揮了關鍵作用。此外,各州能源效率資源標準要求公共產業支援需求面項目,從而確保電力服務公司擁有持續可靠的項目來源。聯邦機構也持續利用成熟的能源服務公司(ESCO)框架,不僅有助於提高營運效率,還能降低實施風險,使其成為能源效率舉措的首選。
歐洲預計到2025年將佔據20%左右的市場佔有率,這主要得益於多項關鍵舉措,包括「翻新浪潮」和「建築能源性能指令」。後者規定,2025年後新建築禁止使用石化燃料供暖,將對市場格局產生重大影響。此外,將於2024年最終確定的動態電網定價機制鼓勵負載轉移,從而促進先進控制系統的應用。此機制獎勵最佳化能源使用的消費者,進一步推動了創新技術和解決方案在全部區域的普及。
預計到2031年,亞太地區將以9.88%的複合年成長率成長,成為全球成長最快的地區。中國的「達峰和碳中和」政策、印度強制部署智慧電錶以及日本為企業提供的購電協議(PPA)獎勵,都在擴大該地區的潛在市場。供應鏈本地化,例如Schneider Electric計劃在印度、越南和印尼建設電池工廠,旨在縮短專案前置作業時間。南美洲以及中東和非洲目前規模較小,但發展勢頭強勁。巴西分散式發電法規和沙烏地阿拉伯的「2030願景」可再生能源目標,正在推動太陽能發電和儲能相結合的承包工程合約的發展。在海灣地區,由於面臨巨大的製冷負荷,擁有區域供冷專業知識的專業能源服務公司(ESCO)在該地區市場佔據優勢。
其他好處:
- Excel格式的市場預測(ME)表
- 3個月的分析師支持
目錄
第1章:引言
- 研究假設和市場定義
- 調查範圍
第2章:調查方法
第3章執行摘要
第4章 市場狀況
- 市場概覽
- 市場促進因素
- 快速轉向利用可再生能源的績效合約
- 政府強制資助的零碳維修
- 商用車輛和倉庫的電氣化
- 獎勵併網建築
- 即時碳定價API推動合約創新
- 人工智慧最佳化的能源即服務 (EaaS) 微型購電協議 (PPA) 捆綁包
- 市場限制因素
- 利率上升延長了EPC(工程、採購和施工)的投資回收期。
- 高效能變壓器供應鏈瓶頸
- 由於擔心個人資訊受到保護,建築物業主反對即時測量。
- 分散式能源資源(DER)資產性能不佳相關的保險除外責任
- 產業價值鏈分析
- 監理情勢
- 技術展望
- 波特五力分析
第5章 市場規模與成長預測
- 依客戶類型
- 大公司
- 中小企業
- 按服務模式
- 能源績效合約(EPC)
- 儲蓄保證合約
- 能源即服務 (EaaS) 訂閱
- 營運與維護 (O&M) 服務
- 透過技術
- 暖通空調和鍋爐維修
- LED和照明控制
- 建築管理和智慧控制
- 現場可再生能源和儲能(光伏、電池儲能系統)
- 電動車充電基礎設施
- 最終用戶
- 商業建築
- 工業設施
- 公共機構
- 住宅(多用戶住宅)
- 按地區
- 北美洲
- 美國
- 加拿大
- 墨西哥
- 南美洲
- 巴西
- 阿根廷
- 其他南美國家
- 歐洲
- 德國
- 英國
- 法國
- 義大利
- 西班牙
- 其他歐洲國家
- 亞太地區
- 中國
- 日本
- 韓國
- 印度
- 澳洲
- 紐西蘭
- 其他亞太國家
- 中東和非洲
- 中東
- 阿拉伯聯合大公國
- 沙烏地阿拉伯
- 土耳其
- 其他中東國家
- 非洲
- 南非
- 奈及利亞
- 肯亞
- 其他非洲國家
- 中東
- 北美洲
第6章 競爭情勢
- 市場集中度
- 策略趨勢
- 市佔率分析
- 公司簡介
- Ameresco Inc.
- ENGIE SA(ENGIE Solutions)
- Siemens Smart Infrastructure
- Johnson Controls International plc
- Schneider Electric SE
- Honeywell International Inc.
- Trane Technologies plc
- Dalkia(EDF Group)
- ABM Industries Inc.
- Noresco LLC
- Energy Systems Group
- OpTerra Energy Services
- ConEdison Solutions
- CLEAResult
- Entegrity Partners
- McKinstry Company
- Alpiq Holding Ltd.
- Veolia Environnement SA
- Iberdrola SA
- Enel X
- NextEra Energy Resources
- Eaton Corporation plc
第7章 市場機會與未來展望
According to Mordor Intelligence, the electric service companies market size is projected to be USD 35 billion in 2025, USD 37.27 billion in 2026, and reach USD 50.74 billion by 2031, growing at a CAGR of 6.36% from 2026 to 2031.
This report is Segmented by Customer Type (Large Enterprises, and SMEs), Service Model (EPC, Guaranteed Savings, Eaas, and O&M), Technology (HVAC, LED, BMS, Renewables and Storage, and EV Charging), End-User (Commercial, Industrial, Public and Institutional, and Residential Multi-Family), and Geography. Market Forecasts are Provided in Terms of Value (USD).
Global Electric Service Companies Market Trends and Insights
Rapid Shift to Renewable-Backed Performance Contracts
In 2025, Ameresco noted a significant rise in the integration of solar-plus-storage components in new U.S. federal contracts, with the percentage increasing to 62% from 38% in 2023. This trend highlights the growing adoption of renewable energy solutions in federal projects. Bundling on-site solar arrays with battery storage, combined with guaranteed savings, is fundamentally reshaping risk allocation in the energy sector. This approach not only provides building owners with a reliable hedge against grid volatility but also supports them in meeting their Scope 2 emissions reduction targets, which are critical for sustainability goals. The impending step-down of the U.S. Investment Tax Credit is further driving the acceleration of project timelines, as stakeholders aim to maximize the financial benefits before the credit diminishes. Furthermore, the introduction of virtual-power-plant software is creating additional opportunities by diversifying revenue streams. This software enables the monetization of demand-response, adding a third revenue source and enhancing the overall financial viability of solar-plus-storage projects.
Government-Funded Zero-Carbon Retrofit Mandates
Public-sector climate pledges are increasingly transforming into binding tenders, supported by substantial dedicated capital pools. Under its Renovation Wave initiative, the European Union has allocated EUR 150 billion (USD 169 billion) specifically for public-building upgrades.This initiative requires member states to refurbish 3% of their total floor area annually, aiming to enhance energy efficiency and reduce carbon emissions across the region. Meanwhile, in the United States, the Inflation Reduction Act has established a USD 27 billion revolving loan fund. This fund extends acceptable payback windows, thereby encouraging greater participation and driving project volume toward incumbents already qualified and listed on government procurement platforms. These measures reflect a growing commitment by public-sector entities to address climate change through actionable and enforceable strategies.
Rising Interest-Rate Environment Inflates EPC Payback Periods
As the U.S. Federal Reserve maintained its policy band at 4.25%-4.50% through H1 2026, the weighted average cost of capital for ESCO climbed to 6.2% in 2025. This increase in the cost of capital significantly impacted financial calculations and project feasibility assessments. Consequently, Ameresco experienced an extension in its average payback period, which grew from 11.4 years in 2023 to 13.7 years in 2025. This prolonged payback period created challenges for stakeholders, leading some municipalities to postpone their planned projects, as they reassessed the financial viability and long-term benefits of these investments.
Other drivers and restraints analyzed in the detailed report include:
- Electrification of Commercial Fleets and Depots
- Grid-Interactive Buildings Incentives
- Supply-Chain Bottlenecks for High-Efficiency Transformers
For complete list of drivers and restraints, kindly check the Table Of Contents.
Segment Analysis
Between 2026 and 2031, small and medium enterprises are projected to achieve a robust CAGR of 9.45%, reflecting their growing role in the Electric Service Companies market. In 2025, large enterprises maintained a dominant position, capturing a significant 46.78% share of the Electric Service Companies market. This divergence in growth patterns can be attributed to the increasing adoption of Energy-as-a-Service (EaaS) platforms. These platforms eliminate the need for traditional credit checks, thereby enabling SMEs to access affordable energy packages priced below USD 5,000 per month. A notable example of this trend is Schneider Electric's EcoStruxure subscription, which is specifically designed for SMEs. This subscription achieved an impressive 34% attach rate among users whose annual electricity expenditure was under USD 200,000, highlighting its appeal to cost-conscious businesses.
SMEs are increasingly favoring operating-expense contracts, as these qualify for off-balance-sheet treatment under the ASC 842 accounting standard. This approach allows SMEs to manage their energy costs more effectively without impacting their balance sheets. On the other hand, large enterprises often choose to self-finance their energy upgrades, enabling them to take advantage of tax depreciation benefits. In Europe, regional buying groups are playing a pivotal role in the market by aggregating dozens of SMEs under master EaaS agreements. This strategy not only enhances the scale of operations but also significantly improves the negotiating power of these SMEs, allowing them to secure better terms and pricing for their energy needs.
In 2025, energy performance contracting dominated the market with a significant 52.14% revenue share, showcasing its strong position in the industry. However, EaaS (Energy-as-a-Service) subscriptions are experiencing a robust annual growth rate of 7.60%, indicating a shift in client preferences toward more flexible and scalable solutions. Clients are increasingly favoring predictable billing structures, which help them avoid the complexities and disputes often associated with measurement-and-verification processes in guaranteed-savings agreements. This trend highlights the growing demand for transparency and simplicity in energy service contracts. In a notable move, Honeywell introduced a carbon-indexed product that ties payments directly to verified emission reductions, offering a unique solution that aligns seamlessly with corporate ESG (Environmental, Social, and Governance) metrics. This innovation reflects the increasing emphasis on sustainability and measurable environmental impact within the corporate sector.
Siemens is pioneering a hybrid approach with its EaaS-plus model, which combines a fixed base fee with profit-sharing mechanisms, effectively challenging and redefining traditional categorizations in the energy services market. This innovative structure provides clients with both stability and the potential for shared financial benefits, making it an attractive option for businesses seeking customized solutions. Meanwhile, operation-and-maintenance-only contracts have carved out a niche in the market, specifically catering to assets that have moved beyond their initial guarantee periods. These contracts address the ongoing needs of aging infrastructure, ensuring continued efficiency and performance while offering a cost-effective solution for asset management.
Complete Report Scope:
- By Customer Type
- Large Enterprises
- Small and Medium Enterprises (SMEs)
- By Service Model
- Energy Performance Contracting (EPC)
- Guaranteed Savings Contracts
- Energy-as-a-Service (EaaS) Subscriptions
- Operation and Maintenance (O&M) Services
- By Technology Offering
- HVAC and Boiler Upgrades
- LED and Lighting Controls
- Building Management and Smart Controls
- On-Site Renewable and Storage (PV, BESS)
- EV Charging Infrastructure
- By End-User Sector
- Commercial Buildings
- Industrial Facilities
- Public and Institutional
- Residential Multi-Family
- By Geography
- North America
- United States
- Canada
- Mexico
- South America
- Brazil
- Argentina
- Rest of South America
- Europe
- Germany
- United Kingdom
- France
- Italy
- Spain
- Rest of Europe
- Asia Pacific
- China
- Japan
- South Korea
- India
- Australia
- New Zealand
- Rest of Asia-Pacific
- Middle East and Africa
- Middle East
- United Arab Emirates
- Saudi Arabia
- Turkey
- Rest of Middle East
- Africa
- South Africa
- Nigeria
- Kenya
- Rest of Africa
- Middle East
- North America
Geography Analysis
In 2025, North America accounted for 36.41% of the revenue in the Electric Service Companies market. This significant share was bolstered by federal tax credits and well-established performance-contracting statutes, which have been instrumental in driving market growth. Additionally, state energy-efficiency resource standards mandate utilities to support demand-side programs, ensuring a consistent and reliable pipeline of projects for Electric Service Companies. Furthermore, federal agencies continue to rely on proven ESCO frameworks, which not only streamline operations but also help in reducing execution risks, making them a preferred choice for energy efficiency initiatives.
Europe, capturing a share in the mid-20s range in 2025, was propelled by several key initiatives, including the Renovation Wave and the Energy Performance of Buildings Directive. The latter mandates a ban on fossil-fuel heating in newly constructed buildings post-2025, which has significantly influenced the market landscape. Moreover, dynamic grid tariffs, which were finalized in 2024, now incentivize load shifting, thereby encouraging the adoption of advanced control systems. These tariffs reward consumers for optimizing energy usage, further driving the deployment of innovative technologies and solutions across the region.
Asia-Pacific is forecast to grow at a 9.88% CAGR through 2031, the fastest worldwide. China's dual-carbon policy, India's smart-meter mandates, and Japan's corporate PPA incentives expand the regional addressable market. Supply-chain localization, such as Schneider Electric's planned battery plants in India, Vietnam, and Indonesia, aims to curb project lead times. South America and the Middle East and Africa are smaller today yet gaining traction. Brazil's distributed generation rules and Saudi Arabia's Vision 2030 renewable goals spur turnkey solar-plus-storage contracts. District-cooling know-how gives specialized ESCOs an edge in Gulf markets facing extreme cooling loads.
- Ameresco Inc.
- ENGIE SA (ENGIE Solutions)
- Siemens Smart Infrastructure
- Johnson Controls International plc
- Schneider Electric SE
- Honeywell International Inc.
- Trane Technologies plc
- Dalkia (EDF Group)
- ABM Industries Inc.
- Noresco LLC
- Energy Systems Group
- OpTerra Energy Services
- ConEdison Solutions
- CLEAResult
- Entegrity Partners
- McKinstry Company
- Alpiq Holding Ltd.
- Veolia Environnement SA
- Iberdrola SA
- Enel X
- NextEra Energy Resources
- Eaton Corporation plc
Additional Benefits:
- The market estimate (ME) sheet in Excel format
- 3 months of analyst support
TABLE OF CONTENTS
1 INTRODUCTION
- 1.1 Study Assumptions and Market Definition
- 1.2 Scope of the Study
2 RESEARCH METHODOLOGY
3 EXECUTIVE SUMMARY
4 MARKET LANDSCAPE
- 4.1 Market Overview
- 4.2 Market Drivers
- 4.2.1 Rapid Shift to Renewable-Backed Performance Contracts
- 4.2.2 Government-Funded Zero-Carbon Retrofit Mandates
- 4.2.3 Electrification of Commercial Fleets and Depots
- 4.2.4 Grid-Interactive Buildings Incentives
- 4.2.5 Real-Time Carbon-Pricing APIs Drive Contract Innovation
- 4.2.6 AI-Optimised Energy-as-a-Service Micro-PPA Bundles
- 4.3 Market Restraints
- 4.3.1 Rising Interest-Rate Environment Inflates EPC Payback Periods
- 4.3.2 Supply-Chain Bottlenecks for High-Efficiency Transformers
- 4.3.3 Building Owner Data-Privacy Pushback on Real-Time Metering
- 4.3.4 Insurance Exclusions on Performance Shortfall for DER Assets
- 4.4 Industry Value-Chain Analysis
- 4.5 Regulatory Landscape
- 4.6 Technological Outlook
- 4.7 Porter's Five Forces Analysis
- 4.7.1 Bargaining Power of Buyers
- 4.7.2 Bargaining Power of Suppliers
- 4.7.3 Threat of New Entrants
- 4.7.4 Threat of Substitutes
- 4.7.5 Competitive Rivalry
5 MARKET SIZE AND GROWTH FORECASTS (VALUE)
- 5.1 By Customer Type
- 5.1.1 Large Enterprises
- 5.1.2 Small and Medium Enterprises (SMEs)
- 5.2 By Service Model
- 5.2.1 Energy Performance Contracting (EPC)
- 5.2.2 Guaranteed Savings Contracts
- 5.2.3 Energy-as-a-Service (EaaS) Subscriptions
- 5.2.4 Operation and Maintenance (O&M) Services
- 5.3 By Technology Offering
- 5.3.1 HVAC and Boiler Upgrades
- 5.3.2 LED and Lighting Controls
- 5.3.3 Building Management and Smart Controls
- 5.3.4 On-Site Renewable and Storage (PV, BESS)
- 5.3.5 EV Charging Infrastructure
- 5.4 By End-User Sector
- 5.4.1 Commercial Buildings
- 5.4.2 Industrial Facilities
- 5.4.3 Public and Institutional
- 5.4.4 Residential Multi-Family
- 5.5 By Geography
- 5.5.1 North America
- 5.5.1.1 United States
- 5.5.1.2 Canada
- 5.5.1.3 Mexico
- 5.5.2 South America
- 5.5.2.1 Brazil
- 5.5.2.2 Argentina
- 5.5.2.3 Rest of South America
- 5.5.3 Europe
- 5.5.3.1 Germany
- 5.5.3.2 United Kingdom
- 5.5.3.3 France
- 5.5.3.4 Italy
- 5.5.3.5 Spain
- 5.5.3.6 Rest of Europe
- 5.5.4 Asia Pacific
- 5.5.4.1 China
- 5.5.4.2 Japan
- 5.5.4.3 South Korea
- 5.5.4.4 India
- 5.5.4.5 Australia
- 5.5.4.6 New Zealand
- 5.5.4.7 Rest of Asia-Pacific
- 5.5.5 Middle East and Africa
- 5.5.5.1 Middle East
- 5.5.5.1.1 United Arab Emirates
- 5.5.5.1.2 Saudi Arabia
- 5.5.5.1.3 Turkey
- 5.5.5.1.4 Rest of Middle East
- 5.5.5.2 Africa
- 5.5.5.2.1 South Africa
- 5.5.5.2.2 Nigeria
- 5.5.5.2.3 Kenya
- 5.5.5.2.4 Rest of Africa
- 5.5.5.1 Middle East
- 5.5.1 North America
6 COMPETITIVE LANDSCAPE
- 6.1 Market Concentration
- 6.2 Strategic Moves
- 6.3 Market Share Analysis
- 6.4 Company Profiles (includes Global Level Overview, Market Level Overview, Core Segments, Financials as available, Strategic Information, Market Rank/Share, Products and Services, Recent Developments)
- 6.4.1 Ameresco Inc.
- 6.4.2 ENGIE SA (ENGIE Solutions)
- 6.4.3 Siemens Smart Infrastructure
- 6.4.4 Johnson Controls International plc
- 6.4.5 Schneider Electric SE
- 6.4.6 Honeywell International Inc.
- 6.4.7 Trane Technologies plc
- 6.4.8 Dalkia (EDF Group)
- 6.4.9 ABM Industries Inc.
- 6.4.10 Noresco LLC
- 6.4.11 Energy Systems Group
- 6.4.12 OpTerra Energy Services
- 6.4.13 ConEdison Solutions
- 6.4.14 CLEAResult
- 6.4.15 Entegrity Partners
- 6.4.16 McKinstry Company
- 6.4.17 Alpiq Holding Ltd.
- 6.4.18 Veolia Environnement SA
- 6.4.19 Iberdrola SA
- 6.4.20 Enel X
- 6.4.21 NextEra Energy Resources
- 6.4.22 Eaton Corporation plc
7 MARKET OPPORTUNITIES AND FUTURE OUTLOOK
- 7.1 White-Space and Unmet-Need Assessment

 能源即服務 (EaaS):市場佔有率分析、產業趨勢與統計數據、成長預測 (2026-2031)
 能源即服務 (EaaS) 市場:全球市場預測 (2026-2032)
 農村與離網電力供應解決方案市場預測至2034年-全球能源儲存與管理、資金籌措與所有權模式、電力容量、技術、應用與區域分析
 能源韌性市場-全球產業規模、佔有率、趨勢、機會、預測:按類型、應用、地區和競爭格局分類,2021-2031年
 2026年全球電力服務市場報告能源轉型融資市場預測至2034年-按資金籌措方式、組成部分、能源來源、應用、最終用戶和地區分類的全球分析
 2026-2034年全球電力服務公司市場規模、佔有率、趨勢和成長分析報告2026年全球能源物流市場報告能源物流市場:2026-2032年全球市場預測(依能源來源、服務類型、最終用戶產業及運輸方式分類)能源即服務 (EaaS) 市場規模、佔有率、成長和全球產業分析:按類型、應用和地區分類的洞察,2026-2034 年預測