

 |
市場調查報告書
商品編碼
2125581
海底電纜系統:市場佔有率分析、產業趨勢與統計、成長預測(2026-2031)Submarine Cable Systems - Market Share Analysis, Industry Trends & Statistics, Growth Forecasts (2026 - 2031) |
||||||

※ 本網頁內容可能與最新版本有所差異。詳細情況請與我們聯繫。
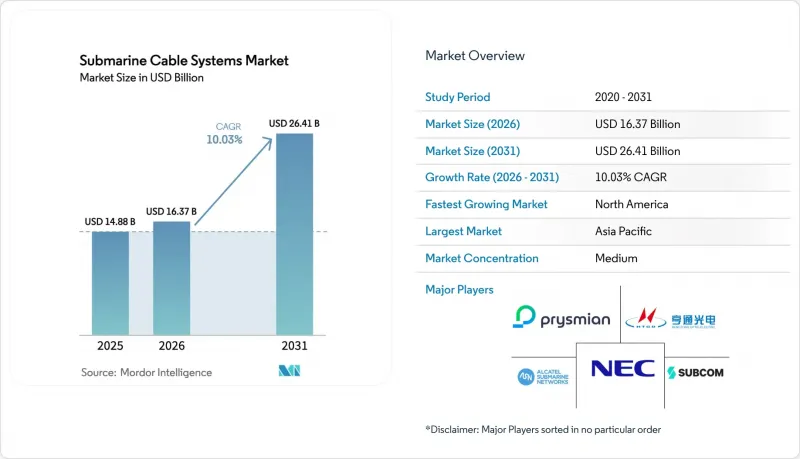
據 Mordor Intelligence 稱,2025 年海底電纜系統市值為 148.8 億美元,預計到 2031 年將達到 264.1 億美元,而 2026 年為 163.7 億美元,預測期內(2026-2031 年)的複合年成長率預計為 10.03%。
本報告按類型(濕式設備產品、乾式設備產品)、所有權類型(多所有者系統、單一所有者系統、多邊開發銀行支援的系統)、應用(電信和網際網路骨幹網、離岸風力發電電纜和陣列電纜等)、光纖對數(少於 8 對、9-16 對或更多)和地區對行業進行分類。
全球海底電纜系統市場趨勢及洞察
超大規模資料中心業者主導頻寬需求激增
人工智慧 (AI) 工作負載和即時雲端應用日益成長的容量需求促使Google和 Meta 等公司自費建設跨洋系統。谷歌的「太平洋連接」計劃,以 Proa 和 Taihei 兩條海底光纜為特色,透過建立多太Terabit跨太平洋鏈路,無需依賴營運商聯盟,便體現了這一轉變。 Meta 的「沃特沃斯計畫」正在五大洲建設一個 5 萬公里的網路,使用 24 對光纖,凸顯了超大規模資料中心業者營運商對控制和快速升級路徑的重視。這些專案正在加速部署進程,並推動空間分割復用 (SDM) 架構的標準化,目前已佔 2021 年以來全球新建設專案的近一半。
快速建造海底電纜,以改善新興地區的互聯互通
隨著區域電信營運商、開發銀行和雲端服務供應商共同出資建造高容量線路,非洲和東南亞的數位基礎設施差距正在縮小。 OMS集團的MIST海底光纜容量超過216Tbps,計畫於2027年連接印度、馬來西亞、新加坡和泰國。 2024年西非發生的通訊中斷暴露了單點故障的問題,促使各國政府支持冗餘線路的建設並承擔快速維修服務的費用。這增加了對更多海底設備和海底鋪設船的長期需求。
有關數據主權的法律法規使獲得著陸許可變得複雜。
美國聯邦通訊委員會(FCC)對海底電纜法規的修訂要求每三年報告一次所有權和安全措施,並收緊了新登陸點的核准流程。印度和印尼類似的在地化資料法規要求在國內進行流量終止,這迫使網路架構重新設計,從而增加了網路複雜性和成本。
細分市場分析
2025年,用於海底光纜系統的齒輪中繼器、分支單元和SDM相容光放大器佔總銷售額的67.65%。預計到2031年,隨著電信業者傾向於採用依賴先進再生電子技術的超長距離線路,該細分市場將以10.62%的複合年成長率成長。海底光纜系統市場中海底光纜產品的市場規模預計將在2025年達到100.7億美元,並在本世紀末達到184.5億美元。高技術准入門檻保護了現有營運商,即使組件成本上升,也能確保價格穩定。
智慧型濕式設備產品,例如ASN的SMART光纜(整合海底氣候感測器),正在為多家機構開闢新的資金籌措管道。陸上終端和供電設備等乾式設備佔據了剩餘的市場佔有率,但隨著超大規模資料中心業者開始設計自己的陸上站硬體,其利潤率正面臨壓力。透過開放式電纜舉措實現的標準化進一步削弱了專有技術在乾式設備領域的優勢。
到2025年,以傳統電信業者跨大西洋鏈路合作為核心的聯合體項目仍將佔據最大佔有率,達到54.12%。然而,在雲端服務提供者資本支出(CAPEX)策略的支持下,單一所有者專案正以13.32%的複合年成長率(CAGR)快速成長。預計到2025年,分配給單一所有者建設的海底光纜系統市場規模將達到68.3億美元,並預計在2031年成長至144.6億美元,這反映出單一所有者建設項目雄心勃勃的發展藍圖。
單一所有權系統加快了決策週期,支援客製化的SDM設計,可容納超過32對光纖,並創造了新的容量記錄。在開發銀行的支持下,這些系統雖然規模較小,卻能為非洲和太平洋島嶼等對價格敏感的地區提供網路連接,在這些地區,僅靠商業性收入不足以滿足需求,而降低公共部門風險至關重要。
區域分析
預計到2025年,北美將佔全球銷售額的29.12%,這主要得益於超大規模資料中心業者資料中心(尤其是美國)的活躍發展以及SDM架構的早期應用。諸如「太平洋連接」(Pacific Connect)和24對「Bifrost」系統等項目,使跨太平洋走廊在產能擴張方面處於領先地位。國內採購法規正在推動國內製造業的發展,預計總合2027年,對LS Cable位於維吉尼亞的工廠和Prysmian位於馬裡蘭州的工廠的投資將使核心導體年產量增加25,000噸以上。
亞太地區是成長最快的地區,複合年成長率達12.45%。預計到2024年,中國承包商將交付超過10萬公里的濕式設備,並爭取2025年佔60%的全球市場佔有率。印度正透過「印度-亞洲快線」轉型為區域樞紐,同時與日本和美國的雲端公司建立合作關係,將著陸點拓展至密克羅尼西亞和關島。東南亞國協數位經濟指數的提升,至少在未來十年內,保證了多條航線的需求。
推動歐洲市場發展的兩大驅動力是:離岸風力發電大型企劃和多吉瓦級能源互聯專案。光是東部綠色連接2號計畫就鋪設了500公里長的525千伏電纜,預計2029年開始運作。中東和非洲受益於其作為洲際樞紐的戰略位置,非洲的東-西海底光纜計畫正從開發銀行獲得融資,以減少對單一線路的依賴。南美洲雖然規模較小,但仍是具有重要戰略意義的地區。谷歌的洪堡海底光纜將成為第一條從南太平洋直達亞洲的線路,重塑智利的電信模式。
其他好處:
- Excel格式的市場預測(ME)表
- 3個月的分析師支持
目錄
第1章:引言
- 研究假設和市場定義
- 調查範圍
第2章:調查方法
第3章執行摘要
第4章 市場狀況
- 市場概覽
- 市場促進因素
- 超大規模資料中心業者主導頻寬需求激增
- 連接新興地區的電纜鋪設工作進展迅速
- 離岸風力發電電場輸電電纜的需求正在激增。
- SDM 32 光纖對技術降低了每 1Tb 的成本。
- 重複利用廢棄電纜,提高服務不足島嶼的電力韌性。
- 為回頭客提供低碳、低損失的綠色金融獎勵
- 市場限制因素
- 有關數據主權的法律法規使獲得著陸許可變得複雜。
- 對根供應商的地緣政治否決權
- 近岸航運路線許可證核准時間過長,以及對 ESG(環境、社會和治理)議題的強烈反對。
- 全球光纖中繼器供應鏈正面臨壓力。
- 重要法規結構的評估
- 價值鏈分析
- 技術展望
- 波特五力模型
- 對關鍵相關人員的影響評估
- 主要用例和案例研究
- 宏觀經濟因素對市場的影響
- 投資分析
第5章 市場區隔
- 按類型
- 濕植物產品
- 乾燥植物產品
- 依所有權類型
- 聯合體/多元所有權制度
- 單一所有製
- 多邊開發銀行支援系統
- 透過使用
- 通訊及網際網路骨幹網
- 用於離岸風力發電的輸電電纜和陣列電纜
- 石油和天然氣海底發電/通訊
- 政府和國防部門的監管
- 科學與研究網路
- 按纖維對數
- 8對或更少光纖
- 9-16對光纖
- 17-24對光纖
- 25對或更多光纖(SDM)
- 按地區
- 北美洲
- 美國
- 加拿大
- 墨西哥
- 南美洲
- 巴西
- 阿根廷
- 其他南美國家
- 歐洲
- 英國
- 德國
- 法國
- 義大利
- 西班牙
- 北歐的
- 其他歐洲國家
- 中東和非洲
- 中東
- 沙烏地阿拉伯
- 阿拉伯聯合大公國
- 土耳其
- 其他中東國家
- 非洲
- 南非
- 埃及
- 奈及利亞
- 其他非洲國家
- 中東
- 亞太地區
- 中國
- 印度
- 日本
- 韓國
- ASEAN
- 澳洲
- 紐西蘭
- 其他亞太國家
- 北美洲
第6章 競爭情勢
- 市場集中度
- 策略趨勢
- 市佔率分析
- 公司簡介
- Alcatel Submarine Networks SAS
- NEC Corporation
- Prysmian SpA(Submarine Telecom and Power Cables BU)
- SubCom, LLC
- Hengtong Optic-Electric Co., Ltd.
- HMN Tech Co., Ltd.(Huawei Marine)
- Nexans SA
- Fujitsu Limited
- NTT Communications Corporation
- Google LLC
- Sumitomo Electric Industries, Ltd.
- Global Marine Systems Limited
- Orange Marine SAS
- JDR Cable Systems Ltd.
- Zhongtian Technology Submarine Cable Co., Ltd.
- BW Digital Pte. Ltd.(Hawaiki)
- Padtec Holding SA
- Xtera, Inc.
- Orient Cable(NBO)Co., Ltd.
- Cable and Wireless Marine Service Ltd.
第7章 市場機會與未來展望
According to Mordor Intelligence, the submarine cable systems market size was valued at USD 14.88 billion in 2025 and estimated to grow from USD 16.37 billion in 2026 to reach USD 26.41 billion by 2031, at a CAGR of 10.03% during the forecast period (2026-2031).
This report Segments the Industry Into by Type (Wet-Plant Products, and Dry-Plant Products), Ownership Type (Multiple-Ownership System, Single-Ownership System, and Multilateral Development-Bank-Backed System), Application (Telecom and Internet Backbone, Offshore Wind Power Export and Array Cables, and More), Fiber-Pair Count (Less Than 8 Fiber Pairs, 9 - 16 Fiber Pairs, and More), and Geography.
Global Submarine Cable Systems Market Trends and Insights
Hyperscaler-led bandwidth demand boom
Capacity requirements for artificial-intelligence workloads and real-time cloud applications have propelled companies such as Google and Meta to self-fund trans-oceanic systems. Google's Pacific Connect program, featuring the Proa and Taihei cables, exemplifies this shift by adding multi-terabit links across the Pacific without operator consortia. Meta's Project Waterworth spans 50,000 km over five continents with 24 fiber pairs, underscoring hyperscalers' preference for control and rapid upgrade paths. These projects accelerate deployment schedules, standardize SDM architectures, and now represent almost half of all new global builds initiated since 2021.
Rapid cable construction for emerging-region connectivity
The digital-infrastructure gap in Africa and Southeast Asia is narrowing as regional operators, development banks, and cloud providers co-finance high-capacity routes. OMS Group's MIST cable exceeds 216 Tbps and links India, Malaysia, Singapore, and Thailand by 2027. West-Africa outages in 2024 exposed single-point failures, prompting governments to back redundancy corridors and pay for expedited repair services, thereby lifting long-term demand for additional wet-plant units and marine-installation vessels.
Data-sovereignty legislation complicates landing licences
Revisions to the United States Federal Communications Commission submarine-line rules now mandate three-year reporting of ownership and security practices, tightening the approval window for new landings. Parallel data-localization statutes in India and Indonesia require in-country traffic termination, forcing architectural redesigns that elevate network complexity and cost.
Other drivers and restraints analyzed in the detailed report include:
- Offshore wind-farm export-cable surge
- SDM and >=32-fiber-pair technology lowering USD /Tb costs
- Global fiber and repeater supply-chain crunch
For complete list of drivers and restraints, kindly check the Table Of Contents.
Segment Analysis
Wet-plant gear-repeaters, branching units, and SDM-ready optical amplifiers-accounted for 67.65% revenue in 2025. This sub-segment is projected to climb at a 10.62% CAGR through 2031 as operators favor ultra-long-haul routes that rely on sophisticated regeneration electronics. The submarine cable systems market size for wet-plant products translates to USD 10.07 billion in 2025 and is on track for USD 18.45 billion by the decade's close. High engineering barriers shelter incumbents, delivering stable pricing even as component costs rise.
Intelligent wet-plant offerings such as ASN's SMART cable-with integrated seafloor climate sensors-open new multi-agency funding channels. Dry-plant equipment, covering shore-end terminals and power-feed equipment, captures the balance but endures margin compression as hyperscalers design in-house landing-station hardware. Standardization by the Open Cable initiative further dilutes proprietary advantages in the dry-segment.
Consortium projects remained the largest share contributor at 54.12% in 2025, anchored by traditional carrier collaborations on trans-Atlantic links. Nevertheless, single-ownership ventures are expanding fastest at a 13.32% CAGR, underpinned by cloud-provider CAPEX strategies. The submarine cable systems market size allocated to single-owner builds is estimated at USD 6.83 billion in 2025, climbing to USD 14.46 billion by 2031, a reflection of aggressive self-build roadmaps.
Single-party control accelerates decision cycles and permits bespoke SDM designs with >32 fiber pairs, charting new capacity highs. Development-bank-backed systems, although small in volume, unlock connectivity for price-sensitive African and Pacific Island corridors where commercial returns alone are inadequate and where public-sector de-risking is essential.
Complete Report Scope:
- By Type
- Wet-Plant Products
- Dry-Plant Products
- By Ownership Type
- Consortium / Multiple-Ownership System
- Single-Ownership (Private) System
- Multilateral Development-Bank-Backed System
- By Application
- Telecom and Internet Backbone
- Offshore Wind Power Export and Array Cables
- Oil and Gas Subsea Power / Comms
- Government and Defense Surveillance
- Scientific and Research Networks
- By Fiber-Pair Count
- Less Than 8 Fiber Pairs
- 9 - 16 Fiber Pairs
- 17 - 24 Fiber Pairs
- ? 25 Fiber Pairs (SDM)
- By Geography
- North America
- United States
- Canada
- Mexico
- South America
- Brazil
- Argentina
- Rest of South America
- Europe
- United Kingdom
- Germany
- France
- Italy
- Spain
- Nordics
- Rest of Europe
- Middle East and Africa
- Middle East
- Saudi Arabia
- United Arab Emirates
- Turkey
- Rest of Middle East
- Africa
- South Africa
- Egypt
- Nigeria
- Rest of Africa
- Middle East
- Asia-Pacific
- China
- India
- Japan
- South Korea
- ASEAN
- Australia
- New Zealand
- Rest of Asia-Pacific
- North America
Geography Analysis
North America commanded 29.12% of global revenue in 2025, driven by US-centric hyperscaler activity and the early adoption of SDM architecture. Projects such as Pacific Connect and the 24-pair Bifrost system keep trans-Pacific corridors at the forefront of capacity upgrades. Domestic content rules encourage onshore manufacturing; LS Cable's Virginia site and Prysmian's Maryland investment will collectively add more than 25,000 t of annual core-conductor output by 2027.
Asia-Pacific represents the fastest-growing region with a 12.45% CAGR. China's contractors delivered over 100,000 km of wet-plant in 2024, chasing a 60% global share target by 2025. India is pivoting into a regional hub through the India-Asia Xpress, while Japan's alliances with US cloud firms bring landing diversity to Micronesia and Guam. Rising digital-economy indices across ASEAN economies guarantee multi-route demand for at least the next decade.
The twin engines of offshore-wind megaprojects and multi-gigawatt energy interconnectors buoy Europe's market. The Eastern Green Link 2 alone will lay 500 km of 525 kV cable and is expected online in 2029. Middle East and Africa benefit from strategic junction status between continents; Africa's East2West cable plan secures development-bank finance to reduce single-route exposure. South America remains small yet strategic: Google's Humboldt cable will offer the first direct South-Pacific link to Asia, reshaping Chile's connectivity map.
- Alcatel Submarine Networks SAS
- NEC Corporation
- Prysmian S.p.A. (Submarine Telecom and Power Cables BU)
- SubCom, LLC
- Hengtong Optic-Electric Co., Ltd.
- HMN Tech Co., Ltd. (Huawei Marine)
- Nexans S.A.
- Fujitsu Limited
- NTT Communications Corporation
- Google LLC
- Sumitomo Electric Industries, Ltd.
- Global Marine Systems Limited
- Orange Marine S.A.S.
- JDR Cable Systems Ltd.
- Zhongtian Technology Submarine Cable Co., Ltd.
- BW Digital Pte. Ltd. (Hawaiki)
- Padtec Holding S.A.
- Xtera, Inc.
- Orient Cable (NBO) Co., Ltd.
- Cable and Wireless Marine Service Ltd.
Additional Benefits:
- The market estimate (ME) sheet in Excel format
- 3 months of analyst support
TABLE OF CONTENTS
1 INTRODUCTION
- 1.1 Study Assumptions and Market Definition
- 1.2 Scope of the Study
2 RESEARCH METHODOLOGY
3 EXECUTIVE SUMMARY
4 MARKET LANDSCAPE
- 4.1 Market Overview
- 4.2 Market Drivers
- 4.2.1 Hyperscaler-led bandwidth demand boom
- 4.2.2 Rapid cable construction for emerging region connectivity
- 4.2.3 Offshore wind-farm export-cable surge
- 4.2.4 SDM and 32-fiber-pair technology lowering USD/Tb costs
- 4.2.5 Redeployment of retired cables for resilience in underserved islands
- 4.2.6 Green-finance incentives for low-carbon, low-loss repeaters
- 4.3 Market Restraints
- 4.3.1 Data-sovereignty legislation complicating landing licences
- 4.3.2 Geopolitical vetoes on routes and vendors
- 4.3.3 Long permitting cycles and ESG push-back on near-shore routes
- 4.3.4 Global fiber and repeater supply-chain crunch
- 4.4 Evaluation of Critical Regulatory Framework
- 4.5 Value Chain Analysis
- 4.6 Technological Outlook
- 4.7 Porter's Five Forces
- 4.7.1 Bargaining Power of Suppliers
- 4.7.2 Bargaining Power of Buyers
- 4.7.3 Threat of New Entrants
- 4.7.4 Threat of Substitutes
- 4.7.5 Competitive Rivalry
- 4.8 Impact Assessment of Key Stakeholders
- 4.9 Key Use Cases and Case Studies
- 4.10 Impact on Macroeconomic Factors of the Market
- 4.11 Investment Analysis
5 MARKET SEGMENTATION
- 5.1 By Type
- 5.1.1 Wet-Plant Products
- 5.1.2 Dry-Plant Products
- 5.2 By Ownership Type
- 5.2.1 Consortium / Multiple-Ownership System
- 5.2.2 Single-Ownership (Private) System
- 5.2.3 Multilateral Development-Bank-Backed System
- 5.3 By Application
- 5.3.1 Telecom and Internet Backbone
- 5.3.2 Offshore Wind Power Export and Array Cables
- 5.3.3 Oil and Gas Subsea Power / Comms
- 5.3.4 Government and Defense Surveillance
- 5.3.5 Scientific and Research Networks
- 5.4 By Fiber-Pair Count
- 5.4.1 Less Than 8 Fiber Pairs
- 5.4.2 9 - 16 Fiber Pairs
- 5.4.3 17 - 24 Fiber Pairs
- 5.4.4 ? 25 Fiber Pairs (SDM)
- 5.5 By Geography
- 5.5.1 North America
- 5.5.1.1 United States
- 5.5.1.2 Canada
- 5.5.1.3 Mexico
- 5.5.2 South America
- 5.5.2.1 Brazil
- 5.5.2.2 Argentina
- 5.5.2.3 Rest of South America
- 5.5.3 Europe
- 5.5.3.1 United Kingdom
- 5.5.3.2 Germany
- 5.5.3.3 France
- 5.5.3.4 Italy
- 5.5.3.5 Spain
- 5.5.3.6 Nordics
- 5.5.3.7 Rest of Europe
- 5.5.4 Middle East and Africa
- 5.5.4.1 Middle East
- 5.5.4.1.1 Saudi Arabia
- 5.5.4.1.2 United Arab Emirates
- 5.5.4.1.3 Turkey
- 5.5.4.1.4 Rest of Middle East
- 5.5.4.2 Africa
- 5.5.4.2.1 South Africa
- 5.5.4.2.2 Egypt
- 5.5.4.2.3 Nigeria
- 5.5.4.2.4 Rest of Africa
- 5.5.4.1 Middle East
- 5.5.5 Asia-Pacific
- 5.5.5.1 China
- 5.5.5.2 India
- 5.5.5.3 Japan
- 5.5.5.4 South Korea
- 5.5.5.5 ASEAN
- 5.5.5.6 Australia
- 5.5.5.7 New Zealand
- 5.5.5.8 Rest of Asia-Pacific
- 5.5.1 North America
6 COMPETITIVE LANDSCAPE
- 6.1 Market Concentration
- 6.2 Strategic Moves
- 6.3 Market Share Analysis
- 6.4 Company Profiles (includes Global level Overview, Market level overview, Core Segments, Financials as available, Strategic Information, Market Rank/Share for key companies, Products and Services, and Recent Developments)
- 6.4.1 Alcatel Submarine Networks SAS
- 6.4.2 NEC Corporation
- 6.4.3 Prysmian S.p.A. (Submarine Telecom and Power Cables BU)
- 6.4.4 SubCom, LLC
- 6.4.5 Hengtong Optic-Electric Co., Ltd.
- 6.4.6 HMN Tech Co., Ltd. (Huawei Marine)
- 6.4.7 Nexans S.A.
- 6.4.8 Fujitsu Limited
- 6.4.9 NTT Communications Corporation
- 6.4.10 Google LLC
- 6.4.11 Sumitomo Electric Industries, Ltd.
- 6.4.12 Global Marine Systems Limited
- 6.4.13 Orange Marine S.A.S.
- 6.4.14 JDR Cable Systems Ltd.
- 6.4.15 Zhongtian Technology Submarine Cable Co., Ltd.
- 6.4.16 BW Digital Pte. Ltd. (Hawaiki)
- 6.4.17 Padtec Holding S.A.
- 6.4.18 Xtera, Inc.
- 6.4.19 Orient Cable (NBO) Co., Ltd.
- 6.4.20 Cable and Wireless Marine Service Ltd.
7 MARKET OPPORTUNITIES AND FUTURE OUTLOOK
- 7.1 White-space and Unmet-need Assessment

 海底電纜系統市場-2026-2032年全球市場預測
 海底電纜系統市場規模、佔有率和成長分析:按電纜類型、組件、線芯類型、用途、電壓等級、絕緣類型、最終用途和地區分類-2026-2033年產業預測
 海底電纜系統市場分析與預測(至2035年):類型、產品類型、服務、技術、組件、應用、部署模式、最終用戶、安裝模式、解決方案
 全球水下電力和電纜系統市場:按最終用戶產業、電壓、應用、導體材料和地區進行分析-市場規模、產業動態、機會分析和預測(2026-2035 年)
 2026年全球海底電纜系統市場報告
 全球海底電纜系統市場(按電纜類型、組件、絕緣體和類型分類)- 預測至 2030 年
 2032 年海底電纜系統市場預測:按類型、所有權類型、電纜類型、電壓、應用和地區進行的全球分析
 海底電纜系統市場機會、成長動力、產業趨勢分析及2025-2034年預測