


 |
市場調查報告書
商品編碼
2125556
公車:市場佔有率分析、行業趨勢和統計數據、成長預測(2026-2031 年)Bus - Market Share Analysis, Industry Trends & Statistics, Growth Forecasts (2026 - 2031) |
||||||

※ 本網頁內容可能與最新版本有所差異。詳細情況請與我們聯繫。
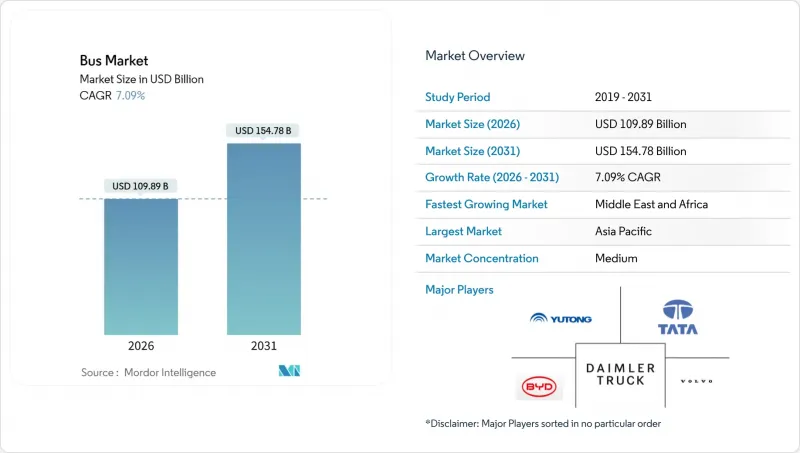
根據 Mordor Intelligence 預測,全球巴士市場規模預計在 2026 年達到 1,098.9 億美元,並在 2031 年擴大到 1,547.8 億美元,預測期內複合年成長率為 7.09%。
本報告按動力系統(混合動力汽車、電動和內燃機)、車身類型(單層和雙層)、用途(線路公車、城際/長途公車、校車及其他)、座位數(30座及以下和30座以上)、車身長度(9米及以下和9米以上)以及地區進行細分。市場預測以貨幣價值(美元)和銷售(輛)兩種形式呈現。
全球巴士市場趨勢與洞察
電池成本的快速下降使得整體擁有成本與能源價格持平成為可能。
到2024年,電池組的平均價格已經下降,在有利的燃料和電力價格條件下,其總擁有成本(TCO)已與柴油燃料持平。這種持平在許多世界最大的公共交通市場中都得到了體現。在聖地牙哥,該市的公車隊每公里成本顯著降低。此外,活動部件的減少降低了維護需求,並顯著延長了煞車皮的使用壽命。雖然無需補貼即可實現獲利能力的時間已經提前,但高昂的初始成本仍然是小規模營運商面臨的一大挑戰。
國家關於零能耗建築採購的規定
強制推廣零排放公車正在加速大眾運輸車輛的更新換代。加州計劃在未來幾年內禁止購買柴油車。同時,歐盟制定了雄心勃勃的零排放車輛目標,而中國也正在快速推進都市區車輛的電氣化。在印度,FAME-II計畫正在推動電動公車的普及,並在多個邦引發了大規模的競標。因此,營運商除了訂購車輛外,現在還必須確保充電基礎設施的建設。這種轉變不僅增加了短期資金需求,也為原始設備製造商(OEM)提供了更清晰的長期銷售前景。
電動公車和柴油公車的初始成本差異
在巴西和南非,關稅壁壘和本地電池生產能力的不足導致電動公車價格居高不下,成本大幅上漲。高成本仍然是公車市場面臨的主要挑戰,延長了投資回收期,使得許多業者難以在經濟上採用電動公車。此外,資金往往有限的地方政府業者難以支付電動公車比傳統柴油車更高的首付,這進一步阻礙了向更清潔交通解決方案的轉型。
細分市場分析
預計到2025年,內燃機平台將佔總銷量的71.23%,但由於強制實施零排放公車(ZEB)標準,柴油車被排除在新車競標之外,純電動公車正以11.82%的複合年成長率快速成長。純電動公車市場預計在未來幾年將顯著成長,並有望成為整個公車產業中最盈利的細分市場。汽車製造商(OEM)正致力於整合電池供應鏈,以提高效率並降低成本。宇通和比亞迪等公司正在採用一體化生產策略,以減輕原物料價格波動的影響。這種策略使它們相對於歐洲競爭對手擁有顯著的成本優勢。隨著電池技術的進步和實際續航里程的提升,混合動力汽車和插電式混合動力汽車的市場佔有率正在迅速下降。同時,燃料電池公車仍然是一個小眾市場,綠色氫的高成本阻礙了其廣泛應用。從長遠來看,柴油公車的銷售量預計將會下降,這不僅反映了市場的逐步多元化,也反映了市場結構的轉變。
「電動車優先」策略正在改變售後服務業的經濟格局。歐洲製造商目前提供基於先進預測維修系統顯著減少車輛運作。這些系統利用數據分析來最佳化維護計劃並提高營運效率。此外,「電池即服務 (BaaS)」合約的引入,正在將電池殘值風險從消費者轉移到原始設備製造商 (OEM) 身上。然而,這種變化也帶來了挑戰。如果近期不採取措施,缺乏成熟的二手電池分銷市場可能會對利潤率造成壓力。
預計到2025年,單層巴士將佔總銷售量的79.16%,主要得益於其在都市區和城際線路上的多功能性。同時,雙層巴士也呈現復甦跡象,年複合成長率達8.43%,這主要得益於旅遊需求的復甦和高階快線服務的興起,例如倫敦訂購了500輛電動巴士,香港也交付了200輛比亞迪巴士。隨著電池技術的進步,雙層巴士在歐洲旅遊車輛市場越來越受歡迎。透過車站的受電弓進行機械充電,雙層巴士不再受限於續航里程,城市對雙層巴士的興趣日益濃厚,使其吸引力超越了傳統的市場。
然而,技術挑戰仍然是其廣泛應用的一大障礙。電池的重量會提高車輛的重心,而高度限制則會限制路線選擇,使其無法通過某些橋樑。因此,車輛負責人必須仔細權衡增加載客量與營運柔軟性(包括路線適應性和車輛段基礎設施)之間的優缺點。這些因素決定了單層巴士在整個預測期內仍將是公車市場的基礎。
區域分析
預計到2025年,亞太地區將佔全球銷售量的41.73%。中國憑藉其龐大的電動公車車隊處於領先地位,而印度的FAME-II計畫正在支持馬哈拉斯特拉邦、卡納塔克邦和德里等重點邦的公車部署。中國整車製造商正利用從鋰採購到最終組裝的垂直整合供應鏈,以具有競爭力的價格提供12米級電動公車。在日本和韓國,城際線路正在向電動公車轉型,國內製造商做出了重要貢獻。同時,雅加達、曼谷和河內等東南亞國協的城市面臨電網可靠性和柴油補貼的挑戰,這可能會延緩實現總擁有成本(TCO)與燃油價格持平的目標。隨著中國車隊現代化週期的推進,印度的競標和東協發展計畫有望維持該地區的成長動能。
中東和非洲地區預計將成為所有地區中年複合成長率最高的地區,達9.73%。沙烏地阿拉伯的「2030願景」、阿拉伯聯合大公國引進電動公車、比亞迪在開羅首次投放電動公車,以及南非成功競標世界銀行的優惠型豪登列車項目,都體現了非洲大陸對電氣化的堅定承諾。這些由石油收入資助的措施面臨電網建設的挑戰。為了緩解尖峰時段用電需求帶來的挑戰,許多機構正採取策略性措施,將公車採購與太陽能發電和微電網投資結合。
在歐洲,在大量補貼和政策措施的支持下,電動車的普及取得了顯著進展。挪威、荷蘭和英國等國逐步淘汰柴油車,凸顯了在未來十年內實現全面電氣化的堅定決心。 《清潔車輛指令》提供了一個清晰的框架,鼓勵成員國優先採購零排放公車(ZEB),為汽車製造商(OEM)的投資創造了穩定的環境。相較之下,北美的進展速度較為緩慢。儘管清潔校車獲得了大量資金支持,但電力公司在完成電網連接方面仍面臨長期延誤。此外,近期市場動盪,例如Proterra的破產,迫使各機構重新競標,而這往往有利於NFI和Bluebird等老字型大小企業。南美的情況則較為複雜。聖地牙哥和波哥大等城市經營中國以外規模最大的電動公車車隊,但阿根廷的經濟不穩定導致競標取消,減緩了該地區電動出行發展的步伐。
其他好處:
- Excel格式的市場預測(ME)表
- 3個月的分析師支持
目錄
第1章:引言
- 研究假設和市場定義
- 調查範圍
第2章:調查方法
第3章執行摘要
第4章 主要產業趨勢
- 都市化、人口、對汽車/大眾運輸的需求
- 車輛擁有數量和汽車擁有率
- 電動車在汽車市場的滲透率
- 燃油價格與電費差異(每公里,內燃機汽車與電動車)
- 電動車和內燃機汽車的總擁有成本 (TCO) 差異
- 資金籌措和所有權模式(貸款、租賃、認購)
- 電池化學成分和電池組能量密度
- 家中、職場和公共場所的充電樁數量/密度
- 快速充電網路滲透率和功率頻寬現狀
- 替代燃料基礎設施(燃料電池電動車的氫氣)
- 補貼和消費者獎勵的價值
- OEM電動車產品線及未來車型計劃
- 價值鍊和通路分析
- 監管、財政和產業政策框架
第5章 市場狀況
- 市場概覽
- 市場促進因素
- 國家零能耗建築(ZEB)採購義務
- 電池成本的快速下降正使整體擁有成本與能源成本持平的目標越來越近。
- 特大城市的城市空氣品質法規
- 汽車製造商之間的電氣化競爭以及車型多樣化。
- 電池即服務資金籌措利用率
- 長途客車氫能走廊示範項目
- 市場限制因素
- 電動公車的初始成本較高(與柴油車相比)
- 充電站和公共充電站的建設落後。
- 加強大規模集電點的電網容量。
- 陰極材料原料供應波動
- 價值供應鏈分析
- 監理情勢
- 技術展望
- 波特五力模型
第6章 市場規模與成長預測
- 依推進類型
- 混合動力汽車和電動車
- 按燃料類型
- 電池式電動車
- 燃料電池電動車
- 油電混合車
- 插電式混合動力電動車
- 按燃料類型
- 內燃機
- 按燃料類型
- 柴油引擎
- 其他
- 按燃料類型
- 混合動力汽車和電動車
- 按甲板類型
- 單身的
- 雙倍的
- 透過使用
- 公車線路
- 城際巴士/長途巴士
- 校車
- 其他用途
- 按座位數
- 30個座位或更少
- 31-50個座位
- 超過50個座位
- 巴士長度
- 9米或以下
- 9~12 m
- 12米或以上
- 按地區
- 北美洲
- 美國
- 加拿大
- 其他北美國家
- 南美洲
- 巴西
- 阿根廷
- 其他南美國家
- 歐洲
- 德國
- 英國
- 法國
- 義大利
- 西班牙
- 其他歐洲國家
- 亞太地區
- 中國
- 印度
- 日本
- 韓國
- 其他亞太國家
- 中東和非洲
- 阿拉伯聯合大公國
- 沙烏地阿拉伯
- 南非
- 土耳其
- 其他中東和非洲國家
- 北美洲
第7章 競爭情勢
- 市場集中度
- 策略趨勢
- 市佔率分析
- 公司簡介
- Yutong Bus Co., Ltd.
- BYD Company Ltd.
- Volvo AB
- Daimler Truck Holding AG
- Tata Motors Limited
- NFI Group Inc.
- Proterra Inc.
- Anhui Ankai Automobile Co., Ltd.
- Ashok Leyland Ltd.
- King Long United Automotive
- Zhongtong Bus Holding Co., Ltd.
- Scania AB
- MAN Truck and Bus SE
- Solaris Bus and Coach Sp. z oo
- Alexander Dennis Ltd.
- Blue Bird Corp.
- Gillig LLC
- Marcopolo SA
- VDL Bus and Coach
第8章 市場機會與未來展望
- 未開發市場和未滿足需求的評估
第9章:CEO們需要思考的關鍵策略問題
第10章附錄
- 世界概覽
- 五力分析模型
- 全球價值鏈分析
- 市場動態(DRO)
- 資料來源與參考文獻
- 表格和圖表清單
- 主要發現
- 數據包
- 詞彙表
According to Mordor Intelligence, the global bus market size reached USD 109.89 billion in 2026 and is projected to expand to USD 154.78 billion by 2031, reflecting a 7.09% CAGR over the forecast period.
This report is Segmented by Propulsion Type (Hybrid and Electric Vehicles and Internal Combustion Engine), Deck Type (Single and Double), Application (Transit Bus, Intercity Bus/Motorcoach, School Bus, and Other Applications), Seating Capacity (Up To 30 Seats, and More), Bus Length (Up To 9m, and More), and Geography. The Market Forecasts are Provided in Terms of Value (USD) and Volume (Units).
Global Bus Market Trends and Insights
Rapid Battery-Cost Decline Enabling TCO Parity
In 2024, average pack prices declined, enabling total cost of ownership (TCO) parity with diesel fuel under favorable fuel and electricity price conditions. This parity is evident in many of the world's largest transit markets. In Santiago, the city's fleet has reported significantly lower per-kilometer costs. Additionally, reduced maintenance requirements due to fewer moving parts have significantly extended the lifespan of brake pads. While the timeline for subsidy-free viability has advanced, smaller operators still face challenges with the initial cost premium.
National ZEB Procurement Mandates
Public fleets are accelerating their replacement cycles due to mandates for zero-emission buses. California plans to prohibit diesel purchases in the coming years. Meanwhile, the European Union has set ambitious targets for zero-emission vehicles, and China is advancing rapidly toward electrifying its urban fleets . In India, the FAME-II program is driving widespread adoption of electric buses, leading to significant multi-state tenders. As a result, operators are now required to secure charging infrastructure in conjunction with their vehicle orders. This shift not only increases short-term capital demands but also provides OEMs with a clearer, long-term sales outlook.
High Upfront Price of E-Buses vs Diesel
In Brazil and South Africa, the prices of electric buses remain significantly higher due to tariff barriers and the absence of local cell production, resulting in substantial purchase premiums. These elevated costs remain a key challenge for the Bus Market, extending the payback periods and making the adoption of electric buses less financially viable for many operators. Additionally, municipal operators, often constrained by limited capital, face difficulties in meeting the higher down-payment requirements for electric buses compared to traditional diesel assets, further hindering the transition to cleaner transportation solutions.
Other drivers and restraints analyzed in the detailed report include:
- Urban Air-Quality Regulations in Mega-Cities
- Battery-as-a-Service Financing Uptake
- Slow Depot and Public Charging Roll-Out
For complete list of drivers and restraints, kindly check the Table Of Contents.
Segment Analysis
Internal-combustion platforms retained 71.23% of 2025 revenue, yet battery-electric buses are expanding at an 11.82% CAGR as ZEB mandates lock diesel out of new tenders. The battery-electric bus market is expected to experience significant growth in the coming years, becoming the most lucrative segment within the broader bus industry. Original Equipment Manufacturers (OEMs) are focusing on consolidating their cell supply chains to enhance efficiency and reduce costs. Companies like Yutong and BYD are adopting integrated production strategies to mitigate the impact of raw material price volatility. This approach provides them with a substantial cost advantage over their European competitors. As battery technology advances and real-world ranges improve, hybrids and plug-in hybrids are rapidly losing relevance. At the same time, fuel-cell buses remain a niche segment, with adoption constrained by the high costs of green hydrogen. Over the long term, diesel bus volumes are anticipated to decline, reflecting a structural shift in the market rather than a gradual diversification.
Electric-first strategies are transforming the economics of after-sales services. European manufacturers are now offering extended battery warranties, supported by advanced predictive maintenance systems that significantly reduce vehicle downtime. These systems leverage data analytics to optimize maintenance schedules and improve operational efficiency. Additionally, the adoption of Battery-as-a-Service (BaaS) contracts is transferring the risk of residual battery value from consumers to OEMs. However, this shift introduces challenges, as the lack of a mature secondary market for used batteries could pressure profit margins if not addressed in the near future.
Single-deck models accounted for 79.16% of revenue in 2025, driven by their universal fit across urban and intercity routes. Double-deck buses, however, are reviving with an 8.43% CAGR on tourism rebounds and premium express services, exemplified by London's 500-unit electric order and Hong Kong's 200 BYD deliveries. With advancements in battery technology, double-decker buses are increasingly gaining traction in the European tourist fleet market. Pantograph opportunity charging at terminals is addressing range limitations and generating interest among cities, expanding the appeal of double-deckers beyond their traditional areas of dominance.
However, technical challenges continue to hinder widespread adoption. The weight of the battery raises the vehicle's center of gravity, while height restrictions limit route options under certain bridges. Consequently, fleet planners must carefully evaluate the trade-offs between increased passenger capacity and operational flexibility, including considerations like route adaptability and depot infrastructure. These factors ensure that single-decker buses remain the cornerstone of the bus market throughout the forecast period.
Complete Report Scope:
- By Propulsion Type
- Hybrid and Electric Vehicles
- By Fuel Category
- Battery Electric Vehicle
- Fuel Cell Electric Vehicle
- Hybrid Electric Vehicle
- Plug-in Hybrid Electric Vehicle
- By Fuel Category
- Internal Combustion Engine
- By Fuel Category
- Diesel
- Others
- By Fuel Category
- Hybrid and Electric Vehicles
- By Deck Type
- Single
- Double
- By Application
- Transit Bus
- Intercity Bus / Motorcoach
- School Bus
- Other Applications
- By Seating Capacity
- Up to 30 seats
- 31 - 50 seats
- More than 50 seats
- By Bus Length
- Up to 9 m
- 9 - 12 m
- More than 12 m
- By Region
- North America
- United States
- Canada
- Rest of North America
- South America
- Brazil
- Argentina
- Rest of South America
- Europe
- Germany
- United Kingdom
- France
- Italy
- Spain
- Rest of Europe
- Asia-Pacific
- China
- India
- Japan
- South Korea
- Rest of Asia-Pacific
- Middle East and Africa
- United Arab Emirates
- Saudi Arabia
- South Africa
- Turkey
- Rest of Middle East and Africa
- North America
Geography Analysis
The Asia-Pacific region contributed 41.73% of the 2025 revenue. China leads with a significant electric fleet, while India's FAME-II scheme supports the deployment of buses in key states, including Maharashtra, Karnataka, and Delhi. Chinese OEMs offer competitively priced 12-meter electric buses due to their vertically integrated supply chains, covering everything from lithium sourcing to final assembly. In Japan and South Korea, intercity corridors are transitioning to electric, with notable contributions from domestic manufacturers. Meanwhile, ASEAN cities like Jakarta, Bangkok, and Hanoi face challenges related to grid reliability and diesel subsidies, which could delay achieving total cost of ownership (TCO) parity. As China's replacement cycle progresses, India's tender pipeline and ASEAN's development programs are expected to sustain the region's growth trajectory .
The Middle East and Africa are expected to post the highest regional CAGR at 9.73%, Saudi Arabia's Vision 2030, the UAE's rollout of electric buses, Cairo's introduction of its first BYD units, and South Africa's award of a Gautrain tender under World Bank concessional terms, all underscore the continent's electric ambitions. Funded by oil revenues, these initiatives face a hurdle: grid upgrades. To mitigate peak demand challenges, many agencies are strategically coupling bus purchases with investments in solar generation and microgrids.
Europe has made significant progress in the adoption of electric vehicles, supported by substantial grants and policy measures. Diesel phase-outs in countries such as Norway, the Netherlands, and the UK underscore a strong commitment to achieving full electrification within the decade. The Clean Vehicles Directive provides a clear framework, encouraging member states to prioritize the procurement of zero-emission buses (ZEBs), thereby fostering a stable environment for OEM investments. North America, however, is advancing at a slower pace. Despite substantial funding for clean school buses, utilities face prolonged timelines for interconnections. Additionally, recent market disruptions, such as Proterra's bankruptcy, have forced agencies to re-bid contracts, often favoring established players like NFI and Blue Bird. South America presents a mixed scenario: while cities like Santiago and Bogota operate some of the largest electric fleets outside China, economic instability in Argentina has led to tender cancellations, delaying the region's progress in scaling up electric mobility.
- Yutong Bus Co., Ltd.
- BYD Company Ltd.
- Volvo AB
- Daimler Truck Holding AG
- Tata Motors Limited
- NFI Group Inc.
- Proterra Inc.
- Anhui Ankai Automobile Co., Ltd.
- Ashok Leyland Ltd.
- King Long United Automotive
- Zhongtong Bus Holding Co., Ltd.
- Scania AB
- MAN Truck and Bus SE
- Solaris Bus and Coach Sp. z o.o.
- Alexander Dennis Ltd.
- Blue Bird Corp.
- Gillig LLC
- Marcopolo S.A.
- VDL Bus and Coach
Additional Benefits:
- The market estimate (ME) sheet in Excel format
- 3 months of analyst support
TABLE OF CONTENTS
1 Introduction
- 1.1 Study Assumptions and Market Definition
- 1.2 Scope of the Study
2 Research Methodology
3 Executive Summary
4 Key Industry Trend
- 4.1 Urbanization, Population and Vehicle/Transit Demand
- 4.2 Car Ownership and Motorization Rate
- 4.3 EV Penetration in Car Market
- 4.4 Fuel vs Electricity Price Spread (Per km, ICE vs EV)
- 4.5 EV vs ICE Total Cost of Ownership (TCO) Gap
- 4.6 Financing and Ownership Models (Loans, Leasing, Subscription)
- 4.7 Battery Chemistry Mix and Pack Energy Density
- 4.8 Home, Workplace and Public Charger Access / Density
- 4.9 Fast-Charging Network Coverage and Power Bands
- 4.10 Alternative Fuels Infrastructure (Hydrogen for FCEVs)
- 4.11 Subsidy and Consumer Incentive Value
- 4.12 OEM EV Line-up and Model Pipeline
- 4.13 Value-Chain and Distribution-Channel Analysis
- 4.14 Regulatory, Fiscal and Industrial Policy Framework
5 Market Landscape
- 5.1 Market Overview
- 5.2 Market Drivers
- 5.2.1 National ZEB procurement mandates
- 5.2.2 Rapid battery-cost decline enabling TCO parity
- 5.2.3 Urban air-quality regulations in mega-cities
- 5.2.4 OEM electrification race and model proliferation
- 5.2.5 Battery-as-a-Service financing uptake
- 5.2.6 Hydrogen corridor pilots for long-haul coaches
- 5.3 Market Restraints
- 5.3.1 High upfront price of e-buses vs diesel
- 5.3.2 Slow depot and public charging roll-out
- 5.3.3 Grid-capacity upgrades at large depots
- 5.3.4 Cathode raw-material supply volatility
- 5.4 Value / Supply-Chain Analysis
- 5.5 Regulatory Landscape
- 5.6 Technological Outlook
- 5.7 Porter's Five Forces
- 5.7.1 Threat of New Entrants
- 5.7.2 Bargaining Power of Suppliers
- 5.7.3 Bargaining Power of Buyers
- 5.7.4 Threat of Substitutes
- 5.7.5 Industry Rivalry
6 Market Size and Growth Forecasts (Value and Volume)
- 6.1 By Propulsion Type
- 6.1.1 Hybrid and Electric Vehicles
- 6.1.1.1 By Fuel Category
- 6.1.1.1.1 Battery Electric Vehicle
- 6.1.1.1.2 Fuel Cell Electric Vehicle
- 6.1.1.1.3 Hybrid Electric Vehicle
- 6.1.1.1.4 Plug-in Hybrid Electric Vehicle
- 6.1.1.1 By Fuel Category
- 6.1.2 Internal Combustion Engine
- 6.1.2.1 By Fuel Category
- 6.1.2.1.1 Diesel
- 6.1.2.1.2 Others
- 6.1.2.1 By Fuel Category
- 6.1.1 Hybrid and Electric Vehicles
- 6.2 By Deck Type
- 6.2.1 Single
- 6.2.2 Double
- 6.3 By Application
- 6.3.1 Transit Bus
- 6.3.2 Intercity Bus / Motorcoach
- 6.3.3 School Bus
- 6.3.4 Other Applications
- 6.4 By Seating Capacity
- 6.4.1 Up to 30 seats
- 6.4.2 31 - 50 seats
- 6.4.3 More than 50 seats
- 6.5 By Bus Length
- 6.5.1 Up to 9 m
- 6.5.2 9 - 12 m
- 6.5.3 More than 12 m
- 6.6 By Region
- 6.6.1 North America
- 6.6.1.1 United States
- 6.6.1.2 Canada
- 6.6.1.3 Rest of North America
- 6.6.2 South America
- 6.6.2.1 Brazil
- 6.6.2.2 Argentina
- 6.6.2.3 Rest of South America
- 6.6.3 Europe
- 6.6.3.1 Germany
- 6.6.3.2 United Kingdom
- 6.6.3.3 France
- 6.6.3.4 Italy
- 6.6.3.5 Spain
- 6.6.3.6 Rest of Europe
- 6.6.4 Asia-Pacific
- 6.6.4.1 China
- 6.6.4.2 India
- 6.6.4.3 Japan
- 6.6.4.4 South Korea
- 6.6.4.5 Rest of Asia-Pacific
- 6.6.5 Middle East and Africa
- 6.6.5.1 United Arab Emirates
- 6.6.5.2 Saudi Arabia
- 6.6.5.3 South Africa
- 6.6.5.4 Turkey
- 6.6.5.5 Rest of Middle East and Africa
- 6.6.1 North America
7 Competitive Landscape
- 7.1 Market Concentration
- 7.2 Strategic Moves
- 7.3 Market Share Analysis
- 7.4 Company Profiles (Includes Global level Overview, Market level overview, Core Segments, Financials as available, Strategic Information, Market Rank/Share, Products and Services, Recent Developments)
- 7.4.1 Yutong Bus Co., Ltd.
- 7.4.2 BYD Company Ltd.
- 7.4.3 Volvo AB
- 7.4.4 Daimler Truck Holding AG
- 7.4.5 Tata Motors Limited
- 7.4.6 NFI Group Inc.
- 7.4.7 Proterra Inc.
- 7.4.8 Anhui Ankai Automobile Co., Ltd.
- 7.4.9 Ashok Leyland Ltd.
- 7.4.10 King Long United Automotive
- 7.4.11 Zhongtong Bus Holding Co., Ltd.
- 7.4.12 Scania AB
- 7.4.13 MAN Truck and Bus SE
- 7.4.14 Solaris Bus and Coach Sp. z o.o.
- 7.4.15 Alexander Dennis Ltd.
- 7.4.16 Blue Bird Corp.
- 7.4.17 Gillig LLC
- 7.4.18 Marcopolo S.A.
- 7.4.19 VDL Bus and Coach
8 Market Opportunities and Future Outlook
- 8.1 White-space and Unmet-Need Assessment
9 Key Strategic Questions for CEOs
10 Appendix
- 10.1 Global Overview
- 10.2 Porter's Five Forces Framework
- 10.3 Global Value Chain Analysis
- 10.4 Market Dynamics (DROs)
- 10.5 Sources and References
- 10.6 List of Tables and Figures
- 10.7 Primary Insights
- 10.8 Data Pack
- 10.9 Glossary of Terms

 2026年全球客車市場報告
 鉸接式客車市場規模、佔有率、成長、全球產業分析、區域趨勢及2026-2034年預測。全球臥舖巴士市場:市場規模、佔有率、趨勢和成長分析(2026-2034)
 無軌電車市場分析及至2035年的預測:類型、產品類型、技術、組件、應用、最終用戶、功能、安裝配置、運輸方式全球公車市場2026年全球巴士市場報告2026年全球長途客車市場報告
 豪華巴士市場規模、佔有率和成長分析:按燃料類型、巴士類型、應用和地區分類-2026-2033年產業預測
 臥舖巴士市場:市場機會、成長要素、產業趨勢分析及2026-2035年預測
 歐洲巴士市場:市場佔有率分析、產業趨勢與統計、成長預測(2026-2031)