


 |
市場調查報告書
商品編碼
2125501
美國電信塔:市場佔有率分析、行業趨勢和統計數據、成長預測(2026-2031 年)United States Telecom Tower - Market Share Analysis, Industry Trends & Statistics, Growth Forecasts (2026 - 2031) |
||||||

※ 本網頁內容可能與最新版本有所差異。詳細情況請與我們聯繫。
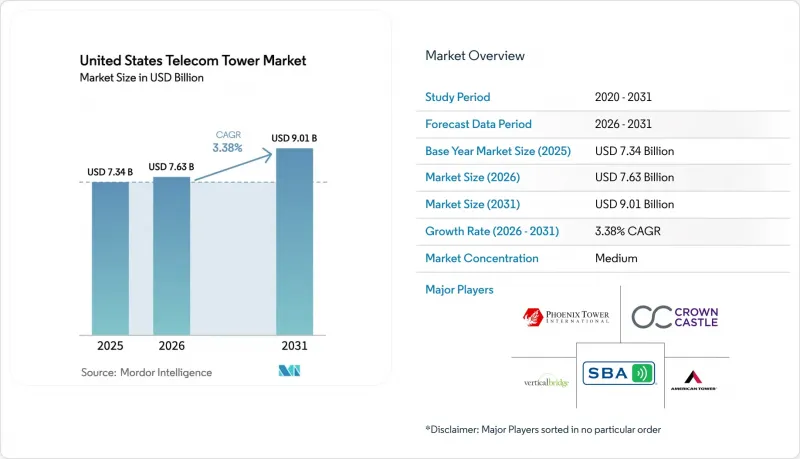
根據 Mordor Intelligence 預測,美國電信塔市場規模將從 2025 年的 73.4 億美元成長到 2026 年的 76.3 億美元,到 2031 年達到 90.1 億美元,2026 年至 2031 年的複合年成長率預計為 3.38%。
本報告按燃料類型(可再生和不可可再生能源)、塔架類型(格子形杆塔、拉線塔、單極塔、隱形塔)、安裝類型(屋頂安裝和地面安裝)、所有權類型(營運商擁有、合資企業所有、私人擁有、行動網路營運商所有)和地區進行分類。市場預測以美元計價。
美國通訊塔市場趨勢與洞察
5G中頻段和C頻段擁塞波的快速擴張。
即使Verizon在2025年底前實現90%的C頻段覆蓋率,局部容量短缺問題依然存在,迫使該公司在數千個宏基地台租賃額外的空間。 T-Mobile擁有龐大的2.5GHz頻段,所需基地台數量較少,這造成了不對稱的競爭環境,迫使AT&T和Verizon在現有基地台上增加租戶,而不是投資新建設。在第110次競標中獲得3.45-3.55GHz頻段牌照的營運商必須在2027年前完成分階段的建設里程碑,這將為基地台營運商帶來第二波高密度部署熱潮,並最終轉化為企業收入。主租賃協議的修訂案中包含租金遞增條款,允許業主提前獲得收入,每次執照擁有者投入運作額外的無線電設備時,租金都會逐步上漲。這種高密度部署的趨勢在主要城市走廊最為顯著,因為高人口密度為每個基地台增加第四或第五個租戶提供了經濟上的合理性。
固定無線接取用戶數量快速成長
預計到2025年底,Verizon將擁有570萬條固定無線接入線路,其經營團隊的目標是到2027年達到900萬條線路。這意味著郊區縣將新增數千份屋頂和單極塔租賃協議。 2025年6月,美國國家電信和資訊管理局(NTIA)決定將固定無線解決方案與光纖方案同等對待,從而釋放了424.5億美元的寬頻增強評估(BEAD)津貼,加速了電信業者在成本高昂的農村地區的競標。鐵塔公司正積極響應,在州寬頻機構最終確定專案選擇前數月,透過選擇合約鎖定符合條件的地塊,有效地為營運商租戶預先部署了資產。雖然在蒙大拿州和懷俄明州等州,光纖安裝的成本可能超過每個項目5萬美元,但無線提案目前已成為州評估標準的大部分,一旦津貼轉化為實際建設,預計中期內租賃協議的數量將激增。這一發展將公共資金與私人高層房地產聯繫起來,有助於彌合農村地區的數位落差。
市政限高規定低於 150 英尺
舊金山等城市的城市規劃條例將新建訊號塔的高度限制在 40 至 65 英尺之間,遠低於中波傳播的最佳高度 120 至 180 英尺,迫使電信業者依賴屋頂租賃和小型基地台。博爾德市在其歷史街區強制執行 35 英尺的高度限制,導致諸如隱蔽安裝和屋頂安裝等替代方案的租金比標準地面站點高出 70%。由於聯邦通訊委員會 (FCC) 2025 年的一項命令保留了地方政府對高度和退讓距離規定的管轄權,因此這一限制在可預見的未來仍將持續。目前,訊號塔建造商使用旗桿、教堂尖頂和人造樹等作為掩蔽物來獲得分區許可,每項都會使安裝成本增加 7.5 萬至 15 萬美元。而這種補償是網路幾何條件的惡化。由於 40 英尺高的隱藏安裝位置只能覆蓋不到半英里的半徑,因此需要更多的安裝位置才能達到與單一單極天線相同的服務範圍。
細分市場分析
預計到2025年,採用可再生能源運作的基地台將占美國通訊塔市場約37.44%的佔有率,並持續成長至2031年,年複合成長率(CAGR)為3.96%。美國鐵塔公司(American Tower Corporation)承諾,到2030年,其全國所有設施中可再生能源的採用率將從2024年的22%提高到60%。該計劃依賴數千個維修,這些項目將太陽能發電與電池儲能相結合。皇冠城堡公司(Crown Castle Corporation)也正在追求類似的減排目標,利用鋰離子電池成本的下降(目前已低於每千瓦時150美元),每年改造500個設施。然而,有兩個障礙正在減緩這一進程。首先,加州和德克薩斯州長達24個月的併網等待期延遲了淨計量,而淨計量對於專案的獲利能力至關重要。其次,在易發野火地區安裝電池需要額外的許可證,這將使工期再延長3到6個月。儘管面臨這些挑戰,電信公司仍願意為低碳塔支付10%至15%的租金溢價,以滿足其企業永續發展評估標準,從而提高資產組合所有者的盈利。如果國會將太陽能發電30%的投資稅額扣抵延長至2032年以後,可再生能源的佔有率成長速度可能會超過目前的預期,甚至可能超過美國電信塔市場整體成長的基準預測。
預計到2025年,非可再生能源系統將佔安裝總量的62.56%,並繼續佔據主導地位,其增速預計為3.38%。在易受颶風侵襲的墨西哥灣沿岸市場,柴油發電機的冗餘備援仍然至關重要;而在電價較低的地區,天然氣微型燃氣渦輪機則具有成本優勢。然而,美國證券交易委員會(SEC)正在製定的碳排放揭露規則,進一步增加了電信業者向綠色能源來源轉型的壓力。在整個預測期內,考慮到燃料物流成本,柴油發電機和太陽能-電池混合系統之間的成本預計將趨於一致,這將為可再生能源解決方案逐年擴大市場佔有率奠定基礎。因此,能源策略將成為塔架所有者吸引具有永續性意識的租戶的關鍵競爭優勢。
2025年,單極塔結構占美國通訊塔市場59.62%的佔有率。這主要得益於其面積小(20-30英尺),易於徵地。格子形杆塔在農村地區仍佔據主導地位,因為風荷載和冰荷載對單桿塔的結構強度構成挑戰,但其市場佔有率約為25%,並呈現趨於平穩或下降的趨勢。導線式塔架建造費用較低,但需要更多土地,主要集中在中西部和中部平原各州,約佔總安裝量的10%。隱蔽式塔架發展迅速,預計到2031年複合年成長率將達4.37%。旗桿式隱蔽塔架的單價為20萬至30萬美元,比標準單極塔高出約60%,但地方政府的核准週期為6-9個月,而非隱蔽式塔架的核准週期則長達18個月。
Dish Wireless 正清楚地展現出這種結構性轉變。該公司計劃在 2025 年底前建造 18,000 個開放式無線存取網路 (Open RAN) 站點,其中 60% 將採用隱蔽式或屋頂安裝方式,使用更輕的無線電設備和虛擬化基頻帶單元。加州、佛羅裡達州和紐約州的市政當局已立法規定進行景觀影響評估,實際上強制要求對超過 50 英尺高的鐵塔採用隱蔽式解決方案,這加速了包含人造樹枝、覆蓋物和樹皮板的模組化套件的普及。每個隱蔽站點的覆蓋半徑不斷縮小,導致每平方英里的鐵塔數量增加,加快了業主營運商簽訂租賃協議的速度。在富裕的郊區,高昂的房價很容易引發當地居民的強烈反對,電信業者正擴大將增加的隱蔽式成本納入預算,以確保監管的確定性,從而鞏固了該細分市場在美國整體電信鐵塔市場中高於平均水平的成長模式。
其他好處
- Excel格式的市場預測(ME)表
- 3個月的分析師支持
目錄
第1章:引言
- 研究假設和市場定義
- 調查範圍
第2章:調查方法
第3章執行摘要
第4章 市場狀況
- 市場概覽
- 市場促進因素
- 5G中頻段和C頻段擁塞波的快速擴張。
- 固定無線接取用戶數量快速成長
- 根據《基礎設施投資和就業法》提供的農村寬頻津貼
- 加速鐵塔共址建設,以抵銷電信業者資本投資的限制。
- 延長國稅局對塔樓維修的特殊折舊(第 168k 條)
- FCC優先處理過高的區域安裝費(NPRM WT-25-276)
- 市場限制因素
- 市政限高規定低於 150 英尺
- 由於聯邦基金利率超過4.75%,導致資金成本高昂。
- 根據第 232 條徵收的鋼材關稅導致塔架製造成本增加
- 由於有線電視、MVNO、CBRS 和小型基地台分流,對廣域基地台的需求減少。
- 產業價值鏈分析
- 電信基礎設施監管狀況
- 技術展望
- 波特五力分析
第5章 市場規模與成長預測
- 按燃料類型
- 可再生能源
- 不可可再生能源
- 塔式
- 格子形杆塔
- 分支型塔
- 單極塔
- 隱形塔
- 按安裝類型
- 屋頂
- 地面安裝
- 依所有權類型
- 企業所有
- 合資
- 私人
- MNO 直銷
第6章 競爭情勢
- 市場集中度
- 重大併購詳情
- 主要供應商市佔率分析
- 公司簡介
- TowerCos
- American Tower Corporation
- Crown Castle Inc.
- SBA Communications Corporation
- Vertical Bridge REIT LLC
- Phoenix Tower International
- Mobile Network Operator
- Verizon Communications Inc.
- AT&T Inc.
- T-Mobile US Inc.
- Dish Wireless LLC
- TowerCos
第7章 市場機會與未來展望
According to Mordor Intelligence, the United States telecom tower market size is expected to increase from USD 7.34 billion in 2025 to USD 7.63 billion in 2026 and reach USD 9.01 billion by 2031, growing at a CAGR of 3.38% over 2026-2031.
This report is Segmented by Fuel Type (Renewable, and Non-Renewable), Tower Type (Lattice Tower, Guyed Tower, Monopole Tower, and Stealth Tower), Installation (Rooftop, and Ground-Based), Ownership (Operator-Owned, Joint Venture, Private-Owned, and MNO Captive), and Geography. The Market Forecasts are Provided in Terms of Value (USD).
United States Telecom Tower Market Trends and Insights
Surging 5G Mid-Band and C-Band Densification Wave
Verizon's completion of 90% C-band coverage by late 2025 still leaves localized capacity gaps, leading the carrier to lease incremental space on thousands of macro sites. T-Mobile's deeper 2.5 GHz inventory requires fewer towers, creating an asymmetric competitive environment that is pressuring AT&T and Verizon to add tenants on existing structures rather than fund new builds. Carriers that secured 3.45-3.55 GHz licenses in Auction 110 must meet staged build-out milestones through 2027, embedding a second densification wave into tower-company revenue pipelines. Master lease amendments now include escalator clauses that step up rents as licensees light up additional radios, allowing owners to pull forward value. The densification push is most intense in the top urban corridors, where population density drives the economic case for a fourth or fifth tenant per structure.
Rapid Growth in Fixed-Wireless Access Subscriber Targets
Verizon reported 5.7 million fixed-wireless access lines at 2025 year-end, and management aims for 9 million by 2027, which implies thousands of incremental rooftop and monopole leases in exurban counties. NTIA's June 2025 decision to treat fixed-wireless solutions on par with fiber unlocked USD 42.45 billion in BEAD grants, accelerating carrier bids in high-cost rural territories. Tower companies have responded by optioning land parcels in eligible blocks months before state broadband offices finalize project awards, effectively pre-positioning assets for carrier tenancy. In Montana and Wyoming, where fiber passes can exceed USD 50,000 each, wireless proposals now win a majority of state scoring matrices, guaranteeing a medium-term leasing surge once grants convert to construction starts. The dynamic couples public capital with private tower real estate to close the rural digital divide.
Municipal Height Caps Below 150 Feet
Planning codes in cities such as San Francisco cap new towers at 40-65 feet, far below the 120-180 feet optimum for mid-band propagation, forcing carriers to rely on rooftop leases or small-cell nodes. Boulder enforces a 35-foot limit in historic districts, which raises rent premiums on stealth or rooftop alternatives by up to 70% compared with standard ground sites. Because the FCC's 2025 order preserved local authority on height and setback rules, this constraint persists indefinitely. Tower firms now deploy flagpole, church-steeple, and artificial-tree concealments, each adding USD 75,000-USD 150,000 to site costs, in exchange for zoning approval. The trade-off is unfavorable network geometry, since a 40-foot stealth site covers less than a half-mile radius, demanding many more locations to achieve the same footprint as a single monopole.
Other drivers and restraints analyzed in the detailed report include:
- Infrastructure Investment and Jobs Act Rural Broadband Grants
- Accelerated Tower Colocation to Offset Carrier Capex Constraints
- Elevated Cost of Capital with Fed Funds Greater Than 4.75 Percent
For complete list of drivers and restraints, kindly check the Table Of Contents.
Segment Analysis
Renewable-powered sites captured roughly 37.44% of the United States telecom tower market size in 2025 and are projected to grow at a 3.96% CAGR through 2031. American Tower has pledged to lift renewable penetration across its domestic footprint from 22% in 2024 to 60% by 2030, a plan that relies on thousands of solar-plus-battery retrofits. Crown Castle is converting 500 sites per year, chasing a similar emissions pathway and benefiting from falling lithium-ion battery costs, now under USD 150 per kilowatt-hour. Two barriers temper momentum. First, interconnection queues in California and Texas extend up to 24 months, delaying net-metered tie-ins that underpin project economics. Second, wildfire zones require additional permits for battery energy storage, adding another three to six months to build schedules. Despite these frictions, carriers are willing to pay 10%-15% rent premia on low-carbon towers to satisfy corporate sustainability scorecards, improving return profiles for portfolio owners. If Congress extends the 30% solar investment tax credit beyond 2032, the renewable share could accelerate past today's forecast band, lifting the overall United States telecom tower market growth above baseline projections.
Non-renewable systems, still dominant with 62.56% of 2025 deployments, will expand at a slower 3.38% rate. Diesel redundancy remains critical in cyclone-prone Gulf markets, and natural-gas micro-turbines offer cost advantages where utility power is cheap. Yet looming carbon disclosure rules issued by the Securities and Exchange Commission intensify pressure on carriers to migrate toward green energy sources. Over the forecast horizon, cost parity between diesel gensets and solar-battery hybrids is likely once fuel logistics premiums are considered, setting the stage for renewable solutions to gain incremental share each year. Thus, energy strategy stands as a competitive differentiator for tower owners courting sustainability-oriented tenants.
Monopole structures accounted for 59.62% of the United States telecom tower market share in 2025, thanks to 20-30 foot ground footprints that simplify land acquisition. Lattice towers remain the workhorse in rural areas where wind and ice loads challenge single-pole integrity, but their share sits near 25% and is flat to declining. Guyed designs, cheaper to erect yet land-intensive, concentrate in the Midwest and Plains states, representing roughly 10% of aggregate inventory. The growth standout is the stealth category, with a projected 4.37% CAGR to 2031. A single flagpole concealment costs USD 200,000-USD 300,000, roughly 60% above a standard monopole, yet municipalities approve these structures within six to nine months versus up to 18 months for non-concealed alternatives.
Dish Wireless illustrates the structural shift. Of its 18,000 Open RAN sites under construction as of late 2025, 60% leverage stealth or rooftop formats that rely on lighter radios and virtualized baseband units. Municipalities in California, Florida, and New York have codified aesthetic impact assessments that effectively mandate disguise solutions above 50 feet, accelerating take-up of modular kits featuring faux branches, shrouds, and bark panels. Because each stealth site covers a reduced radius, tower counts per square mile climb, inflating lease velocity for owner-operators. In affluent suburbs where property values drive fierce community opposition, carriers increasingly budget for higher concealment costs to secure regulatory certainty, cementing the segment's above-average growth pattern within the broader United States telecom tower market.
Complete Report Scope:
- By Fuel Type
- Renewable-powered
- Non-renewable-powered
- By Type of Tower
- Lattice Tower
- Guyed Tower
- Monopole Tower
- Stealth Tower
- By Installation
- Rooftop
- Ground-based
- By Ownership
- Operator-owned
- Joint Venture
- Private-owned
- MNO Captive
List of Companies Covered in this Report:
- TowerCos
- Mobile Network Operator
Additional Benefits:
- The market estimate (ME) sheet in Excel format
- 3 months of analyst support
TABLE OF CONTENTS
1 INTRODUCTION
- 1.1 Study Assumptions and Market Definition
- 1.2 Scope of the Study
2 RESEARCH METHODOLOGY
3 EXECUTIVE SUMMARY
4 MARKET LANDSCAPE
- 4.1 Market Overview
- 4.2 Market Drivers
- 4.2.1 Surging 5G Mid-Band and C-Band Densification Wave
- 4.2.2 Rapid Growth in Fixed-Wireless Access Subscriber Targets
- 4.2.3 Infrastructure Investment and Jobs Act Rural Broadband Grants
- 4.2.4 Accelerated Tower Colocation to Offset Carrier Capex Constraints
- 4.2.5 Extension of IRS Bonus Depreciation for Tower Upgrades (Section 168k)
- 4.2.6 FCC Pre-Emption of Excessive Local Siting Fees (NPRM WT-25-276)
- 4.3 Market Restraints
- 4.3.1 Municipal Height Caps Below 150 Feet
- 4.3.2 Elevated Cost of Capital with Fed Funds > 4.75 Percent
- 4.3.3 Section 232 Steel Tariffs Lifting Tower Fabrication Costs
- 4.3.4 Cable-MVNO CBRS Small-Cell Off-Load Reducing Macro Demand
- 4.4 Industry Value Chain Analysis
- 4.5 Regulatory Landscape Related to Telecom Infrastructure
- 4.6 Technological Outlook
- 4.7 Porter's Five Forces Analysis
- 4.7.1 Bargaining Power of Suppliers
- 4.7.2 Bargaining Power of Buyers
- 4.7.3 Threat of New Entrants
- 4.7.4 Threat of Substitutes
- 4.7.5 Intensity of Competitive Rivalry
5 MARKET SIZE AND GROWTH FORECASTS (VALUE)
- 5.1 By Fuel Type
- 5.1.1 Renewable-powered
- 5.1.2 Non-renewable-powered
- 5.2 By Type of Tower
- 5.2.1 Lattice Tower
- 5.2.2 Guyed Tower
- 5.2.3 Monopole Tower
- 5.2.4 Stealth Tower
- 5.3 By Installation
- 5.3.1 Rooftop
- 5.3.2 Ground-based
- 5.4 By Ownership
- 5.4.1 Operator-owned
- 5.4.2 Joint Venture
- 5.4.3 Private-owned
- 5.4.4 MNO Captive
6 COMPETITIVE LANDSCAPE
- 6.1 Market Concentration
- 6.2 Details of Major Mergers and Acquisitions
- 6.3 Market Share Analysis for Top Vendors
- 6.4 Company Profiles (includes Global Level Overview, Market Level Overview, Core Segments, Financials as available, Strategic Information, Market Rank/Share, Products and Services, Recent Developments)
- 6.4.1 TowerCos
- 6.4.1.1 American Tower Corporation
- 6.4.1.2 Crown Castle Inc.
- 6.4.1.3 SBA Communications Corporation
- 6.4.1.4 Vertical Bridge REIT LLC
- 6.4.1.5 Phoenix Tower International
- 6.4.2 Mobile Network Operator
- 6.4.2.1 Verizon Communications Inc.
- 6.4.2.2 AT&T Inc.
- 6.4.2.3 T-Mobile US Inc.
- 6.4.2.4 Dish Wireless LLC
- 6.4.1 TowerCos
7 MARKET OPPORTUNITIES AND FUTURE OUTLOOK
- 7.1 White-space and Unmet-need Assessment

 非洲電信塔及相關設備市場:市場佔有率分析、產業趨勢與統計及成長預測(2026-2031年)電信塔:市場佔有率分析、產業趨勢與統計、成長預測(2026-2031)
 通訊塔市場預測至2034年-按塔型、安裝方式、所有權方式、燃料類型、應用和地區分類的全球分析
 塔架管理軟體市場:依部署類型、塔架類型、最終用戶、功能和地區分類通訊塔市場:依部署方式、塔型、安裝方式、應用程式和區域分類
 通訊塔市場規模、佔有率、趨勢和預測:按塔型、燃料類型、安裝方式、所有權方式和地區分類,2026-2034 年
 隱蔽通訊塔市場規模、佔有率和成長分析:按偽裝設計/類型、塔架結構、頻率/頻段相容性、安裝位置和地區分類-2026-2033年產業預測
 行動電話基地台管理市場:依接取技術、塔型、安裝方式、服務類型、高度等級、組件類型及最終用戶產業分類-2026-2032年全球市場預測
 2026年全球數位雙胞胎市場報告
 2026-2030年全球電信塔市場