


 |
市場調查報告書
商品編碼
2125385
北美垃圾袋市場:市場佔有率分析、產業趨勢與統計及成長預測(2026-2031 年)North America Trash Bags - Market Share Analysis, Industry Trends & Statistics, Growth Forecasts (2026 - 2031) |
||||||

※ 本網頁內容可能與最新版本有所差異。詳細情況請與我們聯繫。
根據 Mordor Intelligence 預測,北美垃圾袋市場規模將從 2025 年的 51.7 億美元,2026 年至 2031 年的年複合成長率(CAGR)為 5.69%。
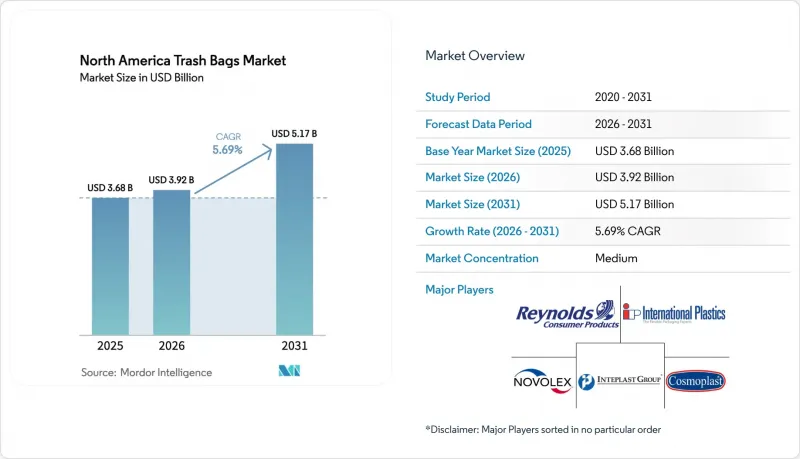
本報告按最終用戶(住宅、商用等)、產品類型(低密度聚乙烯袋等)、容量(小於8加侖、8-30加侖、其他)、原料來源(原生塑膠、消費後再生塑膠、混合材料、生物基樹脂)、銷售管道(線下零售、線上零售、其他)和地區進行細分。市場預測以美元(USD)計價。
北美垃圾袋市場趨勢與洞察
住宅垃圾的增加以及各州的掩埋廢棄物減量目標。
預計到2024年,美國家庭垃圾將達到2.92億噸,人均垃圾量因人口向大都會圈的遷移而增加。加州SB 1383法案以及紐約州和馬薩諸塞州的類似法規強制要求市政當局對有機垃圾進行分類收集,從而對符合ASTM D6400標準的可堆肥垃圾袋產生了明確的需求。市政採購部門擴大指定使用顏色編碼的多層垃圾袋,以防止路邊收集過程中發生交叉污染。加工商正在積極回應,推出新型共擠出生產線,在不影響可回收性的前提下嵌入顏料帶。這種資本投資的轉變使那些每年在研發方面投入超過500萬美元的現有公司受益。隨著類似的廢棄物減量目標擴展到加拿大各省,在監管確定性的推動下,北美垃圾袋市場正處於持續成長的軌道上。
財富500強企業承諾在其設施中實現零浪費
目前,超過180家財富500強企業正致力於取得TRUE或UL零廢棄物認證。此認證要求資源回收率超過90%,並將垃圾分類至少分為五類。為了簡化審核流程,各工廠正在改用透明內袋,這樣分類員無需打開袋子即可檢查內容物。預計到2025年,寶潔公司位於俄亥俄州利馬的工廠將因此減少12%的污染和工作時間。通用汽車公司(GM)已在60加侖的半透明垃圾袋中嵌入RFID標籤,因此可以追溯廢棄物的生產環節。這使得操作人員能夠接受針對性培訓,並減少分類錯誤。據商用清潔用品批發商稱,這些功能豐富的產品價格溢價20-30%,為掌握添加劑配方和線上印刷技術的加工企業創造了更高的利潤空間。隨著各企業以這種方式加大投入,北美垃圾袋市場正在形成一個永續的高階細分市場。
聚乙烯和生質塑膠原料價格波動劇烈
2025年,墨西哥灣沿岸颶風造成的破壞以及裂解裝置的停產導致低密度聚乙烯(LDPE)現貨價格在每磅0.52美元至0.68美元之間波動。由於缺乏價格轉嫁條款,自有品牌加工商被迫自行承擔這些價格上漲,進一步壓縮了本已低於12%的利潤率。生質塑膠原料價格也出現劇烈波動,由於中西部乾旱導致葡萄糖產量下降,聚乳酸(PLA)樹脂價格從每磅1.85美元上漲至2.31美元。中型企業目前持有60至90天的庫存以對沖價格波動風險,佔用了原本可用於共擠出設備升級和實驗室測試的營運資金。因此,成本的急劇上漲正在削弱整個北美垃圾袋市場的短期盈利。
細分市場分析
2025年,住宅用戶佔北美垃圾袋市佔率的45.67%。這得歸功於廣泛的路邊垃圾收集計劃,該計劃穩定了每週的廚房垃圾袋購買量。預計到2031年,工業用戶將以6.03%的複合年成長率成長,隨著聯邦政府資助的橋樑、道路和供水系統維修產生大量需要重型內襯的廢棄物,其在北美垃圾袋市場規模中的佔有率預計將會增加。建築公司指定使用容量為30至55加侖、設計可承受超過400磅/平方英吋(psi)穿刺力的垃圾袋,採購團隊願意為符合ASTM性能標準的產品支付25%至35%的溢價。 2025年,辦公室、零售商店和飯店設施約佔銷售量的32%,對含有抗菌添加劑的清潔袋的需求得益於運轉率回升至68%。
商業餐飲企業更傾向於使用符合 NSF 抗菌標準的認證垃圾袋,預計到 2025 年,這一細分市場將獲得 1,800 萬美元的創業投資資金投資。工業設施也開始採用嵌入 RFID 標籤的透明垃圾袋,使零廢棄負責人能夠追蹤污染源,直到具體的工作單元。儘管價格較高,但這項創新技術仍能確保長期合約的簽訂。住宅的需求保持穩定,但逐漸轉向使用市政免費發放的可重複使用垃圾桶。總體而言,預計在預測期內,工業終端用戶將為北美垃圾袋市場貢獻最大的增量收入。
預計到2025年,低密度聚乙烯(LDPE)的銷售額將佔總銷售額的41.23%,這得益於其使用後可添加高達40%的再生樹脂,且不會出現模具磨損或厚度變化。高密度聚苯乙烯(HDPE)在倉庫和建築工地等對剛性和防潮性要求較高的場所仍然發揮著重要作用,但其成長速度落後於LDPE和可堆肥產品。隨著加州SB 1383法案及類似法規的實施,有機垃圾收集袋必須符合ASTM D6400或EN 13432標準,預計可生物分解和可堆肥袋的年複合成長率將達到7.12%,成為所有產品類型中成長最快的。
雖然聚乳酸和澱粉混合產品的價格比低密度聚乙烯(LDPE)高出50-80%,但它們在受監管的地區享有壟斷地位,並在北美垃圾袋市場穩步擴大市場佔有率。隨著零售商和地方政府與環保組織簽署協議以減少塑膠使用,傳統的高密度聚乙烯(HDPE)的市場佔有率正在逐漸下降。然而,低密度聚乙烯的柔軟性、密封強度和成本優勢使其在家庭和小規模商業市場中保持主導地位,預計到2031年,其產品組合將保持平衡且不斷發展。
其他好處:
- Excel格式的市場預測(ME)表
- 3個月的分析師支持
目錄
第1章:引言
- 研究假設和市場定義
- 調查範圍
第2章:調查方法
第3章執行摘要
第4章 市場狀況
- 市場概覽
- 市場促進因素
- 住宅垃圾產生量的增加以及該州減少垃圾掩埋廢棄物的目標。
- 財富 500 強企業設施中的零浪費舉措
- 電子商務導致包裝材料快速週轉,從而增加了商業廢棄物的產生量。
- 地方政府推行按使用量付費(PAYT)制度,正在加速塑膠袋的消耗。
- 樹脂的高透明度和再生材料的加入,使其能夠賣出高價。
- 在醫療和食品服務行業引入抗菌襯墊
- 市場限制因素
- 聚乙烯和生質塑膠的原料價格波動很大。
- 一次性塑膠禁令和生產者延伸責任(EPR)法案
- 可重複使用托特包的推出導致零售庫存單位(SKU)被蠶食。
- 加強對物流排放的監控將遏制低等級班輪的進口。
- 產業價值鏈分析
- 監理情勢
- 技術展望
- 宏觀經濟因素對市場的影響
- 波特五力分析
- 香料和添加劑配方的發展趨勢
第5章 市場規模與成長預測
- 最終用戶
- 住宅
- 商業
- 產業
- 依產品類型
- 低密度聚乙烯(LDPE)袋
- 高密度聚苯乙烯(HDPE)袋
- 可生物分解和可堆肥的袋子
- 按容量(加侖)
- 少於 8 加侖(用於浴室)
- 8-30加侖(廚房用)
- 30-55加侖(適用於承包商)
- 55 加侖以上(工業桶內襯)
- 按原料來源
- 原生塑膠
- 回收塑膠
- 混合材料(再生材料+原生材料)
- 生物基樹脂
- 按銷售管道
- 實體零售店(雜貨店、量販店)
- 線上零售
- 商用的分銷
- 國家
- 美國
- 加拿大
- 墨西哥
第6章 競爭情勢
- 市場集中度
- 策略趨勢
- 市佔率分析
- 公司簡介
- Reynolds Consumer Products Inc.(Hefty)
- The Clorox Company(Glad Products Company)
- Novolex Holdings LLC
- Inteplast Group Corporation
- Riverside Paper Co. Inc.
- Cosmoplast Industrial Company LLC
- International Plastics Inc.
- Poly-America LP
- Four Star Plastics Inc.
- Neway Packaging Corporation
- All American Poly Corp.
- Aluf Plastics Inc.
- Petoskey Plastics Inc.
- Heritage Bag Company
- Crown Poly Inc.
- WasteZero Inc.
- Matrix Packaging LLC
- Elkay Plastics Co. Inc.
- Interplast Packaging LLC
- Super Bag Corp.
- RollPak Corp.
- Boulder Bag Company
第7章 市場機會與未來展望
According to Mordor Intelligence, the North America trash bags market size is projected to expand from USD 3.68 billion in 2025 and USD 3.92 billion in 2026 to USD 5.17 billion by 2031, registering a CAGR of 5.69% between 2026 to 2031.
This report is Segmented by End User (Residential, Commercial, and More), Product Type (Low-Density Polyethylene Bags, and More), Capacity (Less Than 8 Gal, 8-30 Gal, and More), Material Source (Virgin Plastic, Post-Consumer Recycled Plastic, Hybrid, and Bio-Based Resins), Sales Channel (Offline Retail, Online Retail, and More), and Geography. The Market Forecasts are Provided in Terms of Value (USD).
North America Trash Bags Market Trends and Insights
Residential Waste-Stream Expansion and State Landfill-Diversion Targets
Household waste in the United States reached 292 million tons in 2024, and population inflows into metropolitan areas are pushing per-capita disposal rates higher. California SB 1383 and comparable rules in New York and Massachusetts now obligate municipalities to collect organics separately, creating locked-in demand for ASTM D6400-compliant compostable liners. Municipal purchasing departments increasingly specify multi-layer bags with color cues that prevent cross-contamination during curbside pickup. Converters are answering with new coextrusion lines that embed pigment bands without compromising recyclability, a capital shift that favors incumbents already spending more than USD 5 million each year on R&D. As similar diversion targets propagate to Canadian provinces, the North America trash bags market gains a durable growth runway anchored in regulatory certainty.
Corporate Zero-Waste Pledges from Fortune 500 Facilities
More than 180 Fortune 500 companies now target TRUE or UL zero-waste certification, which requires diversion rates above 90% and segregation into at least five material streams. To streamline audits, plants are shifting to clear liners that let sorters verify contents without opening bags, cutting contamination and labor time at Procter and Gamble's Lima, Ohio, site by 12% in 2025. General Motors embedded RFID tags in 60-gallon translucent bags to trace waste back to production cells, enabling targeted operator training and fewer mis-sorted loads. Jan-san distributors report 20-30% price premiums for these feature-rich SKUs, creating margin headroom for converters that master additive dosing and inline printing. The expanding corporate pledge universe therefore secures a durable premium tier within the North America trash bags market.
Volatile Polyethylene and Bioplastic Feedstock Prices
LDPE spot prices swung between USD 0.52 and USD 0.68 per lb in 2025 after hurricane disruptions and cracker outages on the Gulf Coast. Without pass-through clauses, private-label converters absorb those spikes, eroding margins that typically run below 12%. Bioplastic inputs proved even choppier, with polylactic-acid resin climbing from USD 1.85 to USD 2.31 per lb as Midwest drought cut dextrose yields. Mid-tier firms now carry 60-90 days of inventory to hedge volatility, tying up working capital that could fund coextrusion upgrades or lab testing. Sudden cost jumps therefore sap near-term profitability across the North America trash bags market.
Other drivers and restraints analyzed in the detailed report include:
- Rapid E-Commerce Packaging Turnover Elevating Commercial Trash Volume
- Municipal Pay-As-You-Throw Programs Accelerating Bag Consumption
- Single-Use-Plastic Bans and Extended Producer Responsibility Laws
For complete list of drivers and restraints, kindly check the Table Of Contents.
Segment Analysis
The residential segment captured 45.67% of the North America trash bags market share in 2025, benefiting from widespread curbside programs that keep weekly kitchen-bag purchases steady. Industrial users are forecast to expand at a 6.03% CAGR through 2031, lifting their portion of the North America trash bags market size as federally funded bridge, road, and water-system upgrades create debris streams that require heavy-duty liners. Contractors specify 30-55 gallon bags engineered to resist puncture forces above 400 psi, and procurement teams pay premiums of 25-35% for products verified to ASTM performance standards. Commercial offices, retail locations, and hospitality venues accounted for roughly 32% of 2025 volume, with occupancy rebounding to 68% and supporting demand for janitorial liners that often feature antimicrobial additives.
Foodservice operators within the commercial bracket favor bags certified to NSF antimicrobial protocols, a niche that drew USD 18 million in venture funding during 2025. Industrial facilities also turn to transparent liners embedded with RFID tags so zero-waste auditors can trace contamination to specific workcells, an innovation that secures long-term contracts despite price premiums. Residential demand remains stable yet faces gradual substitution from reusable containers distributed under city give-away schemes. Overall, the industrial end user is set to contribute the largest incremental revenue to the North America trash bags market size over the forecast horizon.
Low-density polyethylene (LDPE) retained 41.23% of 2025 sales, sustained by tooling familiarity and the ability to incorporate up to 40% post-consumer resin without gauge drift. High-density polyethylene (HDPE) maintains relevance in warehouse and contractor settings where stiffness and moisture barriers are prized, but its advance lags LDPE and compostables. Biodegradable and compostable liners are projected to grow at a 7.12% CAGR, the fastest among product types, as California SB 1383 and similar rules legally obligate organics-collection bags to meet ASTM D6400 or EN 13432 standards.
Polylactic acid and starch-blend formulations cost 50-80% more than LDPE yet enjoy captive purchasing in regulated jurisdictions, steadily enlarging their slice of the North America trash bags market share. Conventional HDPE faces incremental erosion where retailers and municipalities forge plastic-reduction agreements with environmental groups. Still, LDPE's flexibility, seal strength, and cost advantage preserve its leadership in household and light-commercial channels, ensuring a balanced but shifting product-type mix through 2031.
Complete Report Scope:
- By End User
- Residential
- Commercial
- Industrial
- By Product Type
- Low-Density Polyethylene (LDPE) Bags
- High-Density Polyethylene (HDPE) Bags
- Biodegradable and Compostable Bags
- By Capacity (Gallons)
- Less than 8 Gal (Bathroom)
- 8 - 30 Gal (Kitchen)
- 30 - 55 Gal (Contractor)
- Above 55 Gal (Industrial Drum Liners)
- By Material Source
- Virgin Plastic
- Post-Consumer Recycled Plastic
- Hybrid (Recycled + Virgin)
- Bio-Based Resins
- By Sales Channel
- Offline Retail (Grocery, Mass Merchandiser)
- Online Retail
- Jan-San and Institutional Distribution
- By Country
- United States
- Canada
- Mexico
List of Companies Covered in this Report:
- Reynolds Consumer Products Inc. (Hefty)
- The Clorox Company (Glad Products Company)
- Novolex Holdings LLC
- Inteplast Group Corporation
- Riverside Paper Co. Inc.
- Cosmoplast Industrial Company LLC
- International Plastics Inc.
- Poly-America L.P.
- Four Star Plastics Inc.
- Neway Packaging Corporation
- All American Poly Corp.
- Aluf Plastics Inc.
- Petoskey Plastics Inc.
- Heritage Bag Company
- Crown Poly Inc.
- WasteZero Inc.
- Matrix Packaging LLC
- Elkay Plastics Co. Inc.
- Interplast Packaging LLC
- Super Bag Corp.
- RollPak Corp.
- Boulder Bag Company
Additional Benefits:
- The market estimate (ME) sheet in Excel format
- 3 months of analyst support
TABLE OF CONTENTS
1 INTRODUCTION
- 1.1 Study Assumptions and Market Definition
- 1.2 Scope of the Study
2 RESEARCH METHODOLOGY
3 EXECUTIVE SUMMARY
4 MARKET LANDSCAPE
- 4.1 Market Overview
- 4.2 Market Drivers
- 4.2.1 Residential Waste-Stream Expansion and State Landfill-Diversion Targets
- 4.2.2 Corporate Zero-Waste Pledges from Fortune 500 Facilities
- 4.2.3 Rapid E-Commerce Packaging Turnover Elevating Commercial Trash Volume
- 4.2.4 Municipal Pay-As-You-Throw (PAYT) Programs Accelerating Bag Consumption
- 4.2.5 High-Clarity, Recycled-Content Resins Enabling Premium Pricing
- 4.2.6 Adoption of Anti-Microbial Liners in Healthcare and Foodservice
- 4.3 Market Restraints
- 4.3.1 Volatile Polyethylene and Bioplastic Feedstock Prices
- 4.3.2 Single-Use-Plastic Bans and Extended-Producer-Responsibility (EPR) Laws
- 4.3.3 Retail SKU Cannibalization from Reusable Tote Initiatives
- 4.3.4 Logistics Emissions Scrutiny Curbing Import of Low-Grade Liners
- 4.4 Industry Value Chain Analysis
- 4.5 Regulatory Landscape
- 4.6 Technological Outlook
- 4.7 Impact of Macroeconomic Factors on the Market
- 4.8 Porter's Five Forces Analysis
- 4.8.1 Bargaining Power of Suppliers
- 4.8.2 Bargaining Power of Buyers
- 4.8.3 Threat of New Entrants
- 4.8.4 Threat of Substitutes
- 4.8.5 Intensity of Competitive Rivalry
- 4.9 Fragrance and Additive Formulation Trends
5 MARKET SIZE AND GROWTH FORECASTS (VALUE)
- 5.1 By End User
- 5.1.1 Residential
- 5.1.2 Commercial
- 5.1.3 Industrial
- 5.2 By Product Type
- 5.2.1 Low-Density Polyethylene (LDPE) Bags
- 5.2.2 High-Density Polyethylene (HDPE) Bags
- 5.2.3 Biodegradable and Compostable Bags
- 5.3 By Capacity (Gallons)
- 5.3.1 Less than 8 Gal (Bathroom)
- 5.3.2 8 - 30 Gal (Kitchen)
- 5.3.3 30 - 55 Gal (Contractor)
- 5.3.4 Above 55 Gal (Industrial Drum Liners)
- 5.4 By Material Source
- 5.4.1 Virgin Plastic
- 5.4.2 Post-Consumer Recycled Plastic
- 5.4.3 Hybrid (Recycled + Virgin)
- 5.4.4 Bio-Based Resins
- 5.5 By Sales Channel
- 5.5.1 Offline Retail (Grocery, Mass Merchandiser)
- 5.5.2 Online Retail
- 5.5.3 Jan-San and Institutional Distribution
- 5.6 By Country
- 5.6.1 United States
- 5.6.2 Canada
- 5.6.3 Mexico
6 COMPETITIVE LANDSCAPE
- 6.1 Market Concentration
- 6.2 Strategic Moves
- 6.3 Market Share Analysis
- 6.4 Company Profiles (includes Global Level Overview, Market Level Overview, Core Segments, Financials as available, Strategic Information, Market Rank/Share, Products and Services, Recent Developments)
- 6.4.1 Reynolds Consumer Products Inc. (Hefty)
- 6.4.2 The Clorox Company (Glad Products Company)
- 6.4.3 Novolex Holdings LLC
- 6.4.4 Inteplast Group Corporation
- 6.4.5 Riverside Paper Co. Inc.
- 6.4.6 Cosmoplast Industrial Company LLC
- 6.4.7 International Plastics Inc.
- 6.4.8 Poly-America L.P.
- 6.4.9 Four Star Plastics Inc.
- 6.4.10 Neway Packaging Corporation
- 6.4.11 All American Poly Corp.
- 6.4.12 Aluf Plastics Inc.
- 6.4.13 Petoskey Plastics Inc.
- 6.4.14 Heritage Bag Company
- 6.4.15 Crown Poly Inc.
- 6.4.16 WasteZero Inc.
- 6.4.17 Matrix Packaging LLC
- 6.4.18 Elkay Plastics Co. Inc.
- 6.4.19 Interplast Packaging LLC
- 6.4.20 Super Bag Corp.
- 6.4.21 RollPak Corp.
- 6.4.22 Boulder Bag Company
7 MARKET OPPORTUNITIES AND FUTURE OUTLOOK
- 7.1 White-Space and Unmet-Need Assessment

 美國垃圾袋:市場佔有率分析、行業趨勢和統計數據、成長預測(2026-2031)
 Bagster袋市場分析及至2035年預測:類型、產品、服務、應用、材料類型、部署、最終用戶、功能
 一次性垃圾袋市場:2026-2032年全球市場預測(依材質、厚度、尺寸、封口方式、最終用途及通路分類)
 一次性垃圾袋市場規模、佔有率和成長分析:按產品類型、容量、應用、分銷管道、最終用戶和地區分類-2026-2033年產業預測
 Bagster 袋市場:按材料類型、終端用戶行業、分銷管道、產品類型和地區分類危險廢棄物袋市場:依材料、容量、密封方法、應用、最終用戶、法規遵循和地區分類。垃圾袋市場:產品類型、材質、厚度、顏色、通路、應用、最終用途-2026-2032年全球市場預測
 垃圾袋市場報告:按類型、材質、尺寸、分銷管道、最終用戶和地區分類(2026-2034 年)垃圾袋:市佔率分析、產業趨勢與統計、成長預測(2026-2031)
 全球垃圾袋市場規模、佔有率、趨勢和成長分析報告(2026-2034年)