


 |
市場調查報告書
商品編碼
1940605
垃圾袋:市佔率分析、產業趨勢與統計、成長預測(2026-2031)Trash Bags - Market Share Analysis, Industry Trends & Statistics, Growth Forecasts (2026 - 2031) |
||||||
※ 本網頁內容可能與最新版本有所差異。詳細情況請與我們聯繫。
2025年垃圾袋市值為135.3億美元,預計到2031年將達到193.7億美元,而2026年為143.6億美元。
預計在預測期(2026-2031 年)內,複合年成長率將達到 6.15%。
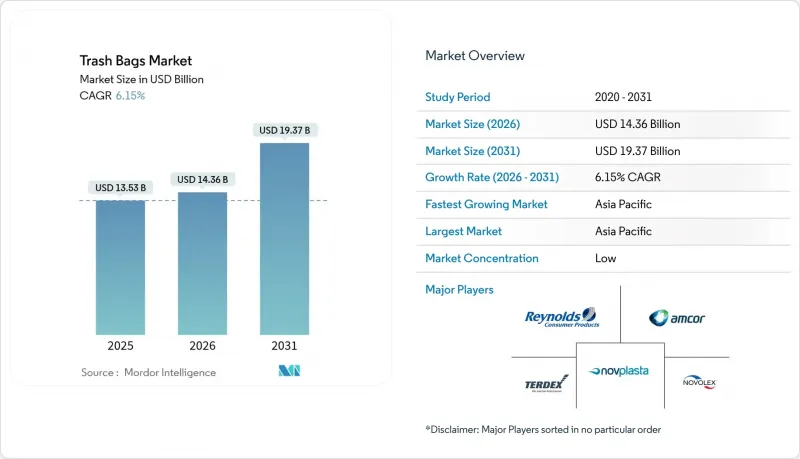
快速的都市化導致城市固態廢棄物量不斷增加,而計量型(PAYT)和更嚴格的生產者責任制正在重新定義產品規格,從而推動了對高品質、合規垃圾袋的需求。亞太地區仍然是最大的區域消費市場,受益於不斷成長的中產階級和日益完善的基礎設施。在北美和歐洲等成熟市場,一次性塑膠法規的壓力正在加速向再生塑膠和生物基薄膜的轉型。同時,乙烯價格的波動持續擠壓加工商的利潤空間,導致生產商之間的整合加劇。
全球垃圾袋市場趨勢與洞察
都市區廢棄物產生量不斷增加,以及無縫收集的必要性日益凸顯。
預計到2023年,都市固態廢棄物量將達到21億噸,2050年將達到38億噸。目前,都市區正在為自動垃圾收集車指定使用防刺穿、統一規格的垃圾袋,這推動了垃圾袋市場的成長。先導計畫,使燃料消耗降低了28%,收集效率提高了41.5%。這些變化正在推動對能夠在高溫氣候下保持形狀並能抵抗長期儲存劣化的薄膜的需求。
疫情後注重衛生的消費行為
到2024年,醫院將減少2.641億磅廢棄物掩埋,其中68%的醫院已實施永續採購措施。這促使醫療機構的採購部門優先考慮抗菌除臭內襯。為了滿足這項需求,諸如蛋殼混合EGU袋等高階產品已於2025年問世。旅館業也出現了類似的趨勢,推高了平均售價,並支撐了機構市場9.67%的複合年成長率。
禁止使用一次性塑膠製品和生產者延伸責任制
加州SB 54法案規定,到2032年一次性塑膠的使用量必須減少25%,並要求設立5億美元的年度清理基金。不列顛哥倫比亞省和歐盟的類似法規將處置成本轉嫁給生產商,並鼓勵對再生材料和可堆肥替代品進行投資。然而,合規的複雜性推高了成本,限制了低利潤供應商的進入,並抑制了垃圾袋市場的短期成長。
細分市場分析
儘管住宅袋市場主要由醫療機構、住宿設施和教育機構等機構用戶驅動,在2025年佔總收入的63.78%,但預計到2031年,其年複合成長率(CAGR)將達到9.58%。醫院的永續採購政策和更嚴格的感染控制通訊協定正在推動垃圾袋市場對抗菌防漏內襯的需求。機構買家更注重性能和合規性而非價格,因此支持採用再生材料和生物基材料製成的高階產品。住宅垃圾袋市場的需求仍然以銷量主導,並受到按需付費計劃和品牌忠誠度的支持,但價格敏感度較高,限制了其成長。
機構市場的快速成長促使供應商最佳化其基於規格的產品供應,並專注於簽訂多年合約。同時,居民用戶擴大更換香味增強垃圾袋,推高了平均單價。隨著市政當局大力推廣垃圾分類,這兩個用戶群體都擴大採用經過認證的顏色編碼垃圾袋,進一步擴大了垃圾袋市場。
低密度聚乙烯(LDPE)將佔據垃圾袋市場最大佔有率,市佔率高達38.41%,這主要得益於其價格優勢和成熟的生產流程。然而,生物基塑膠,例如聚乳酸(PLA)和聚羥基脂肪酸酯(PHA),預計將以10.42%的複合年成長率成長,這主要得益於企業淨零排放承諾和相關投資,例如NatureWorks在泰國投資3.5億美元建設的PLA工廠。在分解速度較慢的潮濕熱帶地區,可堆肥塑膠仍然稀少,但監管激勵措施正在縮小成本差距。同時,高密度聚乙烯(HDPE)和線性低密度聚乙烯(LLDPE)薄膜正擴大採用消費後回收樹脂,以維持其市場佔有率。
儘管設備升級和認證壁壘限制了材料加速轉化,但不斷上漲的掩埋稅和生產者延伸責任制(EPR)成本持續削弱化石基樹脂的成本優勢。能夠將循環利用與機械強度相結合的供應商,最有希望在不斷擴大的垃圾袋市場佔有率中佔據一席之地,成為永續替代品的有力競爭者。
區域分析
預計到2025年,亞太地區將佔全球收入的40.32%,並在2031年之前以8.05%的複合年成長率成長,這主要得益於中國和印度的城市擴張以及中產階級消費的成長。在韓國和日本,人工智慧分類機器人正在幫助增加再生高密度聚乙烯(HDPE)的供應,而熱帶氣候則阻礙了可堆肥袋的推廣應用。不同國家的禁令及回收目標各不相同,這要求全球供應商採取靈活的籌資策略。
在北美,成熟的基礎設施正基於加州SB54等生產者延伸責任制(EPR)法律不斷發展完善,加速再生材料和生物基內襯的轉型。已在6000個城市實施的計量型付費(PAYT)回收系統規定了認證的垃圾袋尺寸,從而支撐了穩定的單位需求,並促進了高附加價值產品比例的提升。專注於衛生家庭的高級產品,例如Glad於2025年4月推出的雙倍強度垃圾袋,也正在出現。
歐洲正積極推行循環經濟政策,並大力推行再生材料使用政策。德國的回收池系統和法國即將推出的押金返還計劃,標誌著全部區域歐洲正朝著減少廢棄物的方向邁進。像Cyca Flex這樣的包裝製造商,如今提供100%可回收薄膜,其中至少含有5%的消費後再生材料(PCR),這進一步鞏固了歐洲作為永續標竿的地位。
其他福利:
- Excel格式的市場預測(ME)表
- 3個月的分析師支持
目錄
第1章 引言
- 研究假設和市場定義
- 調查範圍
第2章調查方法
第3章執行摘要
第4章 市場情勢
- 市場概覽
- 市場促進因素
- 都市區廢棄物產生量不斷增加,以及無縫收集的必要性日益凸顯。
- 疫情後注重衛生的消費行為
- 計量型(PAYT)市政收費模式的興起
- 隨著網路食品雜貨銷售的成長,對防漏襯墊的需求也在成長。
- 生質塑膠與低密度聚乙烯/線性低密度聚乙烯原料的價格平行化
- 配備人工智慧的機器人分類機促進了再生高密度聚乙烯的供應
- 市場限制
- 禁止使用一次性塑膠製品和生產者延伸責任制
- 乙烯價格波動對轉換企業的利潤率帶來壓力。
- 潮濕氣候下可堆肥袋的性能差距
- 零售連鎖店正擴大試用可重複填充和再利用站。
- 供應鏈分析
- 監管環境
- 技術展望
- 波特五力模型
- 新進入者的威脅
- 買方的議價能力
- 供應商的議價能力
- 替代品的威脅
- 競爭對手之間的競爭
第5章 市場規模與成長預測
- 最終用戶
- 住宅
- 機構(餐飲旅館業、醫療、教育)
- 商業和工業
- 依材料類型
- 高密度聚苯乙烯(HDPE)
- 低密度聚乙烯(LDPE)
- 線型低密度聚乙烯(LLDPE)
- 生物基/生物分解性塑膠(PLA、PBAT、PHA)
- 依體積/按袋裝
- 最多 10 加侖
- 13至30加侖
- 30至55加侖
- 55加侖或更多
- 按銷售管道
- 零售(超級市場、便利商店、線上)
- B2B/機構採購
- 分銷/批發
- 按地區
- 北美洲
- 美國
- 加拿大
- 墨西哥
- 歐洲
- 德國
- 英國
- 法國
- 義大利
- 西班牙
- 俄羅斯
- 其他歐洲地區
- 亞太地區
- 中國
- 印度
- 日本
- 韓國
- 澳洲和紐西蘭
- 亞太其他地區
- 中東和非洲
- 中東
- 阿拉伯聯合大公國
- 沙烏地阿拉伯
- 土耳其
- 其他中東地區
- 非洲
- 南非
- 奈及利亞
- 埃及
- 其他非洲地區
- 中東
- 南美洲
- 巴西
- 阿根廷
- 其他南美洲
- 北美洲
第6章 競爭情勢
- 市場集中度
- 策略趨勢
- 市佔率分析
- 公司簡介
- Amcor Plc
- Reynolds Consumer Products(Hefty)
- The Clorox Company(Glad)
- Novolex Holdings LLC
- Inteplast Group Ltd.
- Poly-America LP
- Pack-It BV
- Kemii Garbage Bag Co. Ltd.
- Cosmoplast Industrial Co. LLC
- Luban Packing LLC
- International Plastics Inc.
- Novplasta sro
- Terdex GmbH
- Simplehuman LLC
- Ruffies/Pactiv Evergreen
- WasteZero Inc.
- Al-Sinai Plastic Factory
- Abu Dawood Group(Pekoe)
- Thai Plastic Bag Industry Co. Ltd.
- Crown Poly Inc.
第7章 市場機會與未來展望
The trash bags market was valued at USD 13.53 billion in 2025 and estimated to grow from USD 14.36 billion in 2026 to reach USD 19.37 billion by 2031, at a CAGR of 6.15% during the forecast period (2026-2031).
Rapid urbanization is swelling municipal solid-waste volumes, while pay-as-you-throw (PAYT) schemes and stricter producer-responsibility rules are redefining product specifications and boosting demand for premium, compliant liners. Asia-Pacific remains the largest regional consumer, benefitting from expanding middle-class populations and infrastructure upgrades. Mature markets in North America and Europe, pressured by single-use-plastic curbs, are accelerating shifts toward recycled and bio-based film grades. At the same time, volatile ethylene pricing continues to squeeze converter margins, reinforcing consolidation among producers.
Global Trash Bags Market Trends and Insights
High-Urban Waste Generation and Need for Seamless Collection
Municipal solid-waste volumes reached 2.1 billion t in 2023 and are on track for 3.8 billion t by 2050. Cities now specify puncture-resistant, uniform liners compatible with automated trucks, spurring growth of the trash bags market. IoT-enabled bins paired with AI route optimization have cut fuel use 28% and lifted collection efficiency 41.5% in pilot projects. These shifts increase demand for films that hold shape in high-heat climates and resist extended storage degradation.
Hygiene-Centric Consumer Behaviour Post-Pandemics
Hospitals diverted 264.1 million lb of waste from landfills in 2024, and 68% adopted sustainable purchasing rules, pushing institutional buyers toward antimicrobial, odor-neutralizing liners. Premium SKUs such as eggshell-infused EGU bags debuted in 2025 to capture this demand. Similar trends in hospitality are lifting average selling prices and underpinning the institutional segment's 9.67% CAGR.
Single-Use-Plastic Bans and Extended-Producer Responsibility
California's SB 54 compels a 25% cut in single-use plastics by 2032 and requires USD 500 million in annual cleanup funding. Similar mandates in British Columbia and the EU shift disposal costs to producers, forcing investments in recycled content and compostable alternatives. Compliance complexity elevates costs and limits access for low-margin suppliers, restraining near-term expansion of the trash bags market.
Other drivers and restraints analyzed in the detailed report include:
- Rise of PAYT Municipal Fee Models
- Expansion of Online Grocery Demanding Leak-Proof Liners
- Volatile Ethylene Prices Squeezing Converter Margins
For complete list of drivers and restraints, kindly check the Table Of Contents.
Segment Analysis
Institutional users-healthcare, hospitality and education-propelled 9.58% CAGR to 2031, even as the residential segment retained 63.78% of 2025 revenue. Hospitals' sustainable procurement policies and stricter infection-control protocols are driving demand for antimicrobial, leak-proof liners in the trash bags market. Institutional buyers value performance and compliance over price, supporting premium SKUs with recycled or bio-based content. Residential demand remains volume-driven, buoyed by PAYT programs and brand loyalty but constrained by price sensitivity.
The institutional upsurge encourages suppliers to refine spec-based offerings and secure multi-year contracts. At the same time, household buyers increasingly trade up to scented or reinforced bags, expanding average unit values. As city governments introduce differentiated collection streams, both user groups are turning to certified color-coded liners, further enlarging the trash bags market.
LDPE held the largest 38.41% trash bags market share in 2025 thanks to price and process familiarity. Yet bio-based plastics such as PLA and PHA are poised for 10.42% CAGR, catalyzed by corporate net-zero pledges and investments like NatureWorks' USD 350 million PLA plant in Thailand. Compostable grades still lag in humid tropics where degradation rates slow, but regulatory incentives are narrowing cost gaps. HDPE and LLDPE films, meanwhile, are integrating post-consumer resin to maintain market relevance.
Equipment upgrades and certification hurdles are tempering a swift material shift, yet rising landfill levies and EPR fees continue to erode the cost advantage of fossil-based resins. Suppliers that can merge circular content with mechanical strength are best positioned to capture the expanding trash bags market size for sustainable variants.
The Trash Bags Market Report is Segmented by End-User (Residential, Institutional, Commercial and Industrial), Material Type (HDPE, LDPE, LLDPE, Bio-based/Biodegradable Plastics), Capacity/Bag Size (Up To 10 Gallon, 13-30 Gallon, 30-55 Gallon, Above 55 Gallon), Sales Channel (Retail, B2B/Institutional Procurement, Distribution/Wholesale), and Geography. The Market Forecasts are Provided in Terms of Value (USD).
Geography Analysis
Asia-Pacific generated 40.32% of global revenue in 2025 and is on track for an 8.05% CAGR to 2031, driven by urban sprawl in China and India and widening middle-class consumption. AI-enabled sorting robots in South Korea and Japan are lifting recycled-HDPE availability, while tropical climates complicate compostable-bag deployment. Diverse national bans and recycling targets require flexible sourcing strategies for global suppliers.
North America's mature infrastructure is evolving under EPR legislation such as California's SB 54, prompting a pivot to recycled and bio-based liners. PAYT programs in 6,000 communities now dictate certified bag sizes, underpinning stable unit demand and supporting a higher-value mix. Premium innovations, including Glad's 2X stronger bags launched in April 2025, cater to hygiene-aware households.
Europe's circular-economy agenda is spurring aggressive recycled-content mandates. Germany's reuse pools and France's incoming deposit-return schemes exemplify region-wide momentum toward waste reduction. Packaging groups such as Saica Flex now market 100% recyclable films with minimum 5% PCR, consolidating Europe's position as a bellwether for sustainable standards.
- Amcor Plc
- Reynolds Consumer Products (Hefty)
- The Clorox Company (Glad)
- Novolex Holdings LLC
- Inteplast Group Ltd.
- Poly-America LP
- Pack-It BV
- Kemii Garbage Bag Co. Ltd.
- Cosmoplast Industrial Co. LLC
- Luban Packing LLC
- International Plastics Inc.
- Novplasta s.r.o.
- Terdex GmbH
- Simplehuman LLC
- Ruffies / Pactiv Evergreen
- WasteZero Inc.
- Al-Sinai Plastic Factory
- Abu Dawood Group (Pekoe)
- Thai Plastic Bag Industry Co. Ltd.
- Crown Poly Inc.
Additional Benefits:
- The market estimate (ME) sheet in Excel format
- 3 months of analyst support
TABLE OF CONTENTS
1 INTRODUCTION
- 1.1 Study Assumptions and Market Definition
- 1.2 Scope of the Study
2 RESEARCH METHODOLOGY
3 EXECUTIVE SUMMARY
4 MARKET LANDSCAPE
- 4.1 Market Overview
- 4.2 Market Drivers
- 4.2.1 High-urban waste generation and need for seamless collection
- 4.2.2 Hygiene-centric consumer behaviour post-pandemics
- 4.2.3 Rise of pay-as-you-throw (PAYT) municipal fee models
- 4.2.4 Expansion of on-line grocery demanding leak-proof liners
- 4.2.5 Bioplastic price parity with LDPE/LLDPE feedstocks
- 4.2.6 AI-enabled robotic sorters boosting recycled-HDPE supply
- 4.3 Market Restraints
- 4.3.1 Single-use-plastic bans and extended-producer?responsibility
- 4.3.2 Volatile ethylene prices squeezing converter margins
- 4.3.3 Compostable-bag performance gaps in humid climates
- 4.3.4 Growing refill/reuse station pilots in retail chains
- 4.4 Supply-Chain Analysis
- 4.5 Regulatory Landscape
- 4.6 Technological Outlook
- 4.7 Porter's Five Forces
- 4.7.1 Threat of New Entrants
- 4.7.2 Bargaining Power of Buyers
- 4.7.3 Bargaining Power of Suppliers
- 4.7.4 Threat of Substitutes
- 4.7.5 Competitive Rivalry
5 MARKET SIZE AND GROWTH FORECASTS (VALUE)
- 5.1 By End-user
- 5.1.1 Residential
- 5.1.2 Institutional (HoReCa, Healthcare, Education)
- 5.1.3 Commercial and Industrial
- 5.2 By Material Type
- 5.2.1 High-Density Polyethylene (HDPE)
- 5.2.2 Low-Density Polyethylene (LDPE)
- 5.2.3 Linear Low-Density Polyethylene (LLDPE)
- 5.2.4 Bio-based/Biodegradable Plastics (PLA, PBAT, PHA)
- 5.3 By Capacity / Bag Size
- 5.3.1 Up to 10 Gallon
- 5.3.2 13 - 30 Gallon
- 5.3.3 30 - 55 Gallon
- 5.3.4 Above 55 Gallon
- 5.4 By Sales Channel
- 5.4.1 Retail (Supermarkets, Convenience, Online)
- 5.4.2 B2B / Institutional Procurement
- 5.4.3 Distribution / Wholesale
- 5.5 By Geography
- 5.5.1 North America
- 5.5.1.1 United States
- 5.5.1.2 Canada
- 5.5.1.3 Mexico
- 5.5.2 Europe
- 5.5.2.1 Germany
- 5.5.2.2 United Kingdom
- 5.5.2.3 France
- 5.5.2.4 Italy
- 5.5.2.5 Spain
- 5.5.2.6 Russia
- 5.5.2.7 Rest of Europe
- 5.5.3 Asia-Pacific
- 5.5.3.1 China
- 5.5.3.2 India
- 5.5.3.3 Japan
- 5.5.3.4 South Korea
- 5.5.3.5 Australia and New Zealand
- 5.5.3.6 Rest of Asia-Pacific
- 5.5.4 Middle East and Africa
- 5.5.4.1 Middle East
- 5.5.4.1.1 United Arab Emirates
- 5.5.4.1.2 Saudi Arabia
- 5.5.4.1.3 Turkey
- 5.5.4.1.4 Rest of Middle East
- 5.5.4.2 Africa
- 5.5.4.2.1 South Africa
- 5.5.4.2.2 Nigeria
- 5.5.4.2.3 Egypt
- 5.5.4.2.4 Rest of Africa
- 5.5.4.1 Middle East
- 5.5.5 South America
- 5.5.5.1 Brazil
- 5.5.5.2 Argentina
- 5.5.5.3 Rest of South America
- 5.5.1 North America
6 COMPETITIVE LANDSCAPE
- 6.1 Market Concentration
- 6.2 Strategic Moves
- 6.3 Market Share Analysis
- 6.4 Company Profiles (includes Global level Overview, Market level overview, Core Segments, Financials as available, Strategic Information, Market Rank/Share for key companies, Products and Services, and Recent Developments)
- 6.4.1 Amcor Plc
- 6.4.2 Reynolds Consumer Products (Hefty)
- 6.4.3 The Clorox Company (Glad)
- 6.4.4 Novolex Holdings LLC
- 6.4.5 Inteplast Group Ltd.
- 6.4.6 Poly-America LP
- 6.4.7 Pack-It BV
- 6.4.8 Kemii Garbage Bag Co. Ltd.
- 6.4.9 Cosmoplast Industrial Co. LLC
- 6.4.10 Luban Packing LLC
- 6.4.11 International Plastics Inc.
- 6.4.12 Novplasta s.r.o.
- 6.4.13 Terdex GmbH
- 6.4.14 Simplehuman LLC
- 6.4.15 Ruffies / Pactiv Evergreen
- 6.4.16 WasteZero Inc.
- 6.4.17 Al-Sinai Plastic Factory
- 6.4.18 Abu Dawood Group (Pekoe)
- 6.4.19 Thai Plastic Bag Industry Co. Ltd.
- 6.4.20 Crown Poly Inc.
7 MARKET OPPORTUNITIES AND FUTURE OUTLOOK
- 7.1 White-space and Unmet-need Assessment
 垃圾袋市場:產品類型、材質、厚度、顏色、通路、應用、最終用途-2026-2032年全球市場預測
 垃圾袋市場報告:按類型、材質、尺寸、分銷管道、最終用戶和地區分類(2026-2034 年)
 全球垃圾袋市場規模、佔有率、趨勢和成長分析報告(2026-2034年)
 2026年全球垃圾袋市場報告汽車垃圾袋市場按類型、分銷管道、材料、最終用戶和銷售分類-全球預測(2026-2032 年)
 北美垃圾袋:市佔率分析、產業趨勢與統計、成長預測(2026-2031)
 垃圾袋市場規模、佔有率和成長分析(按材料、類型和地區分類)-2026-2033年產業預測
 戶外垃圾桶市場-全球產業規模、佔有率、趨勢、機會和預測,按產品類型(腳踏式垃圾桶、感應式垃圾桶、其他)、應用領域(住宅、商業)、地區和競爭格局分類,2020-2030年預測
 垃圾袋的全球市場:材料類型·產品類型·容量·終端用戶產業·流通管道·各地區 (~2035年)
 全球垃圾袋市場