


 |
市場調查報告書
商品編碼
2124974
光開關:市佔率分析、產業趨勢與統計、成長預測(2026-2031)Optical Switches - Market Share Analysis, Industry Trends & Statistics, Growth Forecasts (2026 - 2031) |
||||||

※ 本網頁內容可能與最新版本有所差異。詳細情況請與我們聯繫。
根據 Mordor Intelligence 預測,光開關市場規模預計將在 2026 年達到 80.6 億美元,到 2031 年將擴大到 127.1 億美元,複合年成長率為 9.54%。
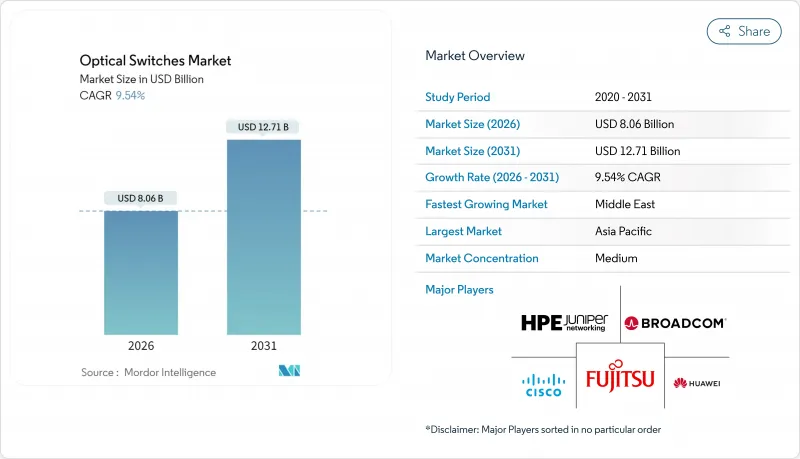
本報告依交換技術(電光交換、熱光交換及其他)、連接埠數量(1x2、1x4、1x8、1x16 或更多)、資料速率(最高 40Gbps、40–100Gbps 及其他)、終端用戶產業(IT 與電信、製造業及其他)、應用程式交換、交換、市場預測以美元計價。
全球光開關市場趨勢與洞察
超大規模資料中心的建設正在迅速增加。
超大規模資料中心業者正轉向光纖架構,以降低電力消耗並緩解延遲峰值。微軟計畫在 2025 年在 12 個 Azure 可用區部署光路交換機,進而將機架級電力消耗降低 18%。 AWS 正在為其即將推出的 Graviton 平台採用與矽光電共封裝的光學模組,旨在消除機架頂部跳頻。 Google和 Meta 的類似舉措凸顯了向確定性東西頻寬的結構性轉變。這些升級主要集中在維吉尼亞、奧勒岡州、新加坡和阿拉伯聯合大公國,這些地區的電力成本和稅收優惠政策都較為有利。
5G技術的快速發展以及6G回程傳輸的計畫提升
行動電信商正在中心機房和邊緣站點部署光交換機,以聚合來自數千個小型基地台的流量。中國移動已在47個省級樞紐部署了MEMS交換機,減少了29%的租用線路對數量。印度Bharti Airtel也在18個大都會圈效仿,而沃達豐的開放式無線接入網(Open RAN)計畫則採用了光交叉連接器,以實現即時去程傳輸流量重新分配。全球行動通訊系統協會(GSM協會)已將光電路交換定位為6G回程傳輸的基礎,並強調了未來的流量需求。
電子葉脊織物價格溢價持續存在
在 100Gbps 和 200Gbps 連接埠級別,光交換器的價格仍然比電子交換器高出 35% 到 50%。 Dell'Oro 預計,到 2025 年第二季度,一台 32 埠光交換器底盤的價格將達到 47,000 美元,而同等配置的電子交換機的價格為 31,000 美元。許多中型企業無法承受 Arista Networks 提供的三年投資回收期,這減緩了光交換機在超大規模環境之外的普及速度。
細分市場分析
預計到2025年,MEMS技術將佔據43.89%的市場佔有率,並將以10.62%的複合年成長率持續成長至2031年。隨著超大規模資料中心業者資料中心對亞毫秒重配置以實現AI工作負載負載平衡的需求不斷成長,MEMS平台光開關的市場規模也不斷擴大。 Calient公司推出的1024 x 1024陣列,其插入損耗低於2.5 dB,證明了高埠MEMS正在取代叢集中的脊形路由器。電光鈮酸鋰元件的各種變體主要面向金融和國防等需要奈秒開關的細分市場,但其高功耗限制了其主流應用。熱光元件在對成本敏感的城域網路合約中具有優勢,而磁光開關目前仍僅限於量子運算領域的先導計畫。專利申請量年增47%,反映出驅動物理領域的積極研發活動。
次要影響主要體現在供應鏈的變化。台灣和韓國的專業MEMS晶圓廠提供從設計到生產的一站式服務,降低了新創企業的進入門檻,並拓寬了買家的供應商選擇範圍。在歐洲,符合IEC 61753可靠性協議已成為強制性要求,供應商正在加固其產品,使其能夠承受每天數百萬次的循環測試。這些趨勢共同鞏固了MEMS作為未來光開關市場競爭標竿的地位。
由於1X8產品系列在接取聚合和測試測量機架中廣泛應用,預計到2025年將佔據36.71%的銷售佔有率。然而,隨著超大規模業者尋求建構脊椎級網狀網路,市場需求正迅速轉向1X16及更高階的矩陣,並以10.41%的複合年成長率成長。 Lumentum公司為Meta資料中心現代化改造計畫新近獲得認證的1X32 MEMS開關就是一個典型的例子。低階型號,例如1X2鎖存型,在保護方案中仍然至關重要,但其銷售貢獻較小。
高密度產品支援光路交換疊加,無需使用分組矽即可卸載“大象流”,從而顯著降低延遲。例如,歐洲一個研究網路在部署 1x64 陣列後,延遲降低了 68%。鑑於這些顯著優勢,預計到本世紀末,高階口交換機的端口數量將超過傳統交換機,進一步提升其在光交換機市場的戰略地位。
區域分析
受中國量子骨幹網、印度5G獨立組網部署以及日本奧運後資料中心熱潮的推動,亞太地區預計到2025年將佔全球收入的35.79%。中國移動正在利用光交換技術連接12個省份,建構量子鏈路,目標是到2028年涵蓋50個城市。 Bharti Airtel在18個大都會圈部署光纖網路,已將回程傳輸光纖需求降低了31%。光交換技術被列為韓國6G藍圖中實現兆赫去程傳輸的實行技術,而澳洲國家寬頻網路(NBN)已投資12億澳元(約8.04億美元)用於升級其光纖網路。
在中東地區,受沙烏地阿拉伯和阿拉伯聯合大公國雲端容量在地化發展的推動,預計到2031年,該地區年均成長率將達到10.51%。沙烏地電信已部署MEMS交換機,以支援NEOM智慧城市的骨幹網路和即時電網自動化。阿拉伯聯合大公國電信已將光纖網路整合到其5G核心網路中,旨在為工業IoT實現亞毫秒延遲。
預計到2025年,北美將佔全球需求的約30%,這主要得益於微軟、亞馬遜和谷歌斥資150億美元進行的超大規模基礎設施維修。歐洲將佔近22%,德國和法國的電信業者正在加速升級,以符合能源效率法規的要求。南美和非洲合計佔比不到8%,但巴西新分配的頻段和肯亞的光纖走廊建設資金正在推動這兩個地區的成長。歐盟的《網路與資訊安全指令2》和美國聯邦通訊委員會(FCC)提案的互通性強制令等法規結構,預計將透過標準化安全性和相容性標準,影響各地區的普及曲線。
其他好處
- Excel格式的市場預測(ME)表
- 3個月的分析師支持
目錄
第1章:引言
- 研究假設和市場定義
- 調查範圍
第2章:調查方法
第3章執行摘要
第4章 市場狀況
- 市場概覽
- 市場促進因素
- 超大規模資料中心的建設正在迅速增加。
- 5G技術的快速發展以及6G回程傳輸的計畫提升
- 矽光電在傳輸速率超過 400Gbps 的連接埠中的成本曲線交點
- 旨在鼓勵全光交換的能源效率法規
- 政府試行部署量子網路
- 人工智慧驅動的光纖網路自動化與自癒
- 市場限制因素
- 電子葉脊織物價格溢價持續存在
- 缺乏多Terabit光纖結構的專業知識
- III-V族晶圓供不應求對供應鏈的影響
- 關鍵任務用戶網路彈性身份驗證延遲
- 產業價值鏈分析
- 宏觀經濟因素對市場的影響
- 監理情勢
- 技術展望
- 波特五力分析
第5章 市場規模與成長預測
- 透過轉換技術
- 電光開關
- 聲光開關
- 基於MEMS的開關
- 磁光開關
- 熱光開關
- 其他交換技術
- 按連接埠數量
- 1 x 2
- 1x4
- 1 x 8
- 1 x 16 或以上
- 按數據速率
- 最高可達 40Gbps
- 40~100Gbps
- 100~400Gbps
- 400Gbps 或更高
- 按最終用戶行業分類
- 資訊科技/通訊
- 政府/國防
- 銀行、金融服務和保險(BFSI)
- 製造業
- 醫療保健和生命科學
- 其他
- 透過使用
- 電路切換
- 檢查和監測
- 連接複用
- 交叉連接
- 訊號監測
- 其他
- 按地區
- 北美洲
- 美國
- 加拿大
- 墨西哥
- 歐洲
- 德國
- 英國
- 法國
- 俄羅斯
- 其他歐洲國家
- 亞太地區
- 中國
- 日本
- 印度
- 韓國
- 澳洲
- 其他亞太國家
- 中東和非洲
- 中東
- 沙烏地阿拉伯
- 阿拉伯聯合大公國
- 其他中東國家
- 非洲
- 南非
- 埃及
- 其他非洲地區
- 中東
- 南美洲
- 巴西
- 阿根廷
- 南美洲其他地區
- 北美洲
第6章 競爭情勢
- 市場集中度
- 策略趨勢
- 市佔率分析
- 公司簡介
- Broadcom Inc.
- Cisco Systems Inc.
- Huawei Technologies Co. Ltd.
- Fujitsu Ltd.
- Nokia Corporation
- Juniper Networks Inc.
- NTT Advanced Technology Corporation
- Furukawa Electric Co. Ltd.
- Keysight Technologies Inc.
- Agiltron Inc.
- Ciena Corporation
- Infinera Corporation
- Huber+Suhner AG
- Lumentum Holdings Inc.
- II-VI Incorporated(Coherent Corp.)
- DiCon Fiberoptics Inc.
- Sercalo Microtechnology Ltd.
- Calient Technologies Inc.
- Accelink Technologies Co. Ltd.
- HYC Co. Ltd.
第7章 市場機會與未來展望
According to Mordor Intelligence, the optical switches market size reached USD 8.06 billion in 2026 and is projected to climb to USD 12.71 billion by 2031, advancing at a 9.54% CAGR.
This report is Segmented by Switching Technology (Electro-Optic, Thermo-Optic Switching, and More), Port Count (1X2, 1X4, 1X8, and 1X16 and Above), Data Rate (Up To 40 Gbps, 40-100 Gbps, and More), End-User Industry (IT and Telecom, Manufacturing, and More), Application (Circuit Switching, Multiplexing, Cross-Connects, and More), and Geography. The Market Forecasts are Provided in Terms of Value (USD).
Global Optical Switches Market Trends and Insights
Surge in Hyperscale Data-Center Buildouts
Hyperscalers are shifting to optical fabrics to shave power budgets and curb latency spikes. Microsoft rolled out optical circuit switches across 12 Azure zones in 2025 and cut rack-level power draw by 18%. AWS is committed to silicon-photonics co-packaged optics for its next Graviton platforms, eliminating top-of-rack hops. Similar moves by Google and Meta confirmed a structural transition toward deterministic east-west bandwidth. These upgrades concentrate in Virginia, Oregon, Singapore, and the United Arab Emirates, where electricity costs and tax policies are favorable.
Rapid 5G and Forthcoming 6G Backhaul Densification
Mobile operators are inserting optical switches into central offices and edge sites to aggregate traffic from thousands of small cells. China Mobile equipped 47 provincial hubs with MEMS switches, trimming leased-fiber pairs by 29%. Bharti Airtel followed in 18 Indian metro areas, while Vodafone's Open RAN plan embeds optical cross-connects for real-time fronthaul redistribution. The GSM Association has already positioned optical circuit switching as a baseline for 6G backhaul, underscoring future traffic requirements.
Persistent Premium Over Electronic Leaf-Spine Fabrics
At 100- and 200 Gbps port tiers, optical switches remain 35-50% more expensive than their electronic peers. Dell'Oro pegged a 32-port optical chassis at USD 47,000 versus USD 31,000 for an electronic equivalent in Q2 2025. Many mid-tier enterprises cannot absorb the three-year payback threshold cited by Arista Networks, slowing penetration outside hyperscale footprints.
Other drivers and restraints analyzed in the detailed report include:
- Silicon-Photonics Cost Curve Crossing for >=400 Gbps Ports
- Energy-Efficiency Mandates Favoring All-Optical Switching
- Limited Field Expertise for Multi-Terabit Optical Fabrics
For complete list of drivers and restraints, kindly check the Table Of Contents.
Segment Analysis
MEMS technology accounted for 43.89% of the market in 2025 and is tracking a 10.62% CAGR through 2031. The optical switches market size for MEMS platforms is climbing as hyperscalers specify sub-millisecond reconfiguration for AI workload balancing. Calient's 1,024X1,024 array, with insertion loss below 2.5 dB, illustrates how high-port-count MEMS is replacing spine routers in pods. Electro-optic lithium niobate variants target nanosecond-switching niches, mainly finance and defense, but their higher power draw curbs mainstream adoption. Thermo-optic devices are winning cost-sensitive metro contracts, while magneto-optic switches stay limited to quantum pilots. Patent filings grew 47% year over year, reflecting brisk R&D in actuation physics.
Second-order effects center on supply-chain shifts. Specialized MEMS fabs in Taiwan and South Korea offer design-to-production services, lowering entry barriers for startups and widening vendor choice for buyers. Compliance with IEC 61753 reliability protocols is now non-negotiable in Europe, spurring vendors to harden products for millions of daily cycles. Collectively, these dynamics entrench MEMS as the benchmark for future competitive benchmarking in the optical switches market.
The 1X8 cohort held a 36.71% revenue share in 2025, owing to broad adoption in access aggregation and test-and-measurement racks. Yet demand is rapidly tilting toward 1X16 and larger matrices, expanding at a 10.41% CAGR as hyperscale operators pursue spine-level mesh fabrics. Lumentum's newly qualified 1X32 MEMS switch for Meta's data-center refresh is emblematic. Lower tiers, such as 1X2 latching models, remain vital for protection schemes but generate less revenue.
High-density products enable optical circuit-switched overlays that offload elephant flows without engaging packet silicon, driving step-function latency gains. European research networks, for example, documented a 68% reduction in latency after inserting 1X64 arrays. Given these measurable advantages, large-port switches are expected to eclipse legacy counts before the end of the decade, reinforcing their strategic importance in the optical switches market.
Complete Report Scope:
- By Switching Technology
- Electro-Optic Switching
- Acousto-Optic Switching
- MEMS-Based Switching
- Magneto-Optic Switching
- Thermo-Optic Switching
- Other Switching Technologies
- By Port Count
- 1X2
- 1X4
- 1X8
- 1X16 and Above
- By Data Rate
- Up to 40 Gbps
- 40-100 Gbps
- 100-400 Gbps
- Above 400 Gbps
- By End-User Industry
- IT and Telecom
- Government and Defense
- Banking, Financial Services, and Insurance (BFSI)
- Manufacturing
- Healthcare and Life Sciences
- Other End-User Industries
- By Application
- Circuit Switching
- Testing and Monitoring
- Multiplexing
- Cross-Connects
- Signal Monitoring
- Other Applications
- By Geography
- North America
- United States
- Canada
- Mexico
- Europe
- Germany
- United Kingdom
- France
- Russia
- Rest of Europe
- Asia-Pacific
- China
- Japan
- India
- South Korea
- Australia
- Rest of Asia-Pacific
- Middle East and Africa
- Middle East
- Saudi Arabia
- United Arab Emirates
- Rest of Middle East
- Africa
- South Africa
- Egypt
- Rest of Africa
- Middle East
- South America
- Brazil
- Argentina
- Rest of South America
- North America
Geography Analysis
Asia Pacific generated 35.79% of global revenue in 2025, fueled by China's quantum backbones, India's 5G standalone buildouts, and Japan's post-Olympic data-center boom. China Mobile connected 12 provincial quantum links with optical switches, aiming for 50-city coverage by 2028. Bharti Airtel's optical fiber rollout across 18 metros reduced backhaul fiber requirements by 31%. South Korea's 6G roadmap names optical switching as a terahertz fronthaul enabler, while Australia's National Broadband Network committed AUD 1.2 billion (USD 804 million) to optical upgrades.
The Middle East is projected to grow at 10.51% through 2031 as Saudi Arabia and the United Arab Emirates localize cloud capacity. Saudi Telecom installed MEMS switches to underpin the NEOM smart-city backbone and real-time grid automation. Etisalat integrated optical fabrics into its 5G core, aiming for sub-5 ms latency for industrial IoT.
North America held roughly 30% of 2025 demand, anchored by USD 15 billion in hyperscale retrofits from Microsoft, Amazon, and Google. Europe accounted for nearly 22%, with German and French operators accelerating upgrades to meet energy-efficiency regulations. South America and Africa together contributed under 8%, but they received tailwinds from new spectrum allocations in Brazil and fiber corridor funding in Kenya. Regulatory frameworks, such as the EU's Network and Information Security Directive 2 and a proposed U.S. FCC interoperability mandate, will shape regional adoption curves by standardizing security and compatibility baselines.
- Broadcom Inc.
- Cisco Systems Inc.
- Huawei Technologies Co. Ltd.
- Fujitsu Ltd.
- Nokia Corporation
- Juniper Networks Inc.
- NTT Advanced Technology Corporation
- Furukawa Electric Co. Ltd.
- Keysight Technologies Inc.
- Agiltron Inc.
- Ciena Corporation
- Infinera Corporation
- Huber+Suhner AG
- Lumentum Holdings Inc.
- II-VI Incorporated (Coherent Corp.)
- DiCon Fiberoptics Inc.
- Sercalo Microtechnology Ltd.
- Calient Technologies Inc.
- Accelink Technologies Co. Ltd.
- HYC Co. Ltd.
Additional Benefits:
- The market estimate (ME) sheet in Excel format
- 3 months of analyst support
TABLE OF CONTENTS
1 INTRODUCTION
- 1.1 Study Assumptions and Market Definition
- 1.2 Scope of the Study
2 RESEARCH METHODOLOGY
3 EXECUTIVE SUMMARY
4 MARKET LANDSCAPE
- 4.1 Market Overview
- 4.2 Market Drivers
- 4.2.1 Surge In Hyperscale Data-Center Buildouts
- 4.2.2 Rapid 5G And Forthcoming 6G Backhaul Densification
- 4.2.3 Silicon-Photonics Cost Curve Crossing For >=400 Gbps Ports
- 4.2.4 Energy-Efficiency Mandates Favouring All-Optical Switching
- 4.2.5 Government Quantum-Network Pilot Deployments
- 4.2.6 AI-Driven Optical Network Automation And Self-Healing
- 4.3 Market Restraints
- 4.3.1 Persistent Premium Over Electronic Leaf-Spine Fabrics
- 4.3.2 Limited Field Expertise For Multi-Terabit Optical Fabrics
- 4.3.3 Supply-Chain Exposure To III-V Wafer Shortages
- 4.3.4 Cyber-Resilience Certification Lag For Mission-Critical Users
- 4.4 Industry Value Chain Analysis
- 4.5 Impact of Macroeconomic Factors on the Market
- 4.6 Regulatory Landscape
- 4.7 Technological Outlook
- 4.8 Porter's Five Forces Analysis
- 4.8.1 Threat of New Entrants
- 4.8.2 Bargaining Power of Buyers
- 4.8.3 Bargaining Power of Suppliers
- 4.8.4 Threat of Substitutes
- 4.8.5 Intensity of Competitive Rivalry
5 MARKET SIZE AND GROWTH FORECASTS (VALUE)
- 5.1 By Switching Technology
- 5.1.1 Electro-Optic Switching
- 5.1.2 Acousto-Optic Switching
- 5.1.3 MEMS-Based Switching
- 5.1.4 Magneto-Optic Switching
- 5.1.5 Thermo-Optic Switching
- 5.1.6 Other Switching Technologies
- 5.2 By Port Count
- 5.2.1 1X2
- 5.2.2 1X4
- 5.2.3 1X8
- 5.2.4 1X16 and Above
- 5.3 By Data Rate
- 5.3.1 Up to 40 Gbps
- 5.3.2 40-100 Gbps
- 5.3.3 100-400 Gbps
- 5.3.4 Above 400 Gbps
- 5.4 By End-User Industry
- 5.4.1 IT and Telecom
- 5.4.2 Government and Defense
- 5.4.3 Banking, Financial Services, and Insurance (BFSI)
- 5.4.4 Manufacturing
- 5.4.5 Healthcare and Life Sciences
- 5.4.6 Other End-User Industries
- 5.5 By Application
- 5.5.1 Circuit Switching
- 5.5.2 Testing and Monitoring
- 5.5.3 Multiplexing
- 5.5.4 Cross-Connects
- 5.5.5 Signal Monitoring
- 5.5.6 Other Applications
- 5.6 By Geography
- 5.6.1 North America
- 5.6.1.1 United States
- 5.6.1.2 Canada
- 5.6.1.3 Mexico
- 5.6.2 Europe
- 5.6.2.1 Germany
- 5.6.2.2 United Kingdom
- 5.6.2.3 France
- 5.6.2.4 Russia
- 5.6.2.5 Rest of Europe
- 5.6.3 Asia-Pacific
- 5.6.3.1 China
- 5.6.3.2 Japan
- 5.6.3.3 India
- 5.6.3.4 South Korea
- 5.6.3.5 Australia
- 5.6.3.6 Rest of Asia-Pacific
- 5.6.4 Middle East and Africa
- 5.6.4.1 Middle East
- 5.6.4.1.1 Saudi Arabia
- 5.6.4.1.2 United Arab Emirates
- 5.6.4.1.3 Rest of Middle East
- 5.6.4.2 Africa
- 5.6.4.2.1 South Africa
- 5.6.4.2.2 Egypt
- 5.6.4.2.3 Rest of Africa
- 5.6.4.1 Middle East
- 5.6.5 South America
- 5.6.5.1 Brazil
- 5.6.5.2 Argentina
- 5.6.5.3 Rest of South America
- 5.6.1 North America
6 COMPETITIVE LANDSCAPE
- 6.1 Market Concentration
- 6.2 Strategic Moves
- 6.3 Market Share Analysis
- 6.4 Company Profiles (includes Global-level Overview, Market-level Overview, Core Segments, Financials as available, Strategic Information, Market Rank/Share, Products and Services, Recent Developments)
- 6.4.1 Broadcom Inc.
- 6.4.2 Cisco Systems Inc.
- 6.4.3 Huawei Technologies Co. Ltd.
- 6.4.4 Fujitsu Ltd.
- 6.4.5 Nokia Corporation
- 6.4.6 Juniper Networks Inc.
- 6.4.7 NTT Advanced Technology Corporation
- 6.4.8 Furukawa Electric Co. Ltd.
- 6.4.9 Keysight Technologies Inc.
- 6.4.10 Agiltron Inc.
- 6.4.11 Ciena Corporation
- 6.4.12 Infinera Corporation
- 6.4.13 Huber+Suhner AG
- 6.4.14 Lumentum Holdings Inc.
- 6.4.15 II-VI Incorporated (Coherent Corp.)
- 6.4.16 DiCon Fiberoptics Inc.
- 6.4.17 Sercalo Microtechnology Ltd.
- 6.4.18 Calient Technologies Inc.
- 6.4.19 Accelink Technologies Co. Ltd.
- 6.4.20 HYC Co. Ltd.
7 MARKET OPPORTUNITIES AND FUTURE OUTLOOK
- 7.1 White-Space and Unmet-Need Assessment

 2026年全球光路開關市場報告
 全球光路交換機市場:按技術、應用、開關基數、最終用戶和地區分類-市場規模、產業動態、機會分析和預測(2026-2035 年)
 全球光路交換器市場(至 2032 年):依交換技術(MEMS、LCD、矽光電)、連接埠配置(小規模埠、中埠、大埠)和應用(資料中心、通訊網路)分類
 2026-2030年全球光開關市場
 光開關市場:商業機會、成長要素、產業趨勢分析及2026-2035年預測2026年全球光開關市場報告
 光開關市場規模、佔有率、趨勢和預測:按類型、公司規模、應用、行業和地區分類,2026-2034年2026年全球光交叉連接交換器市場報告
 光交換器市場:按類型、交換粒度、製造材料、交換方式、連接埠配置、最終用戶和分銷管道分類-2026-2032年全球預測
 光纖交換市場-全球產業規模、佔有率、趨勢、機會、預測:按類型、應用、地區和競爭格局分類,2021-2031年