

 |
市場調查報告書
商品編碼
2045842
光開關市場:商業機會、成長要素、產業趨勢分析及2026-2035年預測Optical Switches Market Opportunity, Growth Drivers, Industry Trend Analysis, and Forecast 2026 - 2035 |
||||||
2025年全球光開關市場價值為76億美元,預計到2035年將以12.6%的複合年成長率成長至245億美元。
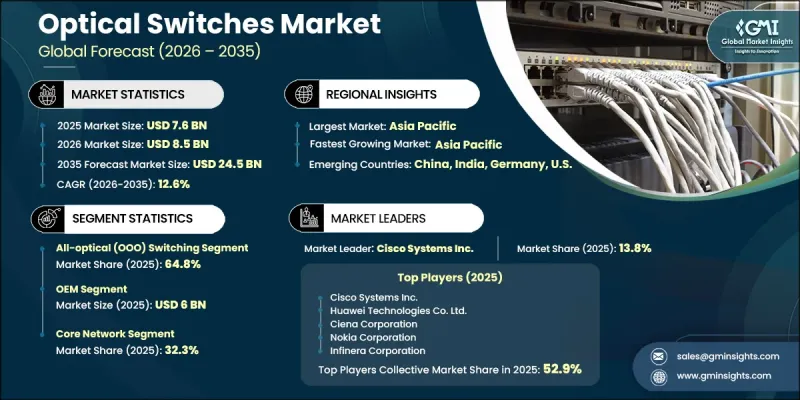
由於超大規模資料中心內部資料流量的不斷成長、高容量光纖基礎設施部署的擴展以及向軟體定義和靈活網路架構的轉變,市場正經歷顯著成長。對更快資料傳輸、更低延遲和更高網路可擴展性的需求不斷成長,正推動通訊業者和資料中心供應商採用先進的光交換技術。人工智慧主導的運算、雲端服務和大規模數位工作負載的快速成長顯著增加了網路環境中的資料傳輸量,加速了對高效能頻寬管理解決方案的需求。此外,節能網路系統在業界的重要性日益凸顯,推動了從傳統電子交換技術轉向光交換技術的轉變。光交換機因其能夠在支援高速通訊的同時降低功耗並提高網路效能而備受關注。對下一代電信基礎設施和先進資料中心網路系統的持續投資,也進一步促進了全球光交換機市場的持續成長。
| 市場範圍 | |
|---|---|
| 開始年份 | 2025 |
| 預測期 | 2026-2035 |
| 上市時的市場規模 | 76億美元 |
| 預計金額 | 245億美元 |
| 複合年成長率 | 12.6% |
隨著雲端運算、人工智慧和高階處理應用在超大規模資料中心產生的內部流量持續顯著成長,光交換產業的需求也隨之增加。隨著東西向資料傳輸需求的不斷成長,通訊業者正在積極採用能夠支援高頻寬容量、同時保持低延遲和可擴展網路效能的光交換系統。都會區網路和資料中心網路向高速光連接模組技術的快速轉型也推動了市場發展。隨著通訊基礎設施不斷發展以適應更高的線路速度和不斷成長的流量,網路供應商正在對其光系統進行現代化改造,以提高營運效率並滿足未來的連接需求。
全光交換技術無需光電轉換即可實現超高速資料傳輸,預計2025年將佔據64.8%的市場佔有率。這項技術正被擴大應用於超大規模資料中心和長距離通訊網路,因為它既能滿足頻寬,又能最大限度地降低延遲和電力消耗。其高效性和擴充性也持續推動著它在高容量光纖通訊基礎設施中的應用。
預計到2025年,核心網業務將佔全球市場佔有率的32.3%。骨幹網路和長途網路基礎設施中高容量光交換技術的積極應用,持續推動該領域的成長。核心網路系統需要超低延遲通訊、穩定的頻寬效能和高效的流量處理能力,因此,先進的光交換機對於支援大規模的國內和國際資料傳輸網路至關重要。
到2025年,北美光交換市佔率將達到37.4%。該地區的市場擴張主要得益於超大規模資料中心、雲端運算基礎設施和人工智慧驅動的網路系統的快速發展,尤其是在美國和加拿大。領先的科技公司不斷擴展其互聯資料中心環境,從而推動了對能夠管理設施間高頻寬、低延遲流量的光交換技術的需求成長。政府和私人機構對寬頻發展、光纖基礎設施和先進網路技術的持續投資,也進一步促進了北美市場的成長。
目錄
第1章:調查方法和範圍
第2章執行摘要
第3章 行業洞察
- 產業生態系分析
- 供應商情況
- 利潤率
- 成本結構
- 每個階段增加的價值
- 影響價值鏈的因素
- 中斷
- 影響產業的因素
- 促進因素
- 超大規模資料中心的流量交換需求
- 向高速光連接模組(100G/400G/800G)的遷移
- 5G和富光纖通訊網路中光層的重構
- 採用軟體定義和解耦式光纖網路
- 向節能低延遲的網路架構過渡
- 產業潛在風險與挑戰
- 光開關的高昂資本投資成本和複雜的整合
- 多廠商網路中的互通性和標準化面臨的挑戰
- 市場機遇
- 在人工智慧叢集和高效能運算互連中採用光交換技術。
- 擴展光交換在抗災和關鍵任務網路的應用
- 促進因素
- 成長潛力分析
- 監理情勢
- 北美洲
- 歐洲
- 亞太地區
- 拉丁美洲
- 中東和非洲
- 波特的分析
- PESTLE分析
- 技術與創新展望
- 最新科技趨勢
- 新興技術
- 價格趨勢
- 按地區
- 依產品
- 定價策略
- 新興經營模式
- 合規要求
- 專利和智慧財產權分析
第4章 競爭情勢
- 介紹
- 企業市佔率分析
- 按地區
- 北美洲
- 歐洲
- 亞太地區
- 拉丁美洲
- 中東和非洲
- 市場集中度分析
- 按地區
- 主要公司的競爭標竿分析
- 財務績效比較
- 收入
- 利潤率
- R&D
- 產品系列比較
- 產品線寬度
- 科技
- 創新
- 區域擴張比較
- 全球擴張分析
- 服務網路覆蓋
- 按地區分類的市場滲透率
- 競爭定位矩陣
- 領導者
- 挑戰者
- 追蹤者
- 小眾玩家
- 戰略展望矩陣
- 財務績效比較
- 主要進展
- 併購
- 夥伴關係和聯盟
- 技術進步
- 擴張和投資策略
- 數位轉型計劃
- 新興企業競爭公司和新創企業的發展趨勢
第5章 市場估價與預測:依開關類型分類,2022-2035年
- MEMS開關
- 2D MEMS
- 3D MEMS
- 光電開關
- 鈮酸鋰(LiNbO3)基
- 基於半導體(InP、GaAs)
- 熱光開關
- LCD開關
- 聲光開關
- 磁光開關
- 基於矽光電的開關
- 其他
第6章 市場估算與預測:依轉型機制分類,2022-2035年
- OOO(舊燈)開關
- 光電(OEO)開關
第7章 市場估計與預測:依網路層分類,2022-2035年
- 核心網路
- 長途骨幹網
- 區域間核心
- 捷運/聚合網路
- 接取網路
- 資料中心網路
- 其他
第8章 市場估計與預測:依公司規模分類,2022-2035年
- 大公司
- 中小企業
第9章 市場估計與預測:依最終用途產業分類,2022-2035年
- 電訊
- 通訊業者和服務供應商
- 網際服務供應商(ISP)
- 資料中心和雲端服務供應商
- 超大規模資料中心
- 託管和企業資料中心
- 資訊科技與網路
- BFSI
- 國防/航太
- 醫療保健和醫療系統
- 工業和製造業
- 零售
- 其他
第10章 市場估價與預測:依銷售管道分類,2022-2035年
- OEM
- 售後市場
第11章 市場估價與預測:按地區分類,2022-2035年
- 北美洲
- 美國
- 加拿大
- 歐洲
- 德國
- 英國
- 法國
- 西班牙
- 義大利
- 俄羅斯
- 亞太地區
- 中國
- 印度
- 日本
- 澳洲
- 韓國
- 拉丁美洲
- 巴西
- 墨西哥
- 阿根廷
- 中東和非洲
- 南非
- 沙烏地阿拉伯
- UAE
第12章:公司簡介
- 全球主要公司
- Cisco Systems Inc.
- Huawei Technologies Co. Ltd.
- Ciena Corporation
- Nokia Corporation
- Infinera Corporation
- 該地區的主要公司
- 北美洲
- Lumentum Holdings Inc.
- Molex LLC(Koch Industries)
- Thorlabs Inc.
- DiCon Fiberoptics Inc.
- Agiltron Inc.
- 亞太地區
- NTT Advanced Technology Corporation
- Fujitsu Optical Components
- ZTE Corporation
- GLSUN Technologies
- 歐洲
- II-VI Incorporated(Coherent)
- ADVA Optical Networking(Adtran)
- HUBER+SUHNER Polatis
- Sercalo Microtechnology Ltd.
- 北美洲
The Global Optical Switches Market was valued at USD 7.6 billion in 2025 and is estimated to grow at a CAGR of 12.6% to reach USD 24.5 billion by 2035.
The market is experiencing substantial growth due to the increasing volume of internal data traffic across hyperscale facilities, rising deployment of high-capacity fiber optic infrastructure, and the ongoing transition toward software-defined and flexible networking architectures. Growing demand for faster data transmission, reduced latency, and improved network scalability is encouraging telecom operators and data center providers to adopt advanced optical switching technologies. The rapid rise in AI-driven computing, cloud-based services, and large-scale digital workloads is significantly increasing data movement within network environments, accelerating the need for efficient bandwidth management solutions. In addition, the industry is increasingly prioritizing energy-efficient networking systems, which is driving the shift from conventional electronic switching technologies toward optical alternatives. Optical switches are gaining strong traction due to their ability to support high-speed communication while reducing power consumption and improving network performance. Expanding investments in next-generation telecom infrastructure and advanced data center networking systems are further contributing to the continued growth of the global optical switches market.
| Market Scope | |
|---|---|
| Start Year | 2025 |
| Forecast Year | 2026-2035 |
| Start Value | $7.6 Billion |
| Forecast Value | $24.5 Billion |
| CAGR | 12.6% |
The optical switches industry is witnessing rising demand as hyperscale data centers continue to experience significant growth in internal traffic generated by cloud computing, artificial intelligence, and advanced processing applications. Increasing east-west data transfer requirements are encouraging operators to deploy optical switching systems capable of supporting high bandwidth capacity while maintaining low latency and scalable network performance. The market is also benefiting from the rapid migration toward high-speed optical interconnect technologies across metro and data center networks. As communication infrastructure evolves to accommodate higher line rates and increasing traffic volumes, network providers are modernizing optical systems to improve operational efficiency and support future connectivity requirements.
The all-optical switching segment accounted for 64.8% share in 2025, driven by its capability to enable ultra-fast data transmission without requiring optical-electrical-optical conversion processes. This technology is increasingly utilized in hyperscale data centers and long-distance communication networks due to its ability to support growing bandwidth demands while minimizing latency and power usage. Its efficiency and scalability continue to strengthen adoption across high-capacity optical communication infrastructure.
The core network segment held a 32.3% share in 2025. Strong deployment of high-capacity optical switching technologies across backbone and long-haul network infrastructure continues to drive segment growth. Core network systems require ultra-low latency communication, stable bandwidth performance, and efficient traffic handling capabilities, making advanced optical switches essential for supporting large-scale national and international data transmission networks.
North America Optical Switches Market accounted for 37.4% share in 2025. Market expansion across the region is being supported by rapid growth in hyperscale data centers, cloud computing infrastructure, and AI-driven networking systems, particularly across the United States and Canada. Major technology companies are continuously expanding interconnected data center environments, increasing the need for optical switching technologies capable of managing high-bandwidth, low-latency traffic between facilities. Rising investments from both government and private organizations in broadband development, fiber optic infrastructure, and advanced networking technologies are further strengthening market growth throughout North America.
Leading companies operating in the Global Optical Switches Market include Lumentum Holdings Inc., II-VI Incorporated (Coherent), Molex LLC (Koch Industries), Cisco Systems Inc., Ciena Corporation, Infinera Corporation, Nokia Corporation, NTT Advanced Technology Corporation, ADVA Optical Networking (Adtran), Fujitsu Optical Components, Huawei Technologies Co. Ltd., ZTE Corporation, HUBER+SUHNER Polatis, Thorlabs Inc., Sercalo Microtechnology Ltd., GLSUN Technologies, DiCon Fiberoptics Inc., and Agiltron Inc. Companies operating in the optical switches market are focusing on multiple strategic initiatives to strengthen their market position and expand technological capabilities. Leading players are investing heavily in research and development to improve switching speed, bandwidth capacity, and energy efficiency across optical networking solutions. Strategic collaborations with telecom operators, cloud service providers, and hyperscale data center companies are helping businesses accelerate product deployment and strengthen long-term customer relationships. Companies are also expanding manufacturing capabilities and enhancing supply chain operations to support rising global demand for advanced optical communication infrastructure.
Table of Contents
Chapter 1 Methodology and Scope
- 1.1 Market scope and definition
- 1.2 Research design
- 1.2.1 Research approach
- 1.2.2 Data collection methods
- 1.3 Data mining sources
- 1.3.1 Global
- 1.3.2 Regional/Country
- 1.4 Base estimates and calculations
- 1.4.1 Base year calculation
- 1.4.2 Key trends for market estimation
- 1.5 Primary research and validation
- 1.5.1 Primary sources
- 1.6 Forecast model
- 1.7 Research assumptions and limitations
Chapter 2 Executive Summary
- 2.1 Industry 360° synopsis, 2022 - 2035
- 2.2 Key market trends
- 2.2.1 Switches type trends
- 2.2.2 Switching mechanism trends
- 2.2.3 Network layer trends
- 2.2.4 Enterprise size trends
- 2.2.5 End-Use industry trends
- 2.2.6 Sales channel trends
- 2.2.7 Regional trends
- 2.3 TAM Analysis, 2026-2035
- 2.4 CXO perspectives: Strategic imperatives
Chapter 3 Industry Insights
- 3.1 Industry ecosystem analysis
- 3.1.1 Supplier Landscape
- 3.1.2 Profit Margin
- 3.1.3 Cost structure
- 3.1.4 Value addition at each stage
- 3.1.5 Factor affecting the value chain
- 3.1.6 Disruptions
- 3.2 Industry impact forces
- 3.2.1 Growth drivers
- 3.2.1.1 Hyperscale data center traffic switching requirements
- 3.2.1.2 Migration to high-speed optical interconnects (100G/400G/800G)
- 3.2.1.3 Optical layer reconfiguration in 5G and fiber-rich telecom networks
- 3.2.1.4 Adoption of software-defined and disaggregated optical networks
- 3.2.1.5 Shift toward power-efficient and low-latency network architectures
- 3.2.2 Industry pitfalls and challenges
- 3.2.2.1 High capital cost and complex integration of optical switches
- 3.2.2.2 Interoperability and standardization challenges across multi-vendor networks
- 3.2.3 Market opportunities
- 3.2.3.1 Adoption of optical Switching in AI cluster and high-performance computing interconnects
- 3.2.3.2 Expansion of optical switching in disaster-resilient and mission-critical networks
- 3.2.1 Growth drivers
- 3.3 Growth potential analysis
- 3.4 Regulatory landscape
- 3.4.1 North America
- 3.4.2 Europe
- 3.4.3 Asia Pacific
- 3.4.4 Latin America
- 3.4.5 Middle East & Africa
- 3.5 Porter's analysis
- 3.6 PESTEL analysis
- 3.7 Technology and Innovation landscape
- 3.7.1 Current technological trends
- 3.7.2 Emerging technologies
- 3.8 Price trends
- 3.8.1 By region
- 3.8.2 By product
- 3.9 Pricing Strategies
- 3.10 Emerging Business Models
- 3.11 Compliance Requirements
- 3.12 Patent and IP analysis
Chapter 4 Competitive Landscape, 2025
- 4.1 Introduction
- 4.2 Company market share analysis
- 4.2.1 By region
- 4.2.1.1 North America
- 4.2.1.2 Europe
- 4.2.1.3 Asia Pacific
- 4.2.1.4 Latin America
- 4.2.1.5 Middle East & Africa
- 4.2.2 Market concentration analysis
- 4.2.1 By region
- 4.3 Competitive benchmarking of key players
- 4.3.1 Financial performance comparison
- 4.3.1.1 Revenue
- 4.3.1.2 Profit margin
- 4.3.1.3 R&D
- 4.3.2 Product portfolio comparison
- 4.3.2.1 Product range breadth
- 4.3.2.2 Technology
- 4.3.2.3 Innovation
- 4.3.3 Geographic presence comparison
- 4.3.3.1 Global footprint analysis
- 4.3.3.2 Service network coverage
- 4.3.3.3 Market penetration by region
- 4.3.4 Competitive positioning matrix
- 4.3.4.1 Leaders
- 4.3.4.2 Challengers
- 4.3.4.3 Followers
- 4.3.4.4 Niche players
- 4.3.5 Strategic outlook matrix
- 4.3.1 Financial performance comparison
- 4.4 Key developments
- 4.4.1 Mergers and acquisitions
- 4.4.2 Partnerships and collaborations
- 4.4.3 Technological advancements
- 4.4.4 Expansion and investment strategies
- 4.4.5 Digital transformation initiatives
- 4.5 Emerging/ startup competitors landscape
Chapter 5 Market Estimates and Forecast, By Switches Type, 2022 - 2035 (USD Million)
- 5.1 Key trends
- 5.2 MEMS-based switches
- 5.2.1 2D MEMS
- 5.2.2 3D MEMS
- 5.3 Electro-optic switches
- 5.3.1 Lithium niobate (LiNbO3) based
- 5.3.2 Semiconductor-based (InP, GaAs)
- 5.4 Thermo-optic switches
- 5.5 Liquid crystal switches
- 5.6 Acousto-optic switches
- 5.7 Magneto-optic switches
- 5.8 Silicon photonics-based switches
- 5.9 Others
Chapter 6 Market Estimates and Forecast, By Switching Mechanism, 2022 - 2035 (USD Million)
- 6.1 Key trends
- 6.2 All-optical (OOO) switching
- 6.3 Opto-electronic (OEO) switching
Chapter 7 Market Estimates and Forecast, By Network Layer, 2022 - 2035 (USD Million)
- 7.1 Key trends
- 7.2 Core network
- 7.2.1 Long-haul backbone
- 7.2.2 Inter-regional core
- 7.3 Metro/aggregation network
- 7.4 Access network
- 7.5 Data center networks
- 7.6 others
Chapter 8 Market Estimates and Forecast, By Enterprise Size, 2022 - 2035 (USD Million)
- 8.1 Key trends
- 8.2 Large enterprises
- 8.3 Small & medium enterprises (SMEs)
Chapter 9 Market Estimates and Forecast, By End-Use Industry, 2022 - 2035 (USD Million)
- 9.1 Key trends
- 9.2 Telecommunications
- 9.2.1 Carriers & service providers
- 9.2.2 Internet service providers (ISPs)
- 9.3 Data centers & cloud providers
- 9.3.1 Hyperscale data centers
- 9.3.2 Colocation & enterprise data centers
- 9.4 IT & networking
- 9.5 BFSI
- 9.6 Defense & aerospace
- 9.7 Healthcare & medical systems
- 9.8 Industrial & manufacturing
- 9.9 Retail
- 9.10 Others
Chapter 10 Market Estimates and Forecast, By Sales Channel, 2022 - 2035 (USD Million)
- 10.1 Key trends
- 10.2 OEM
- 10.3 Aftermarket
Chapter 11 Market Estimates and Forecast, By Region, 2022 - 2035 (USD Million)
- 11.1 Key trends
- 11.2 North America
- 11.2.1 U.S.
- 11.2.2 Canada
- 11.3 Europe
- 11.3.1 Germany
- 11.3.2 UK
- 11.3.3 France
- 11.3.4 Spain
- 11.3.5 Italy
- 11.3.6 Russia
- 11.4 Asia Pacific
- 11.4.1 China
- 11.4.2 India
- 11.4.3 Japan
- 11.4.4 Australia
- 11.4.5 South Korea
- 11.5 Latin America
- 11.5.1 Brazil
- 11.5.2 Mexico
- 11.5.3 Argentina
- 11.6 Middle East and Africa
- 11.6.1 South Africa
- 11.6.2 Saudi Arabia
- 11.6.3 UAE
Chapter 12 Company Profiles
- 12.1 Global Key Players
- 12.1.1 Cisco Systems Inc.
- 12.1.2 Huawei Technologies Co. Ltd.
- 12.1.3 Ciena Corporation
- 12.1.4 Nokia Corporation
- 12.1.5 Infinera Corporation
- 12.2 Regional key players
- 12.2.1 North America
- 12.2.1.1 Lumentum Holdings Inc.
- 12.2.1.2 Molex LLC (Koch Industries)
- 12.2.1.3 Thorlabs Inc.
- 12.2.1.4 DiCon Fiberoptics Inc.
- 12.2.1.5 Agiltron Inc.
- 12.2.2 Asia Pacific
- 12.2.2.1 NTT Advanced Technology Corporation
- 12.2.2.2 Fujitsu Optical Components
- 12.2.2.3 ZTE Corporation
- 12.2.2.4 GLSUN Technologies
- 12.2.3 Europe
- 12.2.3.1 II-VI Incorporated (Coherent)
- 12.2.3.2 ADVA Optical Networking (Adtran)
- 12.2.3.3 HUBER+SUHNER Polatis
- 12.2.3.4 Sercalo Microtechnology Ltd.
- 12.2.1 North America
 2026-2030年全球光開關市場
 2026年全球光開關市場報告
 光開關市場規模、佔有率、趨勢和預測:按類型、公司規模、應用、行業和地區分類,2026-2034年2026年全球光交叉連接交換器市場報告
 光交換器市場:按類型、交換粒度、製造材料、交換方式、連接埠配置、最終用戶和分銷管道分類-2026-2032年全球預測
 光纖交換市場-全球產業規模、佔有率、趨勢、機會、預測:按類型、應用、地區和競爭格局分類,2021-2031年
 光開關市場規模、佔有率及成長分析(按類型、技術、公司規模、應用、最終用戶和地區)-2025-2032 年產業預測
 全球光開關市場:市場佔有率分析、產業趨勢與統計、成長預測(2025-2030 年)