


 |
市場調查報告書
商品編碼
2124934
北美和歐洲自動販賣機:市場佔有率分析、行業趨勢和統計數據以及成長預測(2026-2031 年)North America And Europe Vending Machine - Market Share Analysis, Industry Trends & Statistics, Growth Forecasts (2026 - 2031) |
||||||

※ 本網頁內容可能與最新版本有所差異。詳細情況請與我們聯繫。
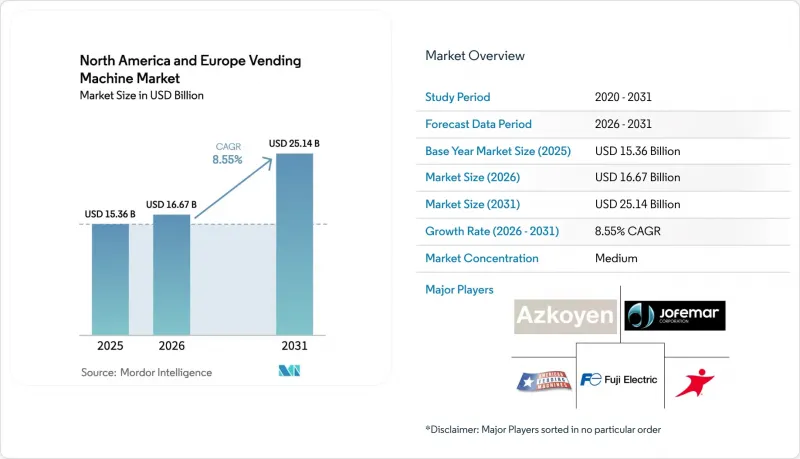
根據 Mordor Intelligence 預測,北美和歐洲的自動販賣機市場規模將從 2025 年的 153.6 億美元成長到 2026 年的 166.7 億美元,然後在 2031 年達到 251.4 億美元,2026 年至 2031 年的複合年成長率為 8.55%。
本報告按類型(飲料、食品和零食、其他)、地點(公共設施、交通、其他)、支付方式(現金、非現金支付 - 銀行卡、其他)、技術(非智慧(獨立式)、其他)、最終用戶行業(企業辦公場所、教育、醫療保健、其他)和地區進行細分。市場預測以美元計價。
北美和歐洲自動販賣機市場的趨勢和洞察
透過整合無現金小額支付來加速提升單位經濟效益
引入非接觸式讀卡機和行動錢包支付功能的自動販賣機營運商,到2024年,其無現金支付比例已提升至77%,降低了硬幣處理成本,並透過引入動態定價,使平均購買金額提高了18%。德國的案例清楚地展現了這些措施帶來的經濟效益。 SECO和BDTA已開始對20萬台香菸自動販賣機進行改造,加裝GiroCard終端,從而徹底消除了此前佔營運成本25%的現金收款環節。
非接觸式零售體驗的需求日益成長
疫情期間引入的非接觸式介面如今已成為人員密集場所的標準配置。QR碼餐和語音控制模組減少了因接觸表面而引起的申訴,並符合醫療保健和餐飲服務業的衛生規範。
網路安全和資料隱私面臨的威脅日益加劇
歐盟的《網路安全彈性法案》強制規定自動販賣機業者必須在14天內修復漏洞,否則將面臨最高相當於全球銷售額2.5%的罰款。這導致每台老舊終端的合規成本增加了800至1200美元。
細分市場分析
飲料自動販賣機持續引領北美和歐洲的自動販賣機市場,預計到2025年將佔總銷售額的45.78%。然而,食品和零食自動販賣機預計將以每年9.02%的速度成長,這反映了廚師烹調餐點更高的毛利率。芝加哥奧黑爾機場安裝的一台「農夫冰箱」預計在2024年將創造12萬美元的銷售額,是普通零食自動販賣機的三倍。因此,在FDA溫度記錄要求和歐盟推薦使用節能型丙烷系統的冷媒法規的推動下,對冷鏈的投資正在增加。
天然冷媒壓縮機雖然會使設備成本增加30-40%,但可降低20%的電力消耗,使新鮮農產品可以賣出更高的價格。自動販賣機繼續受益於供應商提供的安裝補貼和寬廣的溫度耐受範圍,現有業者可以透過獨家經銷權和促銷定價來維持市場佔有率。雖然個人護理產品目前仍佔銷售額的不到5%,但它們在醫院和學生宿舍的銷售勢頭強勁,因為24小時供應的衛生用品可以避免緊急採購。
預計到2025年,辦公市場將占到總安裝量的36.72%,但混合辦公模式的興起導致工作日客流量下降,對單一設備的收入帶來壓力。相較之下,機場和地鐵站預計將以每年8.31%的速度成長,這得益於市政當局為拓展票價以外的收入來源所做的努力。馬德里地鐵斥資770萬歐元安裝145台集售票、小吃和食品於一體的自助式販賣機,凸顯了這種商業性潛力。每台機器僅佔地4平方英尺,預計每年可產生3.5萬美元的收入,這筆收入將與交通管理部門平分。
學校和醫院等公共設施需求穩定,但營養和衛生法規導致產品更新週期延長。休閒場所單次活動收入高,但客流量波動較大,業者需要在自動販賣機密度和路線效率之間取得平衡。封閉式園區系統支付便捷,但營運商受獨家合約約束,產品試驗受到限制。
其他好處
- Excel格式的市場預測(ME)表
- 3個月的分析師支持
目錄
第1章:引言
- 研究假設和市場定義
- 調查範圍
第2章:調查方法
第3章執行摘要
第4章 市場狀況
- 市場概覽
- 市場促進因素
- 透過整合無現金小額支付來加速提升單位經濟效益
- 非接觸式零售體驗的需求日益成長
- 在交通樞紐增設生鮮食品自動販賣機
- 人工智慧驅動的貨架陳列圖最佳化和動態定價
- 將提供健康零食作為職場健康計劃的一部分。
- 政府對節能製冷設備提供獎勵措施
- 市場限制因素
- 網路安全和資料隱私面臨的威脅日益加劇
- 為改善網路連結維修需要高昂的資金投入。
- 歐盟針對一次性包裝制定了嚴格的減少廢棄物法規。
- 持續不斷的故意破壞和盜竊風險。
- 產業價值鏈分析
- 監理情勢
- 技術展望
- 波特五力分析
- 宏觀經濟因素對市場的影響
- 在不同國家發現的獨特自動販賣機
第5章 市場規模與成長預測
- 按類型
- 飲料
- 食物和零食
- 個人護理和衛生用品
- 其他
- 按位置
- 辦公大樓和商業大樓
- 公共設施
- 運輸
- 休閒娛樂設施
- 透過付款方式
- 現金
- 非現金卡
- 無現金行動錢包/2D碼
- 閉合迴路系統(校園/預付)
- 透過技術
- 智慧/互聯(相容物聯網)
- 非智慧(獨立式)
- 按最終用途行業分類
- 企業辦公空間
- 教育
- 衛生保健
- 旅遊與飯店
- 生產和分銷基地
- 按地區
- 北美洲
- 美國
- 加拿大
- 歐洲
- 英國
- 德國
- 法國
- 義大利
- 西班牙
- 俄羅斯
- 其他歐洲國家
- 北美洲
第6章 競爭情勢
- 策略趨勢
- 市佔率分析
- 公司簡介
- American Vending Machines Inc.
- Fuji Electric Co., Ltd.
- Azkoyen Vending Systems, SA
- Aramark Corporation
- Jofemar Corporation
- Compass Group PLC
- Evoca Group SpA
- Crane Merchandising Systems Inc.
- Automated Merchandising Systems Inc.
- Sanden Holdings Corporation
- Selecta Group BV
- Bulk Vending Systems Ltd.
- Continental Vending Inc.
- FAS International SpA
- N&W Global Vending SpA
- Westomatic Vending Services Ltd.
- Azkoyen Group SA
- Bianchi Vending Group SpA
- Vengo Labs Inc.
- Bianchi Industry SpA
- FAS International SpA
第7章 市場機會與未來展望
According to Mordor Intelligence, the North America and Europe vending machine market size is expected to grow from USD 15.36 billion in 2025 to USD 16.67 billion in 2026 and is forecast to reach USD 25.14 billion by 2031 at 8.55% CAGR over 2026-2031.
This report is Segmented by Type (Beverage, Food and Snacks, and More), Location (Institutional Settings, Transportation Facilities, and More), Payment Mode (Cash, Cashless - Card, and More), Technology (Non-Smart Standalone, and More), End-Use Industry (Corporate Workspaces, Education, Healthcare, and More), and Geography. The Market Forecasts are Provided in Terms of Value (USD).
North America And Europe Vending Machine Market Trends and Insights
Cashless Micro-Payments Integration Accelerating Unit Economics
Vending operators that fitted contactless readers and mobile-wallet acceptance achieved a 77% cashless share in 2024, reducing coin-handling costs and enabling dynamic pricing that lifted average ticket values by up to 18%. Germany illustrates the economics: SECO and BDTA began retrofitting 200,000 tobacco units with girocard terminals, eliminating cash-collection routes that previously absorbed 25% of operating costs.
Rising Demand for Contact-Free Retail Experiences
Touchless interfaces introduced during the pandemic are now standard in busy venues. QR-code ordering and voice-activated modules reduce surface-contact complaints and align with hygiene protocols in healthcare and food-service settings.
Escalating Cyber-Security and Data-Privacy Threats
The EU Cyber Resilience Act obliges vending operators to patch vulnerabilities within 14 days or face fines up to 2.5% of global revenue, raising compliance outlays by USD 800-1,200 per legacy unit.
Other drivers and restraints analyzed in the detailed report include:
- Expansion of Fresh-Food Vending in Transport Hubs
- AI-Powered Planogram Optimisation and Dynamic Pricing
- High Capital Cost of Retrofit for Connectivity
For complete list of drivers and restraints, kindly check the Table Of Contents.
Segment Analysis
Sales of beverage machines still anchor the North America and Europe vending machine market, holding 45.78% revenue share in 2025. However, food and snack machines are forecast to grow 9.02% annually, reflecting the superior gross margins of chef-prepared meals. A single Farmer's Fridge unit at Chicago O'Hare generated USD 120,000 in 2024 triple the take of a standard snack vendor. Cold-chain investments are therefore rising, spurred by FDA temperature-logging mandates and EU refrigerant rules that favor energy-efficient propane systems.
Natural-refrigerant compressors add 30-40% to equipment cost yet reduce electricity use by 20%, enabling price premiums on perishable SKUs. Beverage vending continues to benefit from supplier-funded placements and tolerant temperature bands, enabling incumbents to defend share through exclusive pour rights and promotional pricing. Personal-care merchandising remains below 5% but is gaining traction in hospitals and dormitories, where round-the-clock access to hygiene items offsets emergency-supply trips.
Offices delivered 36.72% of 2025 installations, but hybrid work diminished weekday footfall and pressured per-machine turnover. In contrast, airports and metro stations are projected to grow at an annual rate of 8.31%, aided by municipal efforts to diversify non-fare revenue. Metro de Madrid's EUR 7.7 million contract for 145 combo ticket-and-snack units underscores the commercial potential, each machine occupies only 4 sq ft and is expected to earn USD 35,000 yearly, split evenly with the transit authority.
Institutional venues such as schools and hospitals provide stable demand but impose nutritional or hygiene restrictions that lengthen assortment cycles. Leisure settings exhibit high per-event revenue yet volatile throughput, compelling operators to balance machine density with route efficiency. Closed-campus systems simplify settlement but tie operators into exclusive contracts, limiting SKU experimentation.
Complete Report Scope:
- By Type
- Beverage
- Food and Snacks
- Personal-Care and Hygiene
- Other Type
- By Location
- Office and Commercial Buildings
- Institutional Settings
- Transportation Facilities
- Leisure and Entertainment Venues
- By Payment Mode
- Cash
- Cashless - Card
- Cashless - Mobile Wallet / QR
- Closed-Loop Systems (Campus/Stored-Value)
- By Technology
- Smart/Connected (IoT-Enabled)
- Non-Smart (Standalone)
- By End-Use Industry
- Corporate Workspaces
- Education
- Healthcare
- Travel and Hospitality
- Manufacturing and Distribution Centres
- By Geography
- North America
- United States
- Canada
- Europe
- United Kingdom
- Germany
- France
- Italy
- Spain
- Russia
- Rest of Europe
- North America
List of Companies Covered in this Report:
- American Vending Machines Inc.
- Fuji Electric Co., Ltd.
- Azkoyen Vending Systems, S.A.
- Aramark Corporation
- Jofemar Corporation
- Compass Group PLC
- Evoca Group S.p.A.
- Crane Merchandising Systems Inc.
- Automated Merchandising Systems Inc.
- Sanden Holdings Corporation
- Selecta Group B.V.
- Bulk Vending Systems Ltd.
- Continental Vending Inc.
- FAS International S.p.A.
- N&W Global Vending S.p.A.
- Westomatic Vending Services Ltd.
- Azkoyen Group S.A.
- Bianchi Vending Group S.p.A.
- Vengo Labs Inc.
- Bianchi Industry S.p.A.
- FAS International S.p.A.
Additional Benefits:
- The market estimate (ME) sheet in Excel format
- 3 months of analyst support
TABLE OF CONTENTS
1 INTRODUCTION
- 1.1 Study Assumptions and Market Definition
- 1.2 Scope of the Study
2 RESEARCH METHODOLOGY
3 EXECUTIVE SUMMARY
4 MARKET LANDSCAPE
- 4.1 Market Overview
- 4.2 Market Drivers
- 4.2.1 Cash-less Micro-Payments Integration Accelerating Unit Economics
- 4.2.2 Rising Demand for Contact-Free Retail Experiences
- 4.2.3 Expansion of Fresh-Food Vending in Transport Hubs
- 4.2.4 AI-Powered Planogram Optimisation and Dynamic Pricing
- 4.2.5 Workplace Well-Being Initiatives Driving Healthy-Snack Offerings
- 4.2.6 Government Incentives for Energy-Efficient Refrigeration
- 4.3 Market Restraints
- 4.3.1 Escalating Cyber-security and Data-Privacy Threats
- 4.3.2 High Capital Cost of Retrofit for Connectivity
- 4.3.3 Stringent EU Waste-Reduction Regulations on Single-Use Packaging
- 4.3.4 Persistent Vandalism and Physical Theft Risks
- 4.4 Industry Value Chain Analysis
- 4.5 Regulatory Landscape
- 4.6 Technological Outlook
- 4.7 Porter's Five Forces Analysis
- 4.7.1 Bargaining Power of Suppliers
- 4.7.2 Bargaining Power of Buyers
- 4.7.3 Threat of New Entrants
- 4.7.4 Threat of Substitutes
- 4.7.5 Intensity of Competitive Rivalry
- 4.8 Impact of Macroeconomic Factors on the Market
- 4.9 Unique Vending Machines Across the Countries
5 MARKET SIZE AND GROWTH FORECASTS (VALUE)
- 5.1 By Type
- 5.1.1 Beverage
- 5.1.2 Food and Snacks
- 5.1.3 Personal-Care and Hygiene
- 5.1.4 Other Type
- 5.2 By Location
- 5.2.1 Office and Commercial Buildings
- 5.2.2 Institutional Settings
- 5.2.3 Transportation Facilities
- 5.2.4 Leisure and Entertainment Venues
- 5.3 By Payment Mode
- 5.3.1 Cash
- 5.3.2 Cashless - Card
- 5.3.3 Cashless - Mobile Wallet / QR
- 5.3.4 Closed-Loop Systems (Campus/Stored-Value)
- 5.4 By Technology
- 5.4.1 Smart/Connected (IoT-Enabled)
- 5.4.2 Non-Smart (Standalone)
- 5.5 By End-Use Industry
- 5.5.1 Corporate Workspaces
- 5.5.2 Education
- 5.5.3 Healthcare
- 5.5.4 Travel and Hospitality
- 5.5.5 Manufacturing and Distribution Centres
- 5.6 By Geography
- 5.6.1 North America
- 5.6.1.1 United States
- 5.6.1.2 Canada
- 5.6.2 Europe
- 5.6.2.1 United Kingdom
- 5.6.2.2 Germany
- 5.6.2.3 France
- 5.6.2.4 Italy
- 5.6.2.5 Spain
- 5.6.2.6 Russia
- 5.6.2.7 Rest of Europe
- 5.6.1 North America
6 COMPETITIVE LANDSCAPE
- 6.1 Strategic Moves
- 6.2 Market Share Analysis
- 6.3 Company Profiles (includes Global Level Overview, Market Level Overview, Core Segments, Financials as available, Strategic Information, Market Rank/Share for key companies, Products and Services, and Recent Developments)
- 6.3.1 American Vending Machines Inc.
- 6.3.2 Fuji Electric Co., Ltd.
- 6.3.3 Azkoyen Vending Systems, S.A.
- 6.3.4 Aramark Corporation
- 6.3.5 Jofemar Corporation
- 6.3.6 Compass Group PLC
- 6.3.7 Evoca Group S.p.A.
- 6.3.8 Crane Merchandising Systems Inc.
- 6.3.9 Automated Merchandising Systems Inc.
- 6.3.10 Sanden Holdings Corporation
- 6.3.11 Selecta Group B.V.
- 6.3.12 Bulk Vending Systems Ltd.
- 6.3.13 Continental Vending Inc.
- 6.3.14 FAS International S.p.A.
- 6.3.15 N&W Global Vending S.p.A.
- 6.3.16 Westomatic Vending Services Ltd.
- 6.3.17 Azkoyen Group S.A.
- 6.3.18 Bianchi Vending Group S.p.A.
- 6.3.19 Vengo Labs Inc.
- 6.3.20 Bianchi Industry S.p.A.
- 6.3.21 FAS International S.p.A.
7 MARKET OPPORTUNITIES AND FUTURE OUTLOOK
- 7.1 White-Space and Unmet-Need Assessment

 智慧自動販賣機食品解決方案市場預測至2034年-全球分析(按產品類型、技術整合、安裝位置、經營模式、食品類別創新、消費者細分和區域分類)
 連網自動販賣機:市場佔有率分析、產業趨勢與統計及成長預測(2026-2031 年)自動販賣機:市場佔有率分析、產業趨勢與統計、成長預測(2026-2031)醫療自動販賣機:市場佔有率分析、產業趨勢與統計、成長預測(2026-2031)
 零售自動販賣機市場-2026-2032年全球市場預測
 全球冷藏自動販賣機市場規模、佔有率、趨勢和成長分析報告(2026-2034)
 2026-2030年全球自動販賣機市場
 2026年全球生牛奶起司旅遊市場報告
 零售自動販賣機市場規模、佔有率和成長分析:按型號、產品類型、安裝類型、所有權模式、最終用戶和地區分類-2026-2033年產業預測
 酒精自動販賣機市場-全球產業規模、佔有率、趨勢、機會和預測(按技術類型、最終用戶、地區和競爭格局分類,2021-2031年)