


 |
市場調查報告書
商品編碼
2119740
連網自動販賣機:市場佔有率分析、產業趨勢與統計及成長預測(2026-2031 年)Connected Vending Machine - Market Share Analysis, Industry Trends & Statistics, Growth Forecasts (2026 - 2031) |
||||||

※ 本網頁內容可能與最新版本有所差異。詳細情況請與我們聯繫。
根據 Mordor Intelligence 預測,連網自動販賣機的市場規模預計將從 2025 年的 808 萬台成長到 2026 年的 904 萬台,並將從 2026 年到 2031 年以 11.86% 的複合年成長率成長,到 2031 年達到 1582 萬台。
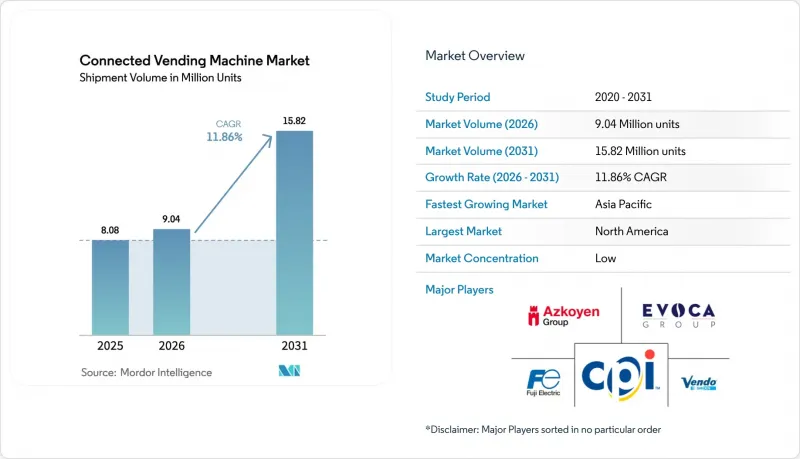
本報告按機器類型(壁掛式、桌上型、獨立式櫃體)、產品類型(飲料、點心等)、安裝地點/應用(機場、火車站/地鐵站等)、連接方式/技術(支援遙測、完全物聯網連接等)、支付技術(現金/硬幣、讀卡機等)和地區進行細分。市場預測是基於出貨量。
全球連網自動販賣機市場趨勢及洞察
無現金支付和行動支付的廣泛普及
全球支付數位化正推動智慧自動販賣機市場轉型為無卡交易。在位置地段,無卡交易已佔銷售額的50%。支援NFC功能的智慧型手機、非接觸感應卡和行動錢包的結合,消除了支付摩擦,提高了單筆交易的平均金額,並支援基於即時POS數據的會員忠誠度計畫。 Cantaloupe的「Engage Pulse」讀卡機透過階梯式定價(一次遊戲收取多次遊戲費用)使抓娃娃機的收入提高了85%。營運商可以利用更詳細的客戶分析數據最佳化產品展示方案,而生物識別錢包預示著新一輪無摩擦支付的到來,DyDo與NEC在日本聯合開展的部署臉部認證支付終端的試點項目便印證了這一點。
非接觸式和衛生零售的需求
疫情後,隨著風險意識的增強,企業正積極採用非接觸式支付終端,以增強顧客信心並符合內部衛生規範。配備動作感測器、語音提示和QR碼應用程式的終端機正在取代實體小鍵盤,紫外線或藍光消毒循環則可在每次購買後對接觸面進行消毒。例如,夏洛特道格拉斯國際機場的HMSHost自助結帳系統亭就採用了這種技術。遠端控制面板使操作員能夠監控清潔記錄,並向設施管理人員證明其合規性。因此,醫療機構、企業和教育機構都在優先採用智慧設備,這些設備不僅能夠提供種類繁多的產品,還能最大限度地減少人們對共用表面的擔憂。
高昂的初始資本投資(Capex)和安裝成本
先進自動販賣機的價格差異巨大,從入門級人工智慧機型的 4,299 美元到多溫區自助售貨亭的 15,000 美元以上不等,這對於小規模線路營運商來說可能是一筆融資的開支。此外,還會產生電力升級、通訊線路合約費和付款閘道費等額外成本。由於營運商會選擇性地升級設備,因此仍然存在混合型車隊,這阻礙了他們充分利用全面數位化帶來的網路優勢,並減緩了連網自動販賣機在成本敏感地區的市場滲透率。
細分市場分析
預計到2025年,獨立式機櫃將佔安裝量的59.55%,憑藉其豐富的SKU容量,尤其適用於交通樞紐和校園,將構成連網自動販賣機市場的基礎。壁掛式機櫃目前正以13.55%的複合成長率成長,主要得益於業主希望在走廊和休息室等空間內提供更多服務。儘管獨立式連網自動販賣機的市場規模依然龐大,但小型安裝式機櫃也吸引了那些希望在不佔用占地面積的情況下增加收入的營運商。
技術的微型化使得壁掛式設備在支付方式、遠端遙測和多溫區儲存等方面能夠達到與大型機型相媲美的性能。觸控螢幕、LED 照明和基於雲端的 SKU 追蹤均為標配功能,輕巧的機身也降低了安裝成本。這些優勢促使此類設備在醫院、學校和小規模共享辦公空間等空間受限的場所得到更廣泛的應用,尤其是在安全法規限制地面空間的情況下。
隨著冷鏈物流的完善,預計到2025年,飲料將佔銷售額的37.65%,但生鮮食品和冷凍食品的年成長率為13.74%,因為消費者越來越傾向於選擇更健康的外帶外賣。聯網自動販賣機市場正變得越來越有吸引力,成為公司員工餐廳的替代方案,因為企業利用基於物聯網的溫度追蹤技術來滿足HACCP標準,並利用人工智慧驅動的降價降低來減少食物浪費。
東京一家動態沙拉自助售貨亭透過根據一天中的不同時段靈活調整價格來減少浪費,從而驗證了這種模式的可行性。新型包裝可使食物保鮮48小時,預測性補貨路線則可依消費高峰調整供應量。這些創新正在提升消費者對自動生鮮食品販賣機的信心。
區域分析
到2025年,北美將佔全球銷售額的37.25%。這反映了北美完善的支付基礎設施、企業對物聯網的早期應用,以及有利於在企業園區和運輸領域部署物聯網資料隱私保護的法規。隨著大都會圈無現金支付普及率超過80%,企業正將人工智慧驅動的升級視為提高單一設備銷售額的下一步。
亞太地區以14.22%的複合年成長率成長,這主要得益於中國龐大的製造業規模和行動錢包的普及。國內製造商如AFEN年產量達12萬台,出口到100多個國家;泰國的陶斌終端每天透過QR碼和臉部認證支付界面售出20萬瓶飲料。隨著雅加達至胡志明市的城市軌道運輸路線延伸,現代化的自助服務終端已成為通勤者出行的重要便利設施。
在歐洲,在政策主導的推動下,逆向自動販賣機產業穩步發展,並獲得了對一次性塑膠製品法規和容器押金制度的更多支持,這些法規和製度鼓勵聯網的逆向自動售貨終端的部署。 TOMRA在斯堪地那維亞的納維亞半島高達98%的瓶子回收率清晰地證明了該模式的成功。同時,歐盟的《一般資料保護規則》(GDPR)迫使供應商轉向邊緣運算,以便在終端上保留個人資料。在中東、非洲和南美洲新興地區,逆向自動販賣機的普及仍處於起步階段。隨著電信業者部署4G/5G網路,自動販賣機公司正與公共衛生機構合作,以提高品牌知名度,例如洛杉磯縣的免費納洛酮(Naloxon)自助服務亭。
其他好處:
- Excel格式的市場預測(ME)表
- 3個月的分析師支持
目錄
第1章:引言
- 研究假設和市場定義
- 調查範圍
第2章:調查方法
第3章執行摘要
第4章 市場狀況
- 市場概覽
- 市場促進因素
- 無現金支付和行動支付正變得越來越普及。
- 非接觸式和衛生零售服務的需求
- 零售業自動化以抵銷人事費用
- 交通樞紐(機場和鐵路)的快速擴張
- 與押金退款型自動收款機整合
- 程序化戶外數位廣告的收入來源
- 市場限制因素
- 前期資本投入和安裝成本較高。
- 防範人為破壞和無人資產
- 連接碎片化/協定標準
- 限制SKU的學校午餐法規
- 產業價值鏈分析
- 監理情勢
- 技術展望
- 產業吸引力—五力分析
- 買方的議價能力
- 供應商的議價能力
- 新進入者的威脅
- 替代品的威脅
- 競爭公司之間的競爭
- 關鍵指標
- 使用者滲透率
- 每位用戶平均收入(ARPU)
- 宏觀經濟因素對市場的影響
第5章 市場規模及成長預測(出貨量)
- 按機器類型
- 壁掛式
- 桌面型
- 獨立式櫃體
- 依產品類型
- 飲料
- 小吃
- 新鮮和冷凍食品
- 糖果糕餅
- 其他
- 透過使用
- 飛機場
- 火車站和地鐵站
- 企業辦公室與共享辦公空間
- 教育機構
- 醫療機構
- 零售和購物中心
- 連接/技術
- 遙測功能已啟用(半連接)
- 全面物聯網連接(雲端內容管理系統)
- 人工智慧驅動的智慧機器
- 反向自動販賣機/押金退款
- 透過支付技術
- 紙幣和硬幣
- 讀卡機(EMV)
- 行動錢包/NFC
- 生物識別/臉部認證支付
- 按地區
- 北美洲
- 美國
- 加拿大
- 墨西哥
- 南美洲
- 巴西
- 阿根廷
- 智利
- 其他南美國家
- 歐洲
- 德國
- 英國
- 法國
- 義大利
- 西班牙
- 俄羅斯
- 其他歐洲國家
- 亞太地區
- 中國
- 印度
- 日本
- 韓國
- 新加坡
- 馬來西亞
- 澳洲
- 其他亞太國家
- 中東和非洲
- 中東
- 阿拉伯聯合大公國
- 沙烏地阿拉伯
- 土耳其
- 其他中東國家
- 非洲
- 南非
- 奈及利亞
- 其他非洲國家
- 中東
- 北美洲
第6章 競爭情勢
- 市場集中度
- 策略趨勢
- 市佔率分析
- 公司簡介
- Azkoyen Group
- Fuji Electric Co. Ltd.
- Crane Payment Innovations(CPI)
- Evoca Group
- SandenVendo America
- FAS International SpA
- Bianchi Vending Group SpA
- Rhea Vendors Group
- Seaga Manufacturing Inc.
- Westomatic Vending Services Ltd.
- Jofemar Corporation
- Sielaff GmbH
- Fastcorp Vending LLC
- Automated Merchandising Systems Inc.
- U-Select-It(USI)
- TCN Vending Machine Co. Ltd.
- Haloo Automation Equipment Co. Ltd.
- Futura Vending Pte Ltd.
- Yo-Kai Express Inc.
- Vendekin Technologies Pvt Ltd.
- Nayax Ltd.
- TOMRA Systems ASA
- Vendex International Ltd.
- Royal Vendors Inc.
- Fastenal(Industrial Vending)
第7章 市場機會與未來趨勢
- 評估閒置頻段和未滿足的需求
According to Mordor Intelligence, the connected vending machine market size is expected to grow from 8.08 million units in 2025 to 9.04 million units in 2026 and is forecast to reach 15.82 million units by 2031 at 11.86% CAGR over 2026-2031.
This report is Segmented by Machine Type (Wall-Mounted, Table-Top, and Stand-Alone Cabinet), Product Type (Beverages, Snacks, and More), Application/Location (Airports, Railway and Metro Stations, and More), Connectivity/Technology (Telemetry-Enabled, Fully IoT-Connected, and More), Payment Technology (Cash and Coin, Card Reader, and More), and Geography. The Market Forecasts are Provided in Terms of Shipments.
Global Connected Vending Machine Market Trends and Insights
Growing Adoption of Cashless and Mobile Payments
Global payment digitalisation is steering the connected vending machine market toward card-free transactions that already represent as much as 50% of sales for well-placed assets. The pairing of NFC smartphones, contactless cards, and mobile wallets removes friction, expands ticket sizes, and unlocks loyalty schemes driven by real-time POS data. Cantaloupe's Engage Pulse reader lifted crane-game revenue 85% through ladder pricing that charges once for multiple plays. Operators gain richer shopper analytics to refine planograms, while biometric wallets signal a next wave of frictionless settlement as DyDo pilots face-pay units with NEC in Japan.
Demand for Contactless, Hygienic Retail
Post-pandemic risk awareness pushes businesses to adopt touch-free dispensing that reassures patrons and satisfies internal health protocols. Machines with motion sensing, voice prompts, and QR-code Apps replace physical keypads, and ultraviolet or blue-light sanitising cycles disinfect contact areas between purchases, as shown by HMSHost's self-checkout kiosks at Charlotte Douglas International Airport. Remote dashboards verify cleaning logs, letting operators demonstrate compliance to facility managers. Healthcare, corporate, and education sites, therefore, prioritise smart fleets that minimise shared-surface concerns while offering extended SKU variety.
High Initial Cap-ex and Installation Outlay
Advanced machines cost from USD 4,299 for entry-level AI models to above USD 15,000 for multi-temperature kiosks, stretching cash flow for small route operators. Additional costs arise from power upgrades, connectivity subscriptions, and payment gateway fees. Mixed fleets often persist because operators retrofit selectively, delaying the network-effect benefits of full digitisation and slowing connected vending machine market penetration in cost-sensitive locales.
Other drivers and restraints analyzed in the detailed report include:
- Retail Automation to Offset Labour Costs
- Rapid Expansion of Transit Hubs (Airport/Rail)
- Vandalism and Security of Unattended Assets
For complete list of drivers and restraints, kindly check the Table Of Contents.
Segment Analysis
Stand-alone cabinets accounted for 59.55% of 2025 placements, anchoring the connected vending machine market with broad SKU capacity that suits transport concourses and campuses. Wall-mounted designs are now compounding at 13.55% as landlords squeeze incremental services into corridors and break-rooms. The connected vending machine market size for stand-alone units remains large, yet compact fixtures attract operators seeking incremental revenue without floor-space trade-offs.
Technological miniaturisation enables wall units to match larger cousins on payment options, remote telemetry, and multi-temperature storage. Touchscreens, LED lighting, and cloud SKU tracking come standard, while lighter frames lower installation costs. These traits lift adoption across hospitals, schools, and boutique co-working sites where safety codes restrict floor obstruction.
Beverages held 37.65% of 2025 revenue due to established cold-chain logistics, but fresh and frozen food is compounding at 13.74% as consumers embrace healthier grab-and-go meals. Operators rely on IoT temperature logs to satisfy HACCP standards and on AI price markdowns to curb spoilage, boosting the connected vending machine market's appeal in corporate dining replacements.
Dynamic salad kiosks in Tokyo, which flex prices by time of day to reduce waste, prove the model's viability. New packaging keeps food fresh for 48 hours, while predictive restocking routes align supply with consumption peaks. These innovations elevate consumer trust in perishable automated retail.
Complete Report Scope:
- By Machine Type
- Wall-mounted
- Table-top
- Stand-alone cabinet
- By Product Type
- Beverages
- Snacks
- Fresh and Frozen Food
- Confectionery
- Others
- By Application
- Airports
- Railway and Metro Stations
- Corporate Offices and Co-working Spaces
- Educational Institutes
- Healthcare Facilities
- Retail and Shopping Centres
- By Connectivity/Technology
- Telemetry-enabled (semi-connected)
- Fully IoT-connected (cloud CMS)
- AI-powered Smart Machines
- Reverse-vending/Deposit-return
- By Payment Technology
- Cash and Coin
- Card Reader (EMV)
- Mobile Wallet/NFC
- Biometric/Face-pay
- By Geography
- North America
- United States
- Canada
- Mexico
- South America
- Brazil
- Argentina
- Chile
- Rest of South America
- Europe
- Germany
- United Kingdom
- France
- Italy
- Spain
- Russia
- Rest of Europe
- Asia-Pacific
- China
- India
- Japan
- South Korea
- Singapore
- Malaysia
- Australia
- Rest of Asia-Pacific
- Middle East and Africa
- Middle East
- United Arab Emirates
- Saudi Arabia
- Turkey
- Rest of Middle East
- Africa
- South Africa
- Nigeria
- Rest of Africa
- Middle East
- North America
Geography Analysis
North America generated 37.25% of global revenue in 2025, reflecting sophisticated payment rails, early enterprise IoT adoption, and supportive data-privacy statutes that streamline deployments in corporate campuses and transportation venues. Cashless acceptance tops 80% across metro areas, so operators view AI upgrades as the next lever to lift same-machine sales.
Asia-Pacific is on a 14.22% CAGR path, underpinned by China's manufacturing scale and mobile-wallet ubiquity. Domestic builders such as AFEN turn out 120,000 units annually, shipping to over 100 nations, while Thailand's Tao Bin fleet moves 200,000 drinks daily through QR and face-pay interfaces. Urban rail extensions from Jakarta to Ho Chi Minh City place modern kiosks front and centre of commuter convenience.
Europe records stable yet policy-driven growth, spurred by single-use plastic rules and container deposit mandates that favour connected reverse vending endpoints. TOMRA's 98% bottle return rate across Scandinavia showcases the model, while EU GDPR pushes vendors toward edge processing to keep personal data on-device. Emerging corridors in the Middle East, Africa, and South America display early-stage adoption; as telecom operators roll out 4G/5G, vending firms partner with public-health bodies, exemplified by LA County's free naloxone kiosks, to build brand familiarity.
- Azkoyen Group
- Fuji Electric Co. Ltd.
- Crane Payment Innovations (CPI)
- Evoca Group
- SandenVendo America
- FAS International S.p.A.
- Bianchi Vending Group S.p.A.
- Rhea Vendors Group
- Seaga Manufacturing Inc.
- Westomatic Vending Services Ltd.
- Jofemar Corporation
- Sielaff GmbH
- Fastcorp Vending LLC
- Automated Merchandising Systems Inc.
- U-Select-It (USI)
- TCN Vending Machine Co. Ltd.
- Haloo Automation Equipment Co. Ltd.
- Futura Vending Pte Ltd.
- Yo-Kai Express Inc.
- Vendekin Technologies Pvt Ltd.
- Nayax Ltd.
- TOMRA Systems ASA
- Vendex International Ltd.
- Royal Vendors Inc.
- Fastenal (Industrial Vending)
Additional Benefits:
- The market estimate (ME) sheet in Excel format
- 3 months of analyst support
TABLE OF CONTENTS
1 INTRODUCTION
- 1.1 Study Assumptions and Market Definition
- 1.2 Scope of the Study
2 RESEARCH METHODOLOGY
3 EXECUTIVE SUMMARY
4 MARKET LANDSCAPE
- 4.1 Market Overview
- 4.2 Market Drivers
- 4.2.1 Growing adoption of cashless and mobile payments
- 4.2.2 Demand for contactless, hygienic retail
- 4.2.3 Retail automation to offset labour costs
- 4.2.4 Rapid expansion of transit hubs (airport/rail)
- 4.2.5 Integration with deposit-return reverse-vending
- 4.2.6 Programmatic DOOH advertising revenue streams
- 4.3 Market Restraints
- 4.3.1 High initial cap-ex and installation outlay
- 4.3.2 Vandalism and security of unattended assets
- 4.3.3 Fragmented connectivity/protocol standards
- 4.3.4 School nutrition regulations limiting SKUs
- 4.4 Industry Value Chain Analysis
- 4.5 Regulatory Landscape
- 4.6 Technological Outlook
- 4.7 Industry Attractiveness - Porter's Five Forces Analysis
- 4.7.1 Bargaining Power of Buyers
- 4.7.2 Bargaining Power of Suppliers
- 4.7.3 Threat of New Entrants
- 4.7.4 Threat of Substitutes
- 4.7.5 Intensity of Competitive Rivalry
- 4.8 Key Metrics
- 4.8.1 User Penetration Rate
- 4.8.2 Average Revenue per User (ARPU)
- 4.9 Impact of Macroeconomic Factors on the Market
5 MARKET SIZE AND GROWTH FORECASTS (SHIPMENTS)
- 5.1 By Machine Type
- 5.1.1 Wall-mounted
- 5.1.2 Table-top
- 5.1.3 Stand-alone cabinet
- 5.2 By Product Type
- 5.2.1 Beverages
- 5.2.2 Snacks
- 5.2.3 Fresh and Frozen Food
- 5.2.4 Confectionery
- 5.2.5 Others
- 5.3 By Application
- 5.3.1 Airports
- 5.3.2 Railway and Metro Stations
- 5.3.3 Corporate Offices and Co-working Spaces
- 5.3.4 Educational Institutes
- 5.3.5 Healthcare Facilities
- 5.3.6 Retail and Shopping Centres
- 5.4 By Connectivity/Technology
- 5.4.1 Telemetry-enabled (semi-connected)
- 5.4.2 Fully IoT-connected (cloud CMS)
- 5.4.3 AI-powered Smart Machines
- 5.4.4 Reverse-vending/Deposit-return
- 5.5 By Payment Technology
- 5.5.1 Cash and Coin
- 5.5.2 Card Reader (EMV)
- 5.5.3 Mobile Wallet/NFC
- 5.5.4 Biometric/Face-pay
- 5.6 By Geography
- 5.6.1 North America
- 5.6.1.1 United States
- 5.6.1.2 Canada
- 5.6.1.3 Mexico
- 5.6.2 South America
- 5.6.2.1 Brazil
- 5.6.2.2 Argentina
- 5.6.2.3 Chile
- 5.6.2.4 Rest of South America
- 5.6.3 Europe
- 5.6.3.1 Germany
- 5.6.3.2 United Kingdom
- 5.6.3.3 France
- 5.6.3.4 Italy
- 5.6.3.5 Spain
- 5.6.3.6 Russia
- 5.6.3.7 Rest of Europe
- 5.6.4 Asia-Pacific
- 5.6.4.1 China
- 5.6.4.2 India
- 5.6.4.3 Japan
- 5.6.4.4 South Korea
- 5.6.4.5 Singapore
- 5.6.4.6 Malaysia
- 5.6.4.7 Australia
- 5.6.4.8 Rest of Asia-Pacific
- 5.6.5 Middle East and Africa
- 5.6.5.1 Middle East
- 5.6.5.1.1 United Arab Emirates
- 5.6.5.1.2 Saudi Arabia
- 5.6.5.1.3 Turkey
- 5.6.5.1.4 Rest of Middle East
- 5.6.5.2 Africa
- 5.6.5.2.1 South Africa
- 5.6.5.2.2 Nigeria
- 5.6.5.2.3 Rest of Africa
- 5.6.5.1 Middle East
- 5.6.1 North America
6 COMPETITIVE LANDSCAPE
- 6.1 Market Concentration
- 6.2 Strategic Moves
- 6.3 Market Share Analysis
- 6.4 Company Profiles (includes Global level Overview, Market level overview, Core Segments, Financials as available, Strategic Information, Market Rank/Share for key companies, Products and Services, and Recent Developments)
- 6.4.1 Azkoyen Group
- 6.4.2 Fuji Electric Co. Ltd.
- 6.4.3 Crane Payment Innovations (CPI)
- 6.4.4 Evoca Group
- 6.4.5 SandenVendo America
- 6.4.6 FAS International S.p.A.
- 6.4.7 Bianchi Vending Group S.p.A.
- 6.4.8 Rhea Vendors Group
- 6.4.9 Seaga Manufacturing Inc.
- 6.4.10 Westomatic Vending Services Ltd.
- 6.4.11 Jofemar Corporation
- 6.4.12 Sielaff GmbH
- 6.4.13 Fastcorp Vending LLC
- 6.4.14 Automated Merchandising Systems Inc.
- 6.4.15 U-Select-It (USI)
- 6.4.16 TCN Vending Machine Co. Ltd.
- 6.4.17 Haloo Automation Equipment Co. Ltd.
- 6.4.18 Futura Vending Pte Ltd.
- 6.4.19 Yo-Kai Express Inc.
- 6.4.20 Vendekin Technologies Pvt Ltd.
- 6.4.21 Nayax Ltd.
- 6.4.22 TOMRA Systems ASA
- 6.4.23 Vendex International Ltd.
- 6.4.24 Royal Vendors Inc.
- 6.4.25 Fastenal (Industrial Vending)
7 MARKET OPPORTUNITIES AND FUTURE TRENDS
- 7.1 White-Space and Unmet-Need Assessment

 智慧自動販賣機食品解決方案市場預測至2034年-全球分析(按產品類型、技術整合、安裝位置、經營模式、食品類別創新、消費者細分和區域分類)
 北美和歐洲自動販賣機:市場佔有率分析、行業趨勢和統計數據以及成長預測(2026-2031 年)自動販賣機:市場佔有率分析、產業趨勢與統計、成長預測(2026-2031)醫療自動販賣機:市場佔有率分析、產業趨勢與統計、成長預測(2026-2031)
 零售自動販賣機市場-2026-2032年全球市場預測
 全球冷藏自動販賣機市場規模、佔有率、趨勢和成長分析報告(2026-2034)
 2026-2030年全球自動販賣機市場
 2026年全球生牛奶起司旅遊市場報告
 零售自動販賣機市場規模、佔有率和成長分析:按型號、產品類型、安裝類型、所有權模式、最終用戶和地區分類-2026-2033年產業預測
 酒精自動販賣機市場-全球產業規模、佔有率、趨勢、機會和預測(按技術類型、最終用戶、地區和競爭格局分類,2021-2031年)