


 |
市場調查報告書
商品編碼
2124711
汽車資料貨幣化:市場佔有率分析、產業趨勢與統計、成長預測(2026-2031)Automotive Data Monetization - Market Share Analysis, Industry Trends & Statistics, Growth Forecasts (2026 - 2031) |
||||||

※ 本網頁內容可能與最新版本有所差異。詳細情況請與我們聯繫。
據 Mordor Intelligence 稱,2025 年汽車數據貨幣化市場價值 5.5 億美元,預計將從 2026 年的 6.9 億美元成長到 2031 年的 21.8 億美元。
預測期(2026-2031 年)的複合年成長率預計為 25.86%。
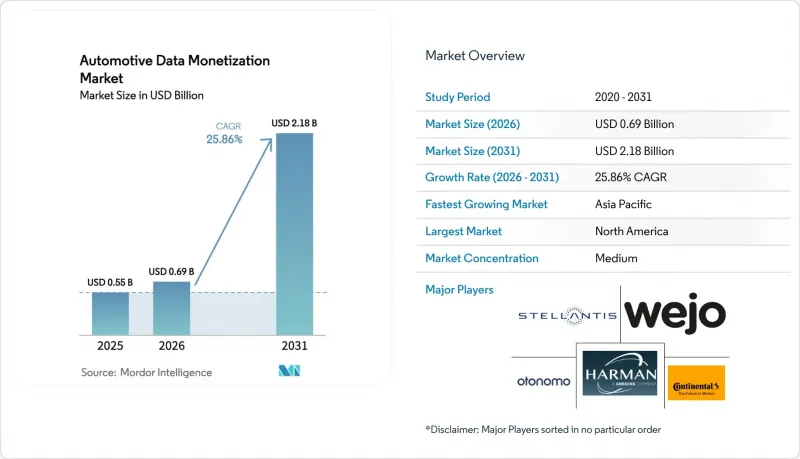
本報告按盈利模式(直接數據許可、訂閱式資訊服務等)、應用領域(里程保險、預測性維護等)、最終用戶(汽車原始設備製造商、一級供應商、保險公司等)、數據類型(遠端資訊處理和車輛狀況數據等)以及地區進行細分。市場預測以美元計價。
全球汽車數據貨幣化市場趨勢及洞察
聯網汽車和V2X基礎設施的普及
2024 年式中將有一半配備嵌入式連網功能,預計到 2030 年普及率將達到 90%。借助雙向 V2X(車聯網)通訊,每天有超過 200 個車載感測器傳輸 3 至 40 GB 的數據,有效地將汽車轉變為行動資料中心。第五代網路可實現亞毫秒延遲,從而支援諸如協同情境察覺通訊和即時分析服務等安全關鍵型應用場景。在數據量激增的背景下,汽車數據貨幣化市場正受益於交通最佳化、預測性維護訂閱和基於位置的服務,這些服務均可從持續的資料饋送中獲取價值。汽車製造商和市政當局已經在試行 5G 路側設備,這些設備可向駕駛員發送即時危險警報,並收集匿名遙測資料用於擁塞管理。
擴大基於里程和使用情況的保險計劃。
基於車載資訊系統的保險正從試點階段走向主流,北美和歐洲的主要保險公司紛紛推出基於駕駛風格和里程的「按駕駛付費」和「按里程付費」產品。涵蓋速度、加速度、轉彎和環境條件等詳細指標被輸入人工智慧模型,以計算個人風險評分,從而將保險承保定價從基於人口統計平均值轉向基於行為的定價。安全駕駛員可獲得保費折扣,保險公司可降低理賠成本,數據提供者可從高頻資料流獲得持續收入。原始設備製造商 (OEM) 在工廠整合車載資訊系統模組正在加速這一趨勢的普及,降低售後設備成本,並確保數據品質。早期研究表明,當預測模型提供主動式駕駛指導時,損失率可降低兩位數。
人們越來越關注網路安全和隱私問題
如今,汽車已成為網路攻擊的主要目標,因為它們會收集大量個人信息,並可能成為存取安全關鍵功能的入口。備受矚目的資料外洩事件以及《一般資料保護規則》(GDPR) 和《加州消費者隱私法案》(CCPA) 等嚴格法規,對用戶同意、加密和資料最小化提出了更高的要求。汽車製造商必須投資於安全啟動鏈、空中下載 (OTA) 修補程式管理和持續威脅監控,這增加了營運成本,並延緩了新資料共用協議的簽署。隱私問題也影響了消費者選擇加入的意願,從而限制了汽車資料貨幣化市場的資料供應,並迫使相關人員採用諸如差分隱私和設備端處理等保護隱私的分析技術。
細分市場分析
到2025年,直接資料授權將佔據汽車資料貨幣化市場36.78%的佔有率,仍然是尋求維護客戶關係和定價權的原始設備製造商(OEM)的首選方式。包含位置數據、診斷數據和使用指標的基於合約的資料集被出售給保險公司、車隊營運商和分析供應商,從而產生即時現金流。雖然在預測期內,直接授權的絕對佔有率將繼續成長,但隨著收益共享市場的擴張,其相對主導地位將會下降。這些平台營運商匯總來自多個品牌的匿名數據,管理用戶授權,並簡化技術複雜性。因此,收益共享模式預計將實現26.62%的複合年成長率,在所有類別中成長率最高,這反映出買家越來越傾向於選擇匯總的、標準化的和合規性的數據存取方式。
同時,基於訂閱的API正在利用直播串流作為持續的收入來源,使開發者能夠將即時洞察融入出行應用、導航和車隊管理儀錶板中。雖然廣告主導的模式仍處於早期階段,但隨著車載介面支援情境化內容,它們具有創造新價值的潛力。促進開放取用的法規,特別是歐盟的資料法,透過限制壟斷控制,正在推動市場化模式的發展。因此,汽車資料貨幣化產業正在轉向混合策略:原始設備製造商(OEM)直接獲得優質資料集的授權,同時參與收益分成協議以擴大覆蓋範圍。
預計到2025年,基於里程的保險(UBI)將佔總收入的41.64%,反映出保險公司正迅速轉向行為模式的核保模式。高頻遙測技術能夠實現精細化的風險細分,從而降低索賠率,並為安全駕駛提供個人化獎勵。預測性維護緊隨其後,成為第二大領域,它利用車輛狀態訊號主動安排維護,最大限度地減少停機時間。智慧城市和基礎設施項目雖然規模仍然較小,但在政府為緩解交通堵塞、減少排放氣體和最佳化公共交通所做的努力的支持下,其複合年成長率(CAGR)高達27.68%,成為成長最快的領域。
車隊管理平台整合了路線規劃、駕駛員評估和燃油效率分析,利用相同數據流降低商業營運商的營運成本。軟體定義車輛 (SDV) 因其能夠根據位置、出行狀態和乘客偏好提供個人化促銷訊息而備受關注,從而推動了車內商務和廣告的發展。隨著電氣化趨勢的推進,電池健康管理和 V2G(車網互動)服務應運而生,提供了新的資料集,使汽車數據貨幣化市場的收入來源更加多元化。
區域分析
預計到2025年,北美仍將是最大的單一區域,汽車數據貨幣化市場將因車載資訊技術的普及、基於使用量的保險的早期應用以及促進創新的數據政策而不斷擴張。密西根州和加州的州級試點計畫已展示了基於匿名車輛遙測資料的即時擁塞收費模型。汽車製造商和保險公司之間的合作,以及在購車時引入的同意機制,正在加速數據利用,並進一步鞏固該地區的領先地位。
歐洲保持了第二的位置。即將實施的歐盟資料法強制要求使用標準化應用程式介面(API),並明確了企業間資料共用的義務,從而建立了一個可預測的框架,有望降低資料碎片化帶來的成本。一個德國豪華汽車品牌已經提供駕駛數據訂閱服務,該服務符合該法律的同意條款。公共機構正在利用匯總資料集來最佳化低排放氣體區並動態調整交通號誌,這表明資料存取方式正從一次性調查轉向持續性資訊服務。
亞太地區的快速成長得益於多項國家政策的推動。中國工業和資訊化部(工信部)強制要求將聯網汽車數據上報至本地伺服器,使地方政府能夠取得交通分析數據。日本的「社會5.0」藍圖正在加速跨產業數據融合,將出行、能源和商業數據流整合到以公民為中心的平台中。在印度,商用車強制安裝AIS-140車載資訊系統正在創造新的標準化資料來源。這種不斷成長的數據供應,加上快速發展的開發者生態系統,正推動汽車數據貨幣化市場以該地區最高的複合年成長率成長。
其他好處:
- Excel格式的市場預測(ME)表
- 3個月的分析師支持
目錄
第1章:引言
- 研究假設和市場定義
- 調查範圍
第2章:調查方法
第3章執行摘要
第4章 市場狀況
- 市場概覽
- 市場促進因素
- 聯網汽車和V2X基礎設施的普及
- 根據使用情況擴大保險計劃
- 原始設備製造商向軟體定義汽車和訂閱模式轉型
- 加速整個汽車價值鏈的數位轉型
- 監管部門為獲取開放資料和引入標準化API所做的努力
- 用於實現合成車輛資料產品的AI平台模型
- 市場限制因素
- 人們越來越關注網路安全和隱私問題
- 原始設備製造商之間缺乏標準化的資料分類系統。
- 向邊緣運算的轉變限制了集中式資料的可用性。
- 消費者強烈反對收集機上監控數據
- 產業生態系分析
- 監理情勢
- 技術展望
- 宏觀經濟因素的影響
- 波特五力分析
第5章 市場規模與成長預測
- 透過貨幣化模式
- 直接資料許可
- 基於訂閱的資訊服務
- 收益分成市場
- 基於廣告的模式
- 透過使用
- 里程保險
- 預測性保護
- 車輛管理與最佳化
- 車載廣告和商業
- 智慧城市和基礎建設規劃
- 最終用戶
- 汽車OEM廠商
- 一級供應商
- 保險公司
- 車輛運營商和旅行服務提供商
- 政府和基礎設施機構
- 類型
- 車載資訊系統和車輛狀況數據
- 資訊娛樂和車內互動數據
- 動力傳動系統和電池性能數據
- 用於高級駕駛輔助系統 (ADAS) 和自動駕駛的感測器數據
- 按地區
- 北美洲
- 美國
- 加拿大
- 墨西哥
- 南美洲
- 巴西
- 阿根廷
- 其他南美國家
- 歐洲
- 德國
- 法國
- 英國
- 義大利
- 西班牙
- 俄羅斯
- 其他歐洲國家
- 亞太地區
- 中國
- 日本
- 印度
- 韓國
- 澳洲和紐西蘭
- 東南亞
- 其他亞太國家
- 中東
- 沙烏地阿拉伯
- 阿拉伯聯合大公國
- 土耳其
- 其他中東國家
- 非洲
- 南非
- 埃及
- 其他非洲國家
- 北美洲
第6章 競爭情勢
- 市場集中度
- 策略趨勢
- 市佔率分析
- 公司簡介
- Otonomo Technologies Ltd.
- Wejo Group Limited
- Continental AG
- Harman International Industries Inc.
- Stellantis NV(Mobilisights)
- Xevo Inc.(Lear Corporation)
- Robert Bosch GmbH
- HERE Global BV
- TomTom International BV
- Amazon Web Services Inc.
- Microsoft Corporation
- Verizon Communications Inc.(Verizon Connect)
- Databricks, Inc.
- Palantir Technologies
- Vinli Inc.
- Caruso GmbH
- Denso Corporation
- Sibros Technologies Inc.
- Tesla Inc.
- Smartcar Inc.
第7章 市場機會與未來展望
According to Mordor Intelligence, the automotive data monetization market size was valued at USD 0.55 billion in 2025 and estimated to grow from USD 0.69 billion in 2026 to reach USD 2.18 billion by 2031, at a CAGR of 25.86% during the forecast period (2026-2031).
This report is Segmented by Monetization Model (Direct Data Licensing, Subscription-Based Data Services, and More), Application (Usage-Based Insurance, Predictive Maintenance, and More), End User (Automotive OEMs, Tier-1 Suppliers, Insurance Companies, and More), Data Type (Telematics and Vehicle Health Data, and More), and Geography. The Market Forecasts are Provided in Terms of Value (USD).
Global Automotive Data Monetization Market Trends and Insights
Proliferation of Connected Vehicles and V2X Infrastructure
Half of 2024 model-year vehicles shipped with embedded connectivity and penetration is on track to reach 90% by 2030. Bidirectional vehicle-to-everything links funnel 3-40 GB of data each day from more than 200 onboard sensors, effectively turning the car into a rolling data center. Fifth-generation networks supply sub-millisecond latency that unlocks safety-critical use cases such as cooperative awareness messaging and enables real-time analytics services. As data volumes soar, the automotive data monetization market benefits from traffic optimization, predictive-maintenance subscriptions, and location-based offerings that derive value from these continuous feeds. OEMs and municipalities already pilot 5G road-side units that push real-time hazard alerts to drivers and, in return, harvest anonymized telemetry for congestion management.
Expansion of Usage-Based Insurance Programs
Telematics-driven insurance shifted from pilot stage to mainstream, with major carriers rolling out pay-how-you-drive and pay-as-you-drive products across North America and Europe. Granular metrics covering speed, acceleration, cornering, and environmental context feed AI models that calculate individual risk scores, moving underwriting away from demographic averages toward behavior-based pricing. Safe drivers earn premium discounts, insurers reduce claims costs, and data suppliers secure recurring revenue from high-frequency streams. Embedded telematics modules factory-installed by OEMs accelerate this adoption, eliminating aftermarket device costs and ensuring data quality. Early studies show double-digit declines in loss ratios where predictive models trigger pre-emptive driver coaching.
Heightened Cybersecurity and Privacy Concerns
Vehicles now collect extensive personal information and serve as potential gateways to safety-critical functions, making them prime cyber targets. High-profile breaches and stricter legislation such as the General Data Protection Regulation and the California Consumer Privacy Act impose stringent consent, encryption, and minimization requirements. Automakers must invest in secure boot chains, over-the-air patch management, and continuous threat monitoring, inflating operating costs and slowing new data-sharing agreements. Privacy anxieties also affect consumer willingness to opt-in, curbing data supply to the automotive data monetization market and forcing stakeholders to adopt privacy-preserving analytics such as differential privacy and on-device processing.
Other drivers and restraints analyzed in the detailed report include:
- OEM Shift Toward Software-Defined Vehicles and Subscriptions
- Accelerating Digital Transformation Across the Automotive Value Chain
- Lack of Standardized Data Taxonomy Across OEMs
For complete list of drivers and restraints, kindly check the Table Of Contents.
Segment Analysis
Direct licensing held a 36.78% share of the automotive data monetization market in 2025 and remains the preferred path for OEMs that wish to safeguard customer relationships and pricing leverage. Contractual datasets covering location, diagnostics, and usage metrics are sold to insurers, fleets, and analytics vendors, yielding immediate cash flows. Over the forecast period, direct licensing still expands in absolute terms, yet its relative dominance erodes as revenue-sharing marketplaces accelerate. These platform operators bundle anonymized feeds from multiple brands, manage consent, and abstract technical complexities. As a result, revenue-sharing models are forecast to post a 26.62% CAGR, the fastest among all categories, reflecting rising buyer preference for aggregated, standardized, and compliant data access.
In parallel, subscription APIs monetize live streams on a recurring basis, enabling developers to embed real-time insights into mobility apps, navigation, and fleet dashboards. Advertising-driven schemes remain nascent but could unlock new value once in-cabin interfaces support contextually relevant content. Regulatory pushes for open access, notably the European Union Data Act, create tailwinds for marketplace approaches by limiting exclusive control. The automotive data monetization industry therefore transitions toward hybrid strategies where OEMs license premium datasets directly while simultaneously participating in shared-revenue exchanges for broader reach.
Usage-based insurance commanded 41.64% of 2025 revenue, reflecting insurers' rapid shift toward behavior-based underwriting. High-frequency telemetry enables fine-grained risk segmentation, which in turn reduces claims ratios and empowers tailored rewards for safer driving. Predictive maintenance followed as the second-largest field, drawing on vehicle-health signals to schedule service proactively and minimize downtime. Smart-city and infrastructure planning, though smaller today, exhibits the strongest growth at 27.68% CAGR, backed by government initiatives to alleviate congestion, curb emissions, and optimize public transport.
Fleet-management platforms integrate routing, driver scoring, and fuel-efficiency analytics, leveraging the same data streams to lower operating costs for commercial operators. In-vehicle commerce and advertising enter the picture as software-defined vehicles deliver personalized promotions based on location, trip context, and occupant preferences. Battery-health and vehicle-to-grid services emerge alongside the electrification trend, providing fresh datasets that diversify the revenue mix inside the automotive data monetization market.
Complete Report Scope:
- Monetization Model
- Direct Data Licensing
- Subscription-Based Data Services
- Revenue-Sharing Marketplaces
- Advertising-Based Models
- Application
- Usage-Based Insurance
- Predictive Maintenance
- Fleet Management and Optimization
- In-Vehicle Advertising and Commerce
- Smart City and Infrastructure Planning
- End User
- Automotive OEMs
- Tier-1 Suppliers
- Insurance Companies
- Fleet Operators and Mobility Providers
- Government and Infrastructure Agencies
- Data Type
- Telematics and Vehicle Health Data
- Infotainment and In-Cabin Interaction Data
- Powertrain and Battery Performance Data
- ADAS and Autonomous Driving Sensor Data
- Geography
- North America
- United States
- Canada
- Mexico
- South America
- Brazil
- Argentina
- Rest of South America
- Europe
- Germany
- France
- United Kingdom
- Italy
- Spain
- Russia
- Rest of Europe
- Asia Pacific
- China
- Japan
- India
- South Korea
- Australia and New Zealand
- Southeast Asia
- Rest of Asia Pacific
- Middle East
- Saudi Arabia
- United Arab Emirates
- Turkey
- Rest of Middle East
- Africa
- South Africa
- Egypt
- Rest of Africa
- North America
Geography Analysis
North America remained the single largest region in 2025, with the automotive data monetization market size benefiting from widespread telematics installations, early usage-based insurance adoption, and pro-innovation data policies. State-level pilots in Michigan and California demonstrate real-time congestion-pricing models that rely on anonymized vehicle telemetry. OEM-insurer collaborations further entrench the region's leadership by embedding consent mechanisms at vehicle purchase, which expedites data activation.
Europe sustained second position. The forthcoming EU Data Act mandates standardized APIs and defines B2B data-sharing obligations, creating predictable guardrails that may reduce fragmentation costs. German premium brands are already offering optional driving-data subscriptions compliant with the Act's consent provisions. Public agencies tap aggregated datasets to refine low-emission zones and adjust traffic signals dynamically, signaling a shift from one-off research access toward recurring data services.
Asia Pacific's fast growth stems from multiple national policies. China's MIIT requires connected-vehicle data submissions to local servers, enabling city governments to procure traffic analytics. Japan's Society 5.0 roadmap accelerates cross-industry data fusion, integrating mobility, energy, and commerce streams into citizen-centric platforms. India introduces mandatory AIS-140 telematics in commercial fleets, unlocking a new supply of standardized data. The rising supply aligns with a burgeoning developer ecosystem, collectively propelling the automotive data monetization market to its highest regional CAGR.
- Otonomo Technologies Ltd.
- Wejo Group Limited
- Continental AG
- Harman International Industries Inc.
- Stellantis N.V. (Mobilisights)
- Xevo Inc. (Lear Corporation)
- Robert Bosch GmbH
- HERE Global B.V.
- TomTom International B.V.
- Amazon Web Services Inc.
- Microsoft Corporation
- Verizon Communications Inc. (Verizon Connect)
- Databricks, Inc.
- Palantir Technologies
- Vinli Inc.
- Caruso GmbH
- Denso Corporation
- Sibros Technologies Inc.
- Tesla Inc.
- Smartcar Inc.
Additional Benefits:
- The market estimate (ME) sheet in Excel format
- 3 months of analyst support
TABLE OF CONTENTS
1 INTRODUCTION
- 1.1 Study Assumptions and Market Definition
- 1.2 Scope of the Study
2 RESEARCH METHODOLOGY
3 EXECUTIVE SUMMARY
4 MARKET LANDSCAPE
- 4.1 Market Overview
- 4.2 Market Drivers
- 4.2.1 Proliferation of Connected Vehicles AND V2X Infrastructure
- 4.2.2 Expansion of Usage-Based Insurance Programs
- 4.2.3 OEM Shift toward Software-Defined Vehicles and Subscriptions
- 4.2.4 Accelerating Digital Transformation across Automotive Value Chain
- 4.2.5 Regulatory Push for Open Data Access and Standardized APIs
- 4.2.6 AI Foundation Models Enabling Synthetic Vehicle Data Products
- 4.3 Market Restraints
- 4.3.1 Heightened Cybersecurity and Privacy Concerns
- 4.3.2 Lack of Standardized Data Taxonomy across OEMs
- 4.3.3 Edge-Computing Shift Limiting Centralized Data Availability
- 4.3.4 Consumer Backlash to In-Cabin Surveillance Data Collection
- 4.4 Industry Ecosystem Analysis
- 4.5 Regulatory Landscape
- 4.6 Technological Outlook
- 4.7 Impact of Macroeconomic Factors
- 4.8 Porter's Five Forces Analysis
- 4.8.1 Bargaining Power of Buyers
- 4.8.2 Bargaining Power of Suppliers
- 4.8.3 Threat of New Entrants
- 4.8.4 Threat of Substitutes
- 4.8.5 Competitive Rivalry
5 MARKET SIZE AND GROWTH FORECASTS (VALUE)
- 5.1 Monetization Model
- 5.1.1 Direct Data Licensing
- 5.1.2 Subscription-Based Data Services
- 5.1.3 Revenue-Sharing Marketplaces
- 5.1.4 Advertising-Based Models
- 5.2 Application
- 5.2.1 Usage-Based Insurance
- 5.2.2 Predictive Maintenance
- 5.2.3 Fleet Management and Optimization
- 5.2.4 In-Vehicle Advertising and Commerce
- 5.2.5 Smart City and Infrastructure Planning
- 5.3 End User
- 5.3.1 Automotive OEMs
- 5.3.2 Tier-1 Suppliers
- 5.3.3 Insurance Companies
- 5.3.4 Fleet Operators and Mobility Providers
- 5.3.5 Government and Infrastructure Agencies
- 5.4 Data Type
- 5.4.1 Telematics and Vehicle Health Data
- 5.4.2 Infotainment and In-Cabin Interaction Data
- 5.4.3 Powertrain and Battery Performance Data
- 5.4.4 ADAS and Autonomous Driving Sensor Data
- 5.5 Geography
- 5.5.1 North America
- 5.5.1.1 United States
- 5.5.1.2 Canada
- 5.5.1.3 Mexico
- 5.5.2 South America
- 5.5.2.1 Brazil
- 5.5.2.2 Argentina
- 5.5.2.3 Rest of South America
- 5.5.3 Europe
- 5.5.3.1 Germany
- 5.5.3.2 France
- 5.5.3.3 United Kingdom
- 5.5.3.4 Italy
- 5.5.3.5 Spain
- 5.5.3.6 Russia
- 5.5.3.7 Rest of Europe
- 5.5.4 Asia Pacific
- 5.5.4.1 China
- 5.5.4.2 Japan
- 5.5.4.3 India
- 5.5.4.4 South Korea
- 5.5.4.5 Australia and New Zealand
- 5.5.4.6 Southeast Asia
- 5.5.4.7 Rest of Asia Pacific
- 5.5.5 Middle East
- 5.5.5.1 Saudi Arabia
- 5.5.5.2 United Arab Emirates
- 5.5.5.3 Turkey
- 5.5.5.4 Rest of Middle East
- 5.5.6 Africa
- 5.5.6.1 South Africa
- 5.5.6.2 Egypt
- 5.5.6.3 Rest of Africa
- 5.5.1 North America
6 COMPETITIVE LANDSCAPE
- 6.1 Market Concentration
- 6.2 Strategic Moves
- 6.3 Market Share Analysis
- 6.4 Company Profiles (includes Global level Overview, Market level overview, Core Segments, Financials as available, Strategic Information, Market Rank/Share for key companies, Products and Services, and Recent Developments)
- 6.4.1 Otonomo Technologies Ltd.
- 6.4.2 Wejo Group Limited
- 6.4.3 Continental AG
- 6.4.4 Harman International Industries Inc.
- 6.4.5 Stellantis N.V. (Mobilisights)
- 6.4.6 Xevo Inc. (Lear Corporation)
- 6.4.7 Robert Bosch GmbH
- 6.4.8 HERE Global B.V.
- 6.4.9 TomTom International B.V.
- 6.4.10 Amazon Web Services Inc.
- 6.4.11 Microsoft Corporation
- 6.4.12 Verizon Communications Inc. (Verizon Connect)
- 6.4.13 Databricks, Inc.
- 6.4.14 Palantir Technologies
- 6.4.15 Vinli Inc.
- 6.4.16 Caruso GmbH
- 6.4.17 Denso Corporation
- 6.4.18 Sibros Technologies Inc.
- 6.4.19 Tesla Inc.
- 6.4.20 Smartcar Inc.
7 MARKET OPPORTUNITIES AND FUTURE OUTLOOK
- 7.1 White-Space and Unmet-Need Assessment

 全球車載數據貨幣化平台市場規模、佔有率、趨勢和成長分析報告(2026-2034)
 汽車數據貨幣化:全球市場
 2026年全球汽車數據貨幣化平台市場報告汽車數據貨幣化平台市場規模、佔有率、成長、全球產業分析、區域趨勢及2026年至2034年預測
 汽車資料市場預測至2034年-全球資料分析(按資料類型、資料來源、車輛類型、驅動系統、部署模式、資料所有權、應用程式、最終使用者和地區分類)
 生成式人工智慧在自動駕駛汽車訓練資料產生中的應用:市場佔有率分析、行業趨勢和統計數據以及成長預測(2026-2031 年)
 汽車資料管理市場:商業機會、成長要素、產業趨勢分析及2026-2035年預測汽車資料貨幣化市場預測至2034年:按資料類型、貨幣化模式、部署模式、收入來源、應用、最終用戶和地區分類的全球分析全球汽車數據分析市場規模、佔有率、趨勢和成長分析報告(2026-2034)汽車數據貨幣化平台市場機會、成長要素、產業趨勢分析及2026-2035年預測