


 |
市場調查報告書
商品編碼
2124673
過程分析設備:市場佔有率分析、產業趨勢與統計、成長預測(2026-2031)Process Analytical Instrumentation - Market Share Analysis, Industry Trends & Statistics, Growth Forecasts (2026 - 2031) |
||||||

※ 本網頁內容可能與最新版本有所差異。詳細情況請與我們聯繫。
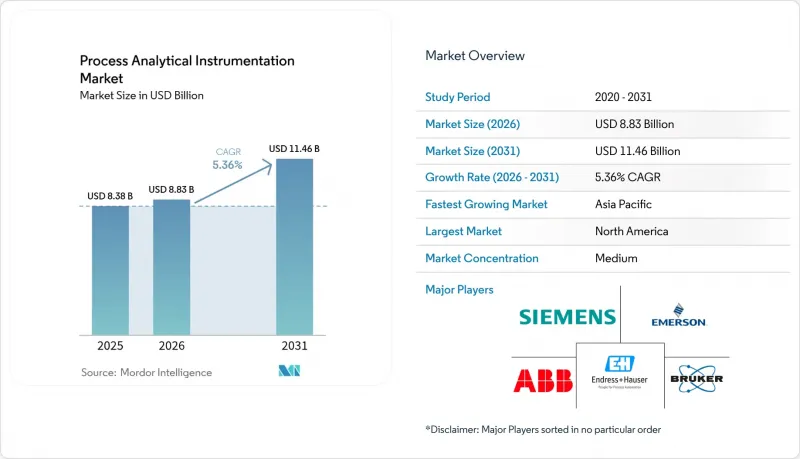
根據 Mordor Intelligence 預測,流程分析儀器市場將從 2025 年的 83.8 億美元成長到 2026 年的 88.3 億美元,然後在 2031 年達到 114.6 億美元,2026 年至 2031 年的複合年成長率為 5.36%。
本報告按儀器類型(氣相層析、氣體分析儀、液體分析儀、光譜儀)、組件(硬體、軟體、服務)、終端用戶產業(石油天然氣、化學和石化、其他)、安裝類型(線上/內聯、近線、實驗室)和地區進行細分。市場預測以美元計價。
全球過程分析儀器市場趨勢與洞察
推動制定要求遵守進程內品質和排放規定的法規。
一系列新的環境法規要求對煙囪、火炬和生物反應器進行持續監測,這立即擴大了製程分析儀器的潛在基本客群。歐盟2024年空氣品質指令強制要求對超細懸浮微粒進行計數,而加拿大的CEMS(連續排放氣體監測系統)標準則收緊了二氧化硫、氮氧化物和一氧化碳探頭的校準週期。亞洲類似的監管發展正在彌補先前存在的執法漏洞,成千上萬的工廠正朝著強制連續排放監測的方向邁進。能夠提供符合ISO 17025和EN 15267標準預認證的分析儀器的供應商將縮短客戶合規的路徑。除了環境排放源之外,類似的監管意圖也正在滲透到製藥業的GMP和食品安全標準中,隨線分析可以降低批次處置成本。
整個流程工業的數位化和工業4.0實施
隨著雲端原生SCADA平台和工業IoT閘道器的日益普及,製程分析儀器市場面臨新的連接需求,要求儀器製造商整合OPC UA、MQTT和安全IP協定堆疊。將分析儀與數位孿生技術相結合的工廠可以在產品品質下降之前很久就獲得多變量洞察,例如原料品質的變化和催化劑的劣化。軟體供應商提供的AI增強型化學計量引擎可以自動進行頻譜解讀,使即使是非博士級的專家也能進行高階分析。然而,網路暴露會增加網路風險,因此推廣IEC 62443認證儀器的公司正在獲得競爭優勢。這種對連接性和安全性的雙重需求正在推動軟體和服務收入的持續成長,價值創造的重點也正在從硬體轉向數位服務。
先進分析設備的初始投資和生命週期成本高昂
一套完整的CEMS平台或三重四極柱式質譜儀的投資額超過50萬美元,每年的維護成本可達購置價格的20%。在新興市場,外匯波動、進口關稅以及本地服務設施的匱乏推高了交付成本。對於停機損失龐大的連續生產流程工廠而言,冗餘設計至關重要,這會導致資本需求翻倍。這些經濟因素正在減緩小規模化學、食品和特殊材料生產商採用分析儀器的步伐。
細分市場分析
至2025年,氣體分析儀將佔據製程分析儀器市場34.25%的佔有率。這主要得益於煉油廠、化工裂解裝置和電廠鍋爐等場所普遍實施的強制性排放監測和製程最佳化措施。此市佔率優勢源自於對SO2、NOx、CO和CO2進行連續測量的必要性,以符合環境許可和碳定價機制的要求。儘管目前規模仍然較小,但預計到2031年,光譜儀的需求將以6.38%的複合年成長率成長。這主要歸功於攜帶式X光螢光光譜儀和手持式拉曼光譜儀的日益普及,這些儀器正在推動裝卸碼頭和公用設施撬裝設備中元素和分子的識別。
在本十年後半期,隨著電力公司維修氫氣共燃生產線以及電解槽OEM廠商升級系統,氣體分析儀的安裝數量預計將會增加。然而,在生物技術和電池材料生產線中,即時雜質追蹤至關重要,光譜儀可能會佔據更大的市場佔有率。微型氣相層析儀架構、氫氣載氣和智慧閥式爐在保持分離性能的同時,有效解決了氦氣短缺的問題。這種綜合發展將支撐硬體銷售,同時價值正向應用型化學計量學轉移,進一步提升軟體在過程分析儀器市場的戰略重要性。
預計到2025年,硬體銷售額將佔總銷售額的51.35%,這反映了每個分析儀器組件中包含的大量感測器以及樣品製備系統的機械複雜性。先進的光學元件、堅固的氣體池和防爆外殼推高了平均售價。同時,製程分析儀器市場的軟體市場正以6.55%的複合年成長率成長,這得益於嵌入式人工智慧引擎將原始頻譜轉化為可操作的設定變更。像布魯克這樣的供應商正在將SciY數據平台整合到其整個產品組合中,並將基於訂閱的化學計量學服務打包,以提高毛利率並創造經常性收入。
服務合約通常包含校準、驗證和網路安全修補程式等內容,並簽訂多年期協議。光是艾默生一家公司在2024年就從測量和分析服務中累計了40.6億美元的收入。產業技能缺口正在推動對服務的需求,這為維護全球現場網路的供應商創造了結構性優勢。隨著預測性維護演算法的日趨成熟,我們預計到2030年後,軟體即服務(SaaS)模式的成長速度將超過硬體資本銷售。
區域分析
到2025年,北美將佔據41.05%的市場佔有率。這主要歸功於美國環保署(EPA)40 CFR第60/75部分法規和職業安全與健康管理局(OSHA)的暴露限值規定,煉油廠、化工園區和發電廠必須強制安裝連續分析儀器。充足的資本投資預算、完善的服務基礎設施和經驗豐富的勞動力,使得人工智慧驅動的化學計量學得以快速普及。儘管持續的氦氣短缺和勞動力短缺減緩了設備更換週期,但供應商管理的維護服務合約可以降低停機風險。
亞太地區正經歷8.21%的年成長率,使其成為製程分析儀器市場成長最快的地區。中國更嚴格的污染控制法規、印度的營運許可證要求以及日本由JAIMA主導的標準化舉措,都促成了大規模積壓。連續分析儀不僅被大型訂單和鋼鐵廠採用,也被小規模的特種化學品工業園區採用,以滿足出口市場的品管(QC)要求。區域供應商正與全球原始設備製造商(OEM)合作,以實現服務本地化,從而減輕進口關稅和語言障礙帶來的負擔。
在歐洲,隨著2024年10月生效的《空氣品質指令》的實施,超細懸浮微粒檢測的需求持續穩定成長。該指令要求所有27個成員國都必須對超細顆粒物進行測量。萊茵河沿岸和伊比利亞半島的石化產業叢集正在用最先進的傅立葉變換紅外光譜儀(FTIR)取代傳統的濁度計,以滿足二氧化碳課稅申報要求。同時,德國和西班牙的綠色氫氣電解槽計畫需要對高純度氧氣和氫氣檢驗,這推動了分析設備的引進。東歐的加工企業為了獲得歐盟再生能源計畫(REPowerEU)的資金籌措支持,正在採用西方的排放標準,預計將進一步增加對供應商的需求。
其他好處:
- Excel格式的市場預測(ME)表
- 3個月的分析師支持
目錄
第1章:引言
- 研究假設和市場定義
- 調查範圍
第2章:調查方法
第3章執行摘要
第4章 市場狀況
- 市場概覽
- 市場促進因素
- 監管機構為確保符合進程內品質和排放標準所做的努力
- 流程工業中的數位化和工業4.0實施
- 石油、天然氣和石化產業對即時分析的需求日益成長。
- 生物製藥領域連續生產線的快速擴張
- 建造綠色氫氣電解系統,需高純度氣體分析。
- 引入需要高精度在線數據的數位孿生模型
- 市場限制因素
- 先進分析儀器的初始投資成本和生命週期成本都很高。
- 熟練的校準和維護人員短缺
- 網路連線分析儀中的網路安全漏洞
- 全球氦氣短缺正在影響氣相層析儀的運作。
- 波特五力分析
- 產業供應鏈分析
- 宏觀經濟因素的影響
第5章 市場規模與成長預測
- 依設備類型
- 氣相層析
- 氣體分析儀
- 液體分析儀
- 光譜儀
- 按組件
- 硬體
- 軟體
- 服務
- 按最終用戶行業分類
- 石油和天然氣
- 化工/石油化工
- 製藥和生物技術
- 金屬和採礦
- 水和污水處理
- 食品/飲料
- 發電
- 按安裝類型
- 線上/線上
- 線
- 實驗室
- 按地區
- 北美洲
- 美國
- 加拿大
- 墨西哥
- 南美洲
- 巴西
- 阿根廷
- 其他南美國家
- 歐洲
- 德國
- 英國
- 法國
- 義大利
- 西班牙
- 俄羅斯
- 其他歐洲國家
- 亞太地區
- 中國
- 日本
- 印度
- 韓國
- 東南亞
- 其他亞太國家
- 中東和非洲
- 中東
- 沙烏地阿拉伯
- 阿拉伯聯合大公國
- 土耳其
- 其他中東國家
- 非洲
- 南非
- 奈及利亞
- 其他非洲國家
- 中東
- 北美洲
第6章 競爭情勢
- 市場集中度
- 策略趨勢
- 市佔率分析
- 公司簡介
- ABB Ltd
- Siemens AG
- Emerson Electric Co.
- Endress+Hauser Group Services AG
- Bruker Corporation
- Yokogawa Electric Corporation
- Thermo Fisher Scientific Inc.
- Agilent Technologies Inc.
- Honeywell International Inc.
- Mettler-Toledo International Inc.
- MKS Instruments Inc.
- Teledyne Technologies Incorporated
- Servomex Group Ltd.
- SICK AG
- Focused Photonics Inc.
- Hach Company(Danaher)
- Extrel CMS LLC
- Nova Analytical Systems Inc.
- Neo Monitors AS
- Rockwell Automation Inc.
第7章 市場機會與未來展望
According to Mordor Intelligence, the process analytical instrumentation market size is expected to grow from USD 8.38 billion in 2025 to USD 8.83 billion in 2026 and is forecast to reach USD 11.46 billion by 2031 at 5.36% CAGR over 2026-2031.
This report is Segmented by Instrument Type (Gas Chromatographs, Gas Analyzers, Liquid Analyzers, Spectrometers), Component (Hardware, Software, and Services), End-User Industry (Oil and Gas, Chemicals and Petrochemicals, and More), Installation Type (In-line/On-line, At-Line, and Laboratory), and Geography. The Market Forecasts are Provided in Terms of Value (USD).
Global Process Analytical Instrumentation Market Trends and Insights
Regulatory push for in-process quality and emission compliance
A wave of fresh environmental statutes is forcing continuous monitoring across smokestacks, flares, and bioreactors, immediately enlarging the addressable base of the process analytical instrumentation market. The EU's Ambient Air Quality Directive of 2024 compels ultrafine-particle counting, while Canada's CEMS code tightens calibration cycles for SO2, NOx, and CO probes. Similar rulemaking in Asia is closing historical enforcement gaps, moving thousands of plants toward mandatory continuous emission monitoring. Vendors able to supply analyzers pre-certified to ISO 17025 and EN 15267 standards shorten customers' route to compliance. Beyond environmental stacks, the same regulatory intent is seeping into pharmaceutical GMP and food safety standards, where inline analytics mitigate batch rejection costs.
Digitalization and Industry 4.0 adoption across process industries
As cloud-native SCADA platforms and industrial IoT gateways proliferate, the process analytical instrumentation market gains new connectivity mandates, compelling instrument makers to embed OPC UA, MQTT, and secure IP stacks. Plants pairing analyzers with digital twins derive multivariate insights, such as feed-quality drift or catalyst aging, well before the product degrades. Software vendors' AI-enhanced chemometric engines now automate spectrum interpretation, expanding advanced analysis beyond PhD-level specialists. However, network exposure heightens cyber-risk, so firms promoting IEC 62443-certified appliances gain competitive credibility. This dual connectivity-and-security requirement propels recurring software and service revenues, tilting value creation from hardware toward digital offerings.
High capital and lifecycle costs of sophisticated analyzers
Complete CEMS platforms or triple-quadrupole mass spectrometers require outlays that exceed USD 500,000, with annual service costs reaching 20% of the purchase price. Emerging economies face currency volatility, import duties, and a dearth of local service hubs that inflate delivered pricing. In continuous-process plants where downtime penalties are brutal, redundancy becomes mandatory, doubling capital requirements. These economics delays analyzer adoption among small-scale chemical, food, and specialty-materials producers.
Other drivers and restraints analyzed in the detailed report include:
- Rising demand for real-time analytics in oil, gas and petrochemicals
- Rapid expansion of biopharma continuous manufacturing lines
- Shortage of skilled calibration and maintenance personnel
For complete list of drivers and restraints, kindly check the Table Of Contents.
Segment Analysis
Gas analyzers held a 34.25% process analytical instrumentation market share in 2025, underpinned by universal emission-monitor mandates and pervasive process-optimization routines across refineries, chemical crackers, and power boilers. Their share advantage stems from the necessity of continuous SO2, NOx, CO, and CO2 readouts to comply with environmental permits and carbon-pricing schemes. Spectrometer demand, while smaller, is climbing at a 6.38% CAGR to 2031 as portable XRF and handheld Raman devices push elemental and molecular identification to loading docks and utility skids.
In the second half of the decade, utilities retrofitting hydrogen co-firing lines and electrolyzer OEMs will widen the gas-analyzer installed base, yet spectrometers may erode share in biotech and battery-materials lines where real-time impurity tracking becomes critical. Micro-GC architectures, hydrogen carrier gases, and smart valve ovens counter helium shortages while preserving separation performance. The combined evolution sustains hardware sales yet shifts value toward application-specific chemometrics, reinforcing the strategic importance of software inside the process analytical instrumentation market.
Hardware contributed 51.35% to 2025 revenue, mirroring large sensor counts and the mechanical complexity of sample-conditioning systems that make up each analyzer skid. Sophisticated optics, ruggedized gas-cells, and explosion-proof enclosures keep average selling prices high. The process analytical instrumentation market size for software, however, is posting a 6.55% CAGR because embedded AI engines translate raw spectra into actionable set-point changes. Suppliers such as Bruker, integrating the SciY data platform across its portfolio, are packaging subscription-based chemometrics that boost gross margin and create annuity revenue.
Service contracts wrap calibration, validation, and cyber-patching into multi-year agreements; Emerson alone booked USD 4.06 billion from measurement & analytical services in 2024. The industry's skills gap elevates service intensity, giving vendors that maintain global field networks a structural advantage. As predictive-maintenance algorithms mature, software-as-a-service offerings will likely outgrow hardware capital sales beyond 2030.
Complete Report Scope:
- By Instrument Type
- Gas Chromatographs
- Gas Analyzers
- Liquid Analyzers
- Spectrometers
- By Component
- Hardware
- Software
- Services
- By End-user Industry
- Oil and Gas
- Chemicals and Petrochemicals
- Pharmaceutical and Biotechnology
- Metals and Mining
- Water and Wastewater
- Food and Beverage
- Power Generation
- By Installation Type
- In-line/On-line
- At-line
- Laboratory
- By Geography
- North America
- United States
- Canada
- Mexico
- South America
- Brazil
- Argentina
- Rest of South America
- Europe
- Germany
- United Kingdom
- France
- Italy
- Spain
- Russia
- Rest of Europe
- Asia-Pacific
- China
- Japan
- India
- South Korea
- South-East Asia
- Rest of Asia-Pacific
- Middle East and Africa
- Middle East
- Saudi Arabia
- United Arab Emirates
- Turkey
- Rest of Middle East
- Africa
- South Africa
- Nigeria
- Rest of Africa
- Middle East
- North America
Geography Analysis
North America held a 41.05% share in 2025 as the U.S. EPA's 40 CFR Part 60/75 rules and OSHA exposure limits necessitated continuous analyzers across refineries, chemical parks, and power plants. Ample capital budgets, established service infrastructures, and long-tenured workforces allow quick integration of AI-supported chemometrics. Persistent helium tightness and labor shortages do temper replacement cycles, but vendor-managed service agreements buffer downtime risk.
Asia-Pacific is growing 8.21% per year, making it the fastest-scaling geography in the process analytical instrumentation market. China's reinforced pollution-control ordinances, India's consent-to-operate mandates, and Japan's JAIMA-led standardization initiatives collectively open sizeable order backlogs. Continuous analyzers are being embedded not only in mega-refineries and steelworks but also in smaller specialty-chemical parks keen to meet export-market QC demands. Regional suppliers partner with global OEMs to localize service, easing import-duty burdens and language barriers.
Europe maintains steady expansion anchored to the October 2024 Ambient Air Quality Directive, which compels ultrafine-particle measurement across 27 member states. Petrochemical clusters along the Rhine and in Iberia replace legacy opacity meters with modern FTIR cells to satisfy CO2 taxation reporting. Simultaneously, green-hydrogen electrolyzer projects in Germany and Spain demand high-purity oxygen and hydrogen validation, catalyzing analyzer uptake. Eastern European processors, eager to secure REPowerEU funding, adopt Western emission standards, adding incremental volume for vendors.
- ABB Ltd
- Siemens AG
- Emerson Electric Co.
- Endress+Hauser Group Services AG
- Bruker Corporation
- Yokogawa Electric Corporation
- Thermo Fisher Scientific Inc.
- Agilent Technologies Inc.
- Honeywell International Inc.
- Mettler-Toledo International Inc.
- MKS Instruments Inc.
- Teledyne Technologies Incorporated
- Servomex Group Ltd.
- SICK AG
- Focused Photonics Inc.
- Hach Company (Danaher)
- Extrel CMS LLC
- Nova Analytical Systems Inc.
- Neo Monitors AS
- Rockwell Automation Inc.
Additional Benefits:
- The market estimate (ME) sheet in Excel format
- 3 months of analyst support
TABLE OF CONTENTS
1 INTRODUCTION
- 1.1 Study Assumptions and Market Definition
- 1.2 Scope of the Study
2 RESEARCH METHODOLOGY
3 EXECUTIVE SUMMARY
4 MARKET LANDSCAPE
- 4.1 Market Overview
- 4.2 Market Drivers
- 4.2.1 Regulatory push for in-process quality and emission compliance
- 4.2.2 Digitalization and Industry 4.0 adoption across process industries
- 4.2.3 Rising demand for real-time analytics in oil, gas and petrochemicals
- 4.2.4 Rapid expansion of biopharma continuous manufacturing lines
- 4.2.5 Green-hydrogen electrolyzer build-outs needing high-purity gas analysis
- 4.2.6 Deployment of digital-twin models requiring high-fidelity inline data
- 4.3 Market Restraints
- 4.3.1 High capital and lifecycle costs of sophisticated analyzers
- 4.3.2 Shortage of skilled calibration and maintenance personnel
- 4.3.3 Cyber-security vulnerabilities in networked analyzers
- 4.3.4 Global helium scarcity impacting GC operations
- 4.4 Porter's Five Forces Analysis
- 4.4.1 Bargaining Power of Suppliers
- 4.4.2 Bargaining Power of Buyers
- 4.4.3 Threat of New Entrants
- 4.4.4 Threat of Substitutes
- 4.4.5 Degree of Competition
- 4.5 Industry Supply Chain Analysis
- 4.6 Impact of Macroeconomic Factors
5 MARKET SIZE AND GROWTH FORECASTS (VALUE)
- 5.1 By Instrument Type
- 5.1.1 Gas Chromatographs
- 5.1.2 Gas Analyzers
- 5.1.3 Liquid Analyzers
- 5.1.4 Spectrometers
- 5.2 By Component
- 5.2.1 Hardware
- 5.2.2 Software
- 5.2.3 Services
- 5.3 By End-user Industry
- 5.3.1 Oil and Gas
- 5.3.2 Chemicals and Petrochemicals
- 5.3.3 Pharmaceutical and Biotechnology
- 5.3.4 Metals and Mining
- 5.3.5 Water and Wastewater
- 5.3.6 Food and Beverage
- 5.3.7 Power Generation
- 5.4 By Installation Type
- 5.4.1 In-line/On-line
- 5.4.2 At-line
- 5.4.3 Laboratory
- 5.5 By Geography
- 5.5.1 North America
- 5.5.1.1 United States
- 5.5.1.2 Canada
- 5.5.1.3 Mexico
- 5.5.2 South America
- 5.5.2.1 Brazil
- 5.5.2.2 Argentina
- 5.5.2.3 Rest of South America
- 5.5.3 Europe
- 5.5.3.1 Germany
- 5.5.3.2 United Kingdom
- 5.5.3.3 France
- 5.5.3.4 Italy
- 5.5.3.5 Spain
- 5.5.3.6 Russia
- 5.5.3.7 Rest of Europe
- 5.5.4 Asia-Pacific
- 5.5.4.1 China
- 5.5.4.2 Japan
- 5.5.4.3 India
- 5.5.4.4 South Korea
- 5.5.4.5 South-East Asia
- 5.5.4.6 Rest of Asia-Pacific
- 5.5.5 Middle East and Africa
- 5.5.5.1 Middle East
- 5.5.5.1.1 Saudi Arabia
- 5.5.5.1.2 United Arab Emirates
- 5.5.5.1.3 Turkey
- 5.5.5.1.4 Rest of Middle East
- 5.5.5.2 Africa
- 5.5.5.2.1 South Africa
- 5.5.5.2.2 Nigeria
- 5.5.5.2.3 Rest of Africa
- 5.5.5.1 Middle East
- 5.5.1 North America
6 COMPETITIVE LANDSCAPE
- 6.1 Market Concentration
- 6.2 Strategic Moves
- 6.3 Market Share Analysis
- 6.4 Company Profiles (includes Global level Overview, Market level overview, Core Segments, Financials as available, Strategic Information, Market Rank/Share for key companies, Products and Services, and Recent Developments)
- 6.4.1 ABB Ltd
- 6.4.2 Siemens AG
- 6.4.3 Emerson Electric Co.
- 6.4.4 Endress+Hauser Group Services AG
- 6.4.5 Bruker Corporation
- 6.4.6 Yokogawa Electric Corporation
- 6.4.7 Thermo Fisher Scientific Inc.
- 6.4.8 Agilent Technologies Inc.
- 6.4.9 Honeywell International Inc.
- 6.4.10 Mettler-Toledo International Inc.
- 6.4.11 MKS Instruments Inc.
- 6.4.12 Teledyne Technologies Incorporated
- 6.4.13 Servomex Group Ltd.
- 6.4.14 SICK AG
- 6.4.15 Focused Photonics Inc.
- 6.4.16 Hach Company (Danaher)
- 6.4.17 Extrel CMS LLC
- 6.4.18 Nova Analytical Systems Inc.
- 6.4.19 Neo Monitors AS
- 6.4.20 Rockwell Automation Inc.
7 MARKET OPPORTUNITIES AND FUTURE OUTLOOK
- 7.1 White-space and Unmet-need Assessment

 生命科學分析儀器:市場佔有率分析、產業趨勢與統計及成長預測(2026-2031)
 2026年全球二極體雷射市場報告
 低溫攪拌反應器市場分析及預測(至2035年):類型、產品、技術、組件、應用、最終用戶、功能、安裝類型、設備技術清潔度顯微鏡市場分析及預測(至2035年):類型、產品、服務、技術、組件、應用、製程、最終用戶、功能
 滾動球黏度計市場規模、佔有率和成長分析:按產品類型、測量範圍、應用、最終用戶和地區分類-2026-2033年產業預測潔淨度檢測顯微鏡市場進行分析和預測,直至 2035 年:按類型、產品、技術、組件、應用、製程、最終用戶、功能和安裝配置。
 分析儀器:市場洞察、競爭格局與市場預測 - 2034 年分析儀器:市場佔有率分析、行業趨勢和統計數據、成長預測(2026-2031 年)
 血脂分析儀市場:按應用、類型、最終用戶和地區分類
 分析儀器市場-2026-2032年全球市場預測