


 |
市場調查報告書
商品編碼
2123326
分析儀器:市場佔有率分析、行業趨勢和統計數據、成長預測(2026-2031 年)Analytical Instrumentation - Market Share Analysis, Industry Trends & Statistics, Growth Forecasts (2026 - 2031) |
||||||

※ 本網頁內容可能與最新版本有所差異。詳細情況請與我們聯繫。
根據 Mordor Intelligence 預測,分析儀器市場規模預計將在 2026 年達到 590.4 億美元,到 2031 年達到 820.8 億美元,複合年成長率為 6.81%。
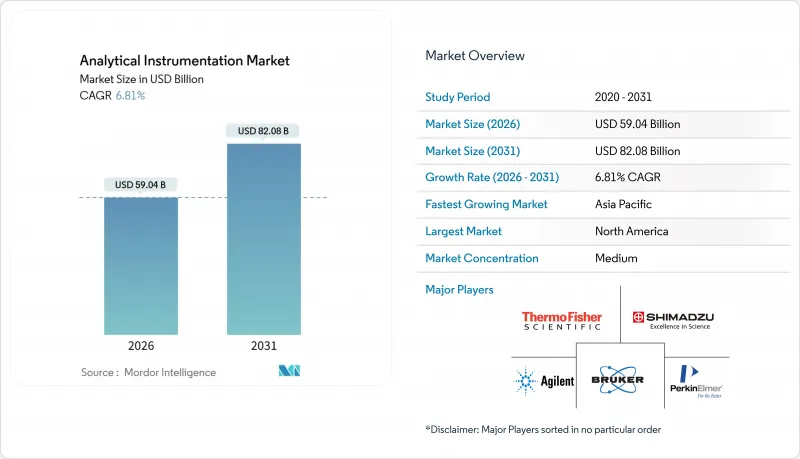
本報告按產品類型(分子光譜、元素光譜等)、終端用戶行業(食品飲料檢測等)、儀器便攜性(可攜式/手持式儀器等)、銷售管道(直銷、分銷商和系統整合商、電商平台)以及地區進行細分。市場預測以美元(USD)計價。
全球分析儀器市場趨勢與洞察
擴大生物製藥品質保證和品管(QA/QC)中聯用技術的應用。
目前,單株抗體和抗體藥物複合體(ADC)佔新藥認證的30%以上,其複雜的結構使得液相層析法和高解析度質譜成為電荷突變和糖基化分析的公認正交標準。 2024年發布的監管指南明確要求在生物相似藥申報中採用液相層析-質譜聯用(LC-MS)進行胜肽圖譜分析,這鞏固了對精度低於5 ppm的Orbitrap和四極飛行時間(TOF)質譜系統的需求。儀器供應商預計2025年銷售量將達到兩位數成長,其中亞洲生物相似藥開發公司採用速度最快,這些公司旨在驗證分子等效性。實驗室擴大採用人工智慧模組來實現分析流程最佳化的自動化,從而縮短驗證週期並降低人為錯誤的風險。這一趨勢將持續推動高價值硬體和軟體組合以及耗材的收入成長。
全球範圍內針對 PFAS 和微塑膠的嚴格法規正在推動超微量分析技術的發展。
2024年,美國將主要全氟烷基和多氟烷基物質(PFAS)的最大污染物限值(MCL)設定為4 ppt,遠低於傳統四極質譜平台的檢測極限。因此,公共產業和私人檢測實驗室紛紛升級到電感耦合等離子體串聯質譜(ICP-MS/MS)和Orbitrap系統,這些系統配備碰撞反應池,可抑制多原子干擾,從而實現低於1 ppt的檢測極限。歐洲正在審議的微塑膠指令也推動了這一趨勢,使得利用拉曼顯微光譜和熱解聯用(Py-GC-MS)技術進行單顆粒聚合物鑑定成為可能。儀器供應商記錄顯示,2025年來自市政客戶的訂單增加超過30%,顯示合規性正在重新評估資本投資的優先事項。
新興市場高解析度質譜的總擁有成本較高
雖然Orbitrap和Q-TOF儀器的售價在50萬至120萬美元之間,但五年總擁有成本(包括耗材和服務合約)通常超過200萬美元。南亞和東南亞的許多實驗室面臨現金流緊張的問題,由於付款期限長達180天(是北美買家的兩倍),他們不得不推遲儀器更換。因此,小規模的機構選擇翻新的三重四極質譜儀或將超微量分析外包,導致需求分散,更換週期延長。供應商正在推出訂閱模式來應對這一問題,將硬體、軟體和維護服務打包到月費中,但這種模式在跨國公司以外的普及程度仍然有限。
細分市場分析
到2025年,質譜分析將佔該細分市場收入的29.33%,佔據分析儀器市場最大佔有率。層析法平台將位居第二,其中超高效液相層析法(UHPLC)隨著層析管粒徑縮小至2µm以下而發展迅速。分子和元素光譜分析在食品、石油化學和半導體行業的應用仍將至關重要,而分析顯微鏡和表面分析工具將為奈米材料和電池的研究提供支援。資料管理軟體和服務將成為成長最快的類別,複合年成長率(CAGR)達8.46%,反映出實驗室正向整合式資料擷取、合規性和人工智慧分析的雲端實驗室資訊管理系統(LIMS)平台轉型。這種轉變正在使軟體訂閱成為更廣泛的分析儀器市場中重要的經常性收入來源。
色譜柱、離子源和校準標準品等耗材能夠帶來穩定的現金流,並構成供應商忠誠度計畫的基礎。儀器製造商擴大提供多年期耗材計劃,並結合預防性保養契約,從而簡化收入確認流程。軟體驅動成長的同時,硬體創新也正著力於模組化架構,以縮短維修時間並方便現場升級。這些特性滿足了實驗室的需求,即最大限度地減少停機時間,從而最大限度地延長運轉率。
到2025年,製藥和生物製藥公司將佔市場需求的33.47%,因為液相層析儀(LC)、質譜(MS)和溶離度測試平台在藥物篩檢、製劑開發和放行測試中至關重要。同時,由於全氟烷基和多氟烷基物質(PFAS)和微塑膠的監管要求使用高解析度質譜和拉曼光譜進行超微量檢測,環境檢測實驗室正經歷最快的成長,複合年成長率(CAGR)達到8.93%。因此,面向公共產業和合約環境檢測實驗室的分析儀器市場正在迅速擴張。在臨床、食品、化學和半導體領域,隨著企業尋求滿足各自監管和產能要求的專用配置,支出多元化的趨勢仍在持續。
電池與材料科學研究所正在加大對電感耦合等離子體質譜聯用儀(ICP-MS-MS)和X光繞射儀的投資,用於陰極相穩定性研究。同時,半導體晶圓廠也正在加大對二次離子質譜(SIMS)和X光光電子能譜(XPS)設備的採購力度,以確保3奈米或更小的良率。學術機構和政府部門對高階顯微鏡的需求仍然強勁,但由於預算停滯不前,訂購頻率較為溫和。總而言之,這些趨勢表明,收入來源正從製藥業的主導轉向更廣泛的相鄰行業多元化轉變。
區域分析
到2025年,北美將佔全球銷售額的39.82%。這得歸功於美國FDA、EPA和SEMI等機構嚴格的標準,這些標準要求使用檢驗的分析方法。歐洲緊隨其後,德國、英國和法國擁有強大的製藥和化學生產基地,推動了對層析法和光譜技術的投資。歐洲分析儀器市場受益於監管協調,實現了跨大西洋地區的平台標準化。
預計到2031年,亞太地區將以7.84%的複合年成長率成長,並且已經擁有成長最快的客戶群。到2025年,中國的電池超級工廠總產能將超過50吉瓦時,每個工廠都將安裝粒度分析儀、電感耦合等離子體質譜儀(ICP-MS)和X光繞射儀,以確保粉末和漿料的品質。預計到2025會計年度,印度的藥品出口額將達到279億美元,這將推動對符合美國藥典(USP)標準並通過美國食品藥品監督管理局(FDA)檢查的液相層析-質譜聯用儀(LC-MS)和高效液相層析儀(HPLC)平台的需求。日本和韓國的半導體製造設備供應商正在擴大其二次離子質譜儀(SIMS)和掃描電子顯微鏡(SEM)的產能,以支援3奈米以下製程的製造,從而確保該地區的持續需求。
儘管規模較小,但中東和非洲仍是具有重要戰略意義的地區。沙烏地阿拉伯和阿拉伯聯合大公國石化產業的擴張推動了對氣相層析法和元素光譜技術的投資。南美洲的關鍵市場巴西和阿根廷高度依賴電感耦合等離子體發射光譜法(ICP-OES)和紫外線-可見光光譜法(UV-Vis),分別專注於食品檢測和採礦領域。在澳大利亞,政府正投資於地下水監測項目,要求檢測濃度低於1 ppt的全氟烷基和多氟烷基物質(PFAS),而這些資金又用於購置高解析度電感耦合等離子體質譜儀(ICP-MS),以進行長期修復項目。
其他好處:
- Excel格式的市場預測(ME)表
- 3個月的分析師支持
目錄
第1章:引言
- 研究假設和市場定義
- 調查範圍
第2章:調查方法
第3章執行摘要
第4章 市場狀況
- 市場概覽
- 市場促進因素
- 生物製品的品質保證(QA)和品管(QC)中擴大採用聯用技術。
- 全球對 PFAS 和微塑膠的監管日益嚴格,推動了對超微量光譜技術的需求。
- 向藥品生產中的即時放行檢測 (RTRT) 過渡
- 隨著半導體節點小型化到 3 奈米或更小,超高靈敏度的表面分析變得不可或缺。
- 可再生航空燃料計劃的擴展正在促進原料認證。
- 為了確保電池超級工廠的質量,實驗室內部分析正在迅速發展。
- 市場限制因素
- 新興市場高解析度質譜的總擁有成本較高
- 熟練的分析化學家短缺,導致外包成本上升。
- 氦氣供應鏈的波動正在影響氣相層析儀的運作。
- 受監管領域新分析方法的檢驗週期越來越長。
- 產業價值鏈分析
- 宏觀經濟因素對市場的影響
- 監理展望
- 技術展望
- 波特五力分析
第5章 市場規模與成長預測
- 依產品類型
- 層析法裝置
- 氣相層析法(GC)系統
- 高效液相層析和超高效液相層析(HPLC、UHPLC)
- 離子層析法(IC)系統
- 超臨界流體層析(SFC)系統
- 分子光譜學
- 紫外-可見分光光度計
- 傅立葉轉換紅外線光譜儀(FT-IR)
- 近紅外線(NIR)光譜儀
- 拉曼光譜儀
- 螢光光譜儀
- 元素光譜學
- 原子吸收光譜儀(AAS)
- 電感耦合等離子體發射光譜儀(ICP-OES)
- 電感耦合等離子體質譜儀(ICP-MS)
- X光螢光光譜儀
- 質譜分析
- 單四極質譜系統
- 四極質譜系統
- 四極飛行時間(Q-TOF)質譜系統
- Orbitrap 和 FT-MS 系統
- MALDI-TOF MS系統
- 分析顯微鏡和成像
- 掃描電子顯微鏡(SEM)
- 穿透式電子顯微鏡(TEM)
- 原子力顯微鏡(AFM)
- 共聚焦顯微鏡和光學顯微鏡
- 表面、熱學和顆粒表徵
- X光衍射(XRD)設備
- 熱分析設備(DSC、TGA 等)
- 粒度及ZETA電位分析儀
- 耗材和配件
- 資料管理軟體和服務
- 層析法裝置
- 按最終用戶行業分類
- 藥品和生物製藥
- 藥物發現與開發
- 生產品質保證(QA)/品管(QC)
- 臨床和診斷檢查室
- 環境檢測實驗室
- 食品和飲料檢查
- 化工/石油化工
- 石油和天然氣(上游、中游、下游)
- 材料科學/冶金
- 半導體和電子學
- 學術和政府附屬研究機構
- 取證與安全
- 用水和污水業務
- 藥品和生物製藥
- 設備便攜性
- 桌面式和落地式設備
- 可攜式和手持式設備
- 線上和線上流程分析儀
- 按銷售管道
- 直銷
- 銷售代理和系統整合商
- 電子商務市場
- 按地區
- 北美洲
- 美國
- 加拿大
- 墨西哥
- 歐洲
- 德國
- 英國
- 法國
- 俄羅斯
- 其他歐洲國家
- 亞太地區
- 中國
- 日本
- 印度
- 韓國
- 澳洲
- 其他亞太國家
- 中東和非洲
- 中東
- 沙烏地阿拉伯
- 阿拉伯聯合大公國
- 其他中東國家
- 非洲
- 南非
- 埃及
- 其他非洲國家
- 中東
- 南美洲
- 巴西
- 阿根廷
- 其他南美國家
- 北美洲
第6章 競爭情勢
- 市場集中度
- 策略趨勢
- 市佔率分析
- 公司簡介
- Agilent Technologies Inc.
- Thermo Fisher Scientific Inc.
- Shimadzu Corporation
- Danaher Corporation
- Bruker Corporation
- Waters Corporation
- PerkinElmer Inc.
- Metrohm AG
- Mettler Toledo International Inc.
- Malvern Panalytical Ltd.
- Hitachi High-Tech Corporation
- HORIBA Ltd.
- JEOL Ltd.
- Anton Paar GmbH
- Bio-Rad Laboratories Inc.
- ZEISS Group
- Oxford Instruments plc
- Nikon Instruments Inc.
- Rigaku Corporation
- LECO Corporation
- Sartorius AG
- Merck KGaA
第7章 市場機會與未來展望
According to Mordor Intelligence, the analytical instrumentation market size reached USD 59.04 billion in 2026 and is projected to reach USD 82.08 billion by 2031, advancing at a 6.81% CAGR.
This report is Segmented by Product Type (Molecular Spectroscopy, Elemental Spectroscopy, and More), End-User Industry (Food and Beverage Testing, and More), Instrument Portability (Portable and Handheld Instruments, and More), Sales Channel (Direct Sales, Distributors and System Integrators, Ecommerce Marketplaces), and Geography. The Market Forecasts are Provided in Terms of Value (USD).
Global Analytical Instrumentation Market Trends and Insights
Rising Adoption of Hyphenated Techniques for Biologics QA/QC
Monoclonal antibodies and antibody-drug conjugates now represent more than 30% of new drug approvals, and their structural complexity has normalized liquid chromatography high-resolution mass spectrometry as the orthogonal standard for charge-variant and glycosylation profiling. Regulatory guidance issued in 2024 explicitly calls for peptide mapping via LC-MS in biosimilar dossiers, anchoring demand for Orbitrap and quadrupole-time-of-flight systems that deliver sub-5 ppm accuracy. Instrument suppliers reported double-digit unit growth in 2025, with uptake highest among Asian biosimilar developers aiming to prove molecular equivalence. Laboratories increasingly integrate AI modules that automate method optimization, shortening validation cycles and reducing human error risk. This dynamic supports premium hardware-software bundles and recurring revenue from consumables.
Stringent Global Limits on PFAS and Microplastics Boosting Ultra-Trace Spectrometry
The United States set a maximum contaminant level of 4 ppt for key PFAS species in 2024, far below the detection limits of legacy triple-quadrupole MS platforms. Utilities and commercial laboratories, therefore, upgraded to ICP-MS/MS and Orbitrap systems equipped with collision-reaction cells that suppress polyatomic interferences to achieve sub-1 ppt detection. Europe's pending microplastics directive adds momentum, as Raman microspectroscopy and pyrolysis-GC-MS enable single-particle polymer identification. Instrument vendors recorded order spikes of 30% or more from municipal customers in 2025, indicating that mandated compliance is reshaping capital-spending priorities.
High Total Cost of Ownership of High-Resolution MS in Emerging Markets
Orbitrap and Q-TOF instruments range from USD 500,000 to USD 1.2 million, but five-year ownership often exceeds USD 2 million when consumables and service contracts are included. Many laboratories in South and Southeast Asia face 180-day payment terms, double that of North American buyers, tightening cash flow and delaying replacements. Consequently, smaller facilities opt for refurbished triple-quadrupole units or outsource ultra-trace analyses, fragmenting demand and lengthening refresh cycles. Vendors respond with subscription models that bundle hardware, software, and maintenance into monthly fees, yet adoption remains modest outside multinational corporations.
Other drivers and restraints analyzed in the detailed report include:
- Shift Toward Real-Time Release Testing in Pharma Production
- Semiconductor Node Shrinkage Below 3 nm Requiring Ultra-Sensitive Surface Analysis
- Shortage of Skilled Analytical Chemists Elevating Outsourcing Costs
For complete list of drivers and restraints, kindly check the Table Of Contents.
Segment Analysis
Mass spectrometry accounted for 29.33% of segment revenue in 2025, the largest share of the analytical instrumentation market. Chromatography platforms ranked second, with ultra-high-performance liquid chromatography gaining momentum as column particle sizes shrink to sub-2 µm. Molecular and elemental spectroscopy instruments remain essential to food, petrochemical, and semiconductor workflows, while analytical microscopes and surface analysis tools support nanomaterials and battery research. Data-management software and services represent the fastest-growing category at an 8.46% CAGR, mirroring laboratory migration to cloud LIMS platforms that merge acquisition, compliance, and AI analytics. This transition positions software subscriptions as an annuity layer within the wider analytical instrumentation market.
Consumables such as columns, ion sources, and calibration standards deliver stable cash flow and underpin vendor loyalty programs. Instrument makers increasingly package multiyear consumable plans with preventive-maintenance agreements that smooth revenue recognition. With software leading growth, hardware innovation now centers on modular architectures that shorten repair times and facilitate field upgrades. These features resonate with laboratories that must minimize downtime to maximize utilization.
Pharmaceutical and biopharmaceutical companies accounted for 33.47% of demand in 2025, owing to discovery screening, formulation, and release testing that rely on LC, MS, and dissolution platforms. Environmental laboratories, however, are advancing the fastest, with an 8.93% CAGR, because PFAS and microplastics regulations mandate ultra-trace detection via high-resolution mass spectrometry and Raman spectroscopy. The analytical instrumentation market for utilities and contract environmental labs is therefore expanding rapidly. Clinical, food, chemical, and semiconductor segments continue to diversify spending, each seeking specialized configurations that match their respective regulatory and throughput requirements.
Battery and materials-science laboratories are directing fresh investment toward ICP-MS-MS and X-ray diffraction systems for cathode-phase stability studies. Semiconductor fabs, meanwhile, intensify purchases of SIMS and XPS equipment to safeguard yields below 3 nm. Academic and government institutes sustain demand for high-end microscopes, though flat budgets temper the frequency of orders. Collectively, these patterns illustrate a shift from traditional pharma dominance toward a broader distribution of revenue streams across adjacent sectors.
Complete Report Scope:
- By Product Type
- Chromatography Instruments
- Gas Chromatography (GC) Systems
- High-Performance and Ultra-High-Performance Liquid Chromatography (HPLC, UHPLC)
- Ion Chromatography (IC) Systems
- Supercritical Fluid Chromatography (SFC) Systems
- Molecular Spectroscopy
- UV-Visible Spectrometers
- Fourier Transform Infrared (FT-IR) Spectrometers
- Near-Infrared (NIR) Spectrometers
- Raman Spectrometers
- Fluorescence Spectrometers
- Elemental Spectroscopy
- Atomic Absorption Spectrometers (AAS)
- ICP-Optical Emission Spectrometers (ICP-OES)
- ICP-Mass Spectrometers (ICP-MS)
- X-Ray Fluorescence (XRF) Spectrometers
- Mass Spectrometry
- Single Quadrupole MS Systems
- Triple Quadrupole MS Systems
- Quadrupole-Time-of-Flight (Q-TOF) MS Systems
- Orbitrap and FT-MS Systems
- MALDI-TOF MS Systems
- Analytical Microscopes and Imaging
- Scanning Electron Microscopes (SEM)
- Transmission Electron Microscopes (TEM)
- Atomic Force Microscopes (AFM)
- Confocal and Optical Microscopes
- Surface, Thermal and Particle Characterisation
- X-Ray Diffraction (XRD) Systems
- Thermal Analysis Instruments (DSC, TGA, etc.)
- Particle Size and Zeta Potential Analysers
- Consumables and Accessories
- Data Management Software and Services
- Chromatography Instruments
- By End-User Industry
- Pharmaceuticals and Biopharmaceuticals
- Drug Discovery and Development
- Manufacturing QA/QC
- Clinical and Diagnostics Laboratories
- Environmental Testing Laboratories
- Food and Beverage Testing
- Chemical and Petrochemical
- Oil and Gas (Upstream, Midstream, Downstream)
- Materials Science and Metallurgy
- Semiconductor and Electronics
- Academic and Government Research Institutes
- Forensic and Security
- Water and Wastewater Utilities
- Pharmaceuticals and Biopharmaceuticals
- By Instrument Portability
- Benchtop and Floor-Standing Instruments
- Portable and Handheld Instruments
- In-Line and On-Line Process Analysers
- By Sales Channel
- Direct Sales
- Distributors and System Integrators
- eCommerce Marketplaces
- By Geography
- North America
- United States
- Canada
- Mexico
- Europe
- Germany
- United Kingdom
- France
- Russia
- Rest of Europe
- Asia-Pacific
- China
- Japan
- India
- South Korea
- Australia
- Rest of Asia-Pacific
- Middle East and Africa
- Middle East
- Saudi Arabia
- United Arab Emirates
- Rest of Middle East
- Africa
- South Africa
- Egypt
- Rest of Africa
- Middle East
- South America
- Brazil
- Argentina
- Rest of South America
- North America
Geography Analysis
North America accounted for 39.82% of global revenue in 2025, underpinned by the United States' stringent FDA, EPA, and SEMI standards that require validated analytical methods. Europe followed, with Germany, the United Kingdom, and France maintaining robust pharmaceutical and chemical production bases that favor spending on chromatography and spectroscopy. The analytical instrumentation market in Europe benefited from regulatory harmonization, which enabled platform standardization across transatlantic sites.
Asia-Pacific is set to expand at a 7.84% CAGR through 2031 and already houses the fastest-growing customer segments. China's battery gigafactory footprint exceeded 50 GWh in 2025, and each plant integrates particle-size analyzers, ICP-MS units, and X-ray diffraction systems to certify the quality of powders and slurries. India's pharmaceutical exports climbed to USD 27.9 billion in fiscal 2025, boosting demand for LC-MS and HPLC platforms that meet USP monographs and pass U.S. FDA inspections. Japanese and South Korean chip-equipment suppliers are scaling SIMS and SEM capacity to support sub-3 nm fabrication, ensuring sustained regional demand.
The Middle East and Africa remain smaller but strategic, with petrochemical expansions in Saudi Arabia and the United Arab Emirates driving investments in gas chromatography and elemental spectroscopy. South America's key markets, Brazil and Argentina, focus on food testing and mining, respectively, depending heavily on ICP-OES and UV-visible spectroscopy. Australia funds groundwater-monitoring programs that mandate PFAS detection at levels below 1 ppt, thereby funding high-resolution ICP-MS instruments for long-term remediation projects.
- Agilent Technologies Inc.
- Thermo Fisher Scientific Inc.
- Shimadzu Corporation
- Danaher Corporation
- Bruker Corporation
- Waters Corporation
- PerkinElmer Inc.
- Metrohm AG
- Mettler Toledo International Inc.
- Malvern Panalytical Ltd.
- Hitachi High-Tech Corporation
- HORIBA Ltd.
- JEOL Ltd.
- Anton Paar GmbH
- Bio-Rad Laboratories Inc.
- ZEISS Group
- Oxford Instruments plc
- Nikon Instruments Inc.
- Rigaku Corporation
- LECO Corporation
- Sartorius AG
- Merck KGaA
Additional Benefits:
- The market estimate (ME) sheet in Excel format
- 3 months of analyst support
TABLE OF CONTENTS
1 INTRODUCTION
- 1.1 Study Assumptions and Market Definition
- 1.2 Scope of the Study
2 RESEARCH METHODOLOGY
3 EXECUTIVE SUMMARY
4 MARKET LANDSCAPE
- 4.1 Market Overview
- 4.2 Market Drivers
- 4.2.1 Rising Adoption of Hyphenated Techniques for Biologics QA/QC
- 4.2.2 Stringent Global Limits on PFAS and Micro-plastics Boosting Ultra-Trace Spectrometry
- 4.2.3 Shift Toward Real-Time Release Testing (RTRT) in Pharma Production
- 4.2.4 Semiconductor Node Shrinkage below 3 nm Requiring Ultra-Sensitive Surface Analysis
- 4.2.5 Expansion of Renewable Aviation Fuel Programs Driving Feedstock Certification
- 4.2.6 In-Lab Analytics Surge for Battery Gigafactory Quality Assurance
- 4.3 Market Restraints
- 4.3.1 High Total Cost of Ownership of High-Resolution MS in Emerging Markets
- 4.3.2 Shortage of Skilled Analytical Chemists Elevating Outsourcing Costs
- 4.3.3 Helium Supply-Chain Volatility Impacting GC Operations
- 4.3.4 Lengthy Validation Cycles for Novel Analytical Methods in Regulated Sectors
- 4.4 Industry Value Chain Analysis
- 4.5 Impact of Macroeconomic Factors on the Market
- 4.6 Regulatory Outlook
- 4.7 Technological Outlook
- 4.8 Porter's Five Forces Analysis
- 4.8.1 Bargaining Power of Suppliers
- 4.8.2 Bargaining Power of Buyers
- 4.8.3 Threat of New Entrants
- 4.8.4 Threat of Substitutes
- 4.8.5 Degree of Competition
5 MARKET SIZE AND GROWTH FORECASTS (VALUE)
- 5.1 By Product Type
- 5.1.1 Chromatography Instruments
- 5.1.1.1 Gas Chromatography (GC) Systems
- 5.1.1.2 High-Performance and Ultra-High-Performance Liquid Chromatography (HPLC, UHPLC)
- 5.1.1.3 Ion Chromatography (IC) Systems
- 5.1.1.4 Supercritical Fluid Chromatography (SFC) Systems
- 5.1.2 Molecular Spectroscopy
- 5.1.2.1 UV-Visible Spectrometers
- 5.1.2.2 Fourier Transform Infrared (FT-IR) Spectrometers
- 5.1.2.3 Near-Infrared (NIR) Spectrometers
- 5.1.2.4 Raman Spectrometers
- 5.1.2.5 Fluorescence Spectrometers
- 5.1.3 Elemental Spectroscopy
- 5.1.3.1 Atomic Absorption Spectrometers (AAS)
- 5.1.3.2 ICP-Optical Emission Spectrometers (ICP-OES)
- 5.1.3.3 ICP-Mass Spectrometers (ICP-MS)
- 5.1.3.4 X-Ray Fluorescence (XRF) Spectrometers
- 5.1.4 Mass Spectrometry
- 5.1.4.1 Single Quadrupole MS Systems
- 5.1.4.2 Triple Quadrupole MS Systems
- 5.1.4.3 Quadrupole-Time-of-Flight (Q-TOF) MS Systems
- 5.1.4.4 Orbitrap and FT-MS Systems
- 5.1.4.5 MALDI-TOF MS Systems
- 5.1.5 Analytical Microscopes and Imaging
- 5.1.5.1 Scanning Electron Microscopes (SEM)
- 5.1.5.2 Transmission Electron Microscopes (TEM)
- 5.1.5.3 Atomic Force Microscopes (AFM)
- 5.1.5.4 Confocal and Optical Microscopes
- 5.1.6 Surface, Thermal and Particle Characterisation
- 5.1.6.1 X-Ray Diffraction (XRD) Systems
- 5.1.6.2 Thermal Analysis Instruments (DSC, TGA, etc.)
- 5.1.6.3 Particle Size and Zeta Potential Analysers
- 5.1.7 Consumables and Accessories
- 5.1.8 Data Management Software and Services
- 5.1.1 Chromatography Instruments
- 5.2 By End-User Industry
- 5.2.1 Pharmaceuticals and Biopharmaceuticals
- 5.2.1.1 Drug Discovery and Development
- 5.2.1.2 Manufacturing QA/QC
- 5.2.2 Clinical and Diagnostics Laboratories
- 5.2.3 Environmental Testing Laboratories
- 5.2.4 Food and Beverage Testing
- 5.2.5 Chemical and Petrochemical
- 5.2.6 Oil and Gas (Upstream, Midstream, Downstream)
- 5.2.7 Materials Science and Metallurgy
- 5.2.8 Semiconductor and Electronics
- 5.2.9 Academic and Government Research Institutes
- 5.2.10 Forensic and Security
- 5.2.11 Water and Wastewater Utilities
- 5.2.1 Pharmaceuticals and Biopharmaceuticals
- 5.3 By Instrument Portability
- 5.3.1 Benchtop and Floor-Standing Instruments
- 5.3.2 Portable and Handheld Instruments
- 5.3.3 In-Line and On-Line Process Analysers
- 5.4 By Sales Channel
- 5.4.1 Direct Sales
- 5.4.2 Distributors and System Integrators
- 5.4.3 eCommerce Marketplaces
- 5.5 By Geography
- 5.5.1 North America
- 5.5.1.1 United States
- 5.5.1.2 Canada
- 5.5.1.3 Mexico
- 5.5.2 Europe
- 5.5.2.1 Germany
- 5.5.2.2 United Kingdom
- 5.5.2.3 France
- 5.5.2.4 Russia
- 5.5.2.5 Rest of Europe
- 5.5.3 Asia-Pacific
- 5.5.3.1 China
- 5.5.3.2 Japan
- 5.5.3.3 India
- 5.5.3.4 South Korea
- 5.5.3.5 Australia
- 5.5.3.6 Rest of Asia-Pacific
- 5.5.4 Middle East and Africa
- 5.5.4.1 Middle East
- 5.5.4.1.1 Saudi Arabia
- 5.5.4.1.2 United Arab Emirates
- 5.5.4.1.3 Rest of Middle East
- 5.5.4.2 Africa
- 5.5.4.2.1 South Africa
- 5.5.4.2.2 Egypt
- 5.5.4.2.3 Rest of Africa
- 5.5.4.1 Middle East
- 5.5.5 South America
- 5.5.5.1 Brazil
- 5.5.5.2 Argentina
- 5.5.5.3 Rest of South America
- 5.5.1 North America
6 COMPETITIVE LANDSCAPE
- 6.1 Market Concentration
- 6.2 Strategic Moves
- 6.3 Market Share Analysis
- 6.4 Company Profiles (includes Global Level Overview, Market Level Overview, Core Segments, Financials as Available, Strategic Information, Market Rank/Share for Key Companies, Products and Services, and Recent Developments)
- 6.4.1 Agilent Technologies Inc.
- 6.4.2 Thermo Fisher Scientific Inc.
- 6.4.3 Shimadzu Corporation
- 6.4.4 Danaher Corporation
- 6.4.5 Bruker Corporation
- 6.4.6 Waters Corporation
- 6.4.7 PerkinElmer Inc.
- 6.4.8 Metrohm AG
- 6.4.9 Mettler Toledo International Inc.
- 6.4.10 Malvern Panalytical Ltd.
- 6.4.11 Hitachi High-Tech Corporation
- 6.4.12 HORIBA Ltd.
- 6.4.13 JEOL Ltd.
- 6.4.14 Anton Paar GmbH
- 6.4.15 Bio-Rad Laboratories Inc.
- 6.4.16 ZEISS Group
- 6.4.17 Oxford Instruments plc
- 6.4.18 Nikon Instruments Inc.
- 6.4.19 Rigaku Corporation
- 6.4.20 LECO Corporation
- 6.4.21 Sartorius AG
- 6.4.22 Merck KGaA
7 MARKET OPPORTUNITIES AND FUTURE OUTLOOK
- 7.1 White-Space and Unmet-Need Assessment

 生命科學分析儀器:市場佔有率分析、產業趨勢與統計及成長預測(2026-2031)
 2026年全球二極體雷射市場報告過程分析設備:市場佔有率分析、產業趨勢與統計、成長預測(2026-2031)
 低溫攪拌反應器市場分析及預測(至2035年):類型、產品、技術、組件、應用、最終用戶、功能、安裝類型、設備技術清潔度顯微鏡市場分析及預測(至2035年):類型、產品、服務、技術、組件、應用、製程、最終用戶、功能
 滾動球黏度計市場規模、佔有率和成長分析:按產品類型、測量範圍、應用、最終用戶和地區分類-2026-2033年產業預測潔淨度檢測顯微鏡市場進行分析和預測,直至 2035 年:按類型、產品、技術、組件、應用、製程、最終用戶、功能和安裝配置。
 分析儀器:市場洞察、競爭格局與市場預測 - 2034 年
 血脂分析儀市場:按應用、類型、最終用戶和地區分類
 分析儀器市場-2026-2032年全球市場預測