


 |
市場調查報告書
商品編碼
2119626
生命科學分析儀器:市場佔有率分析、產業趨勢與統計及成長預測(2026-2031)Analytical Instrumentation In Life Science - Market Share Analysis, Industry Trends & Statistics, Growth Forecasts (2026 - 2031) |
||||||

※ 本網頁內容可能與最新版本有所差異。詳細情況請與我們聯繫。
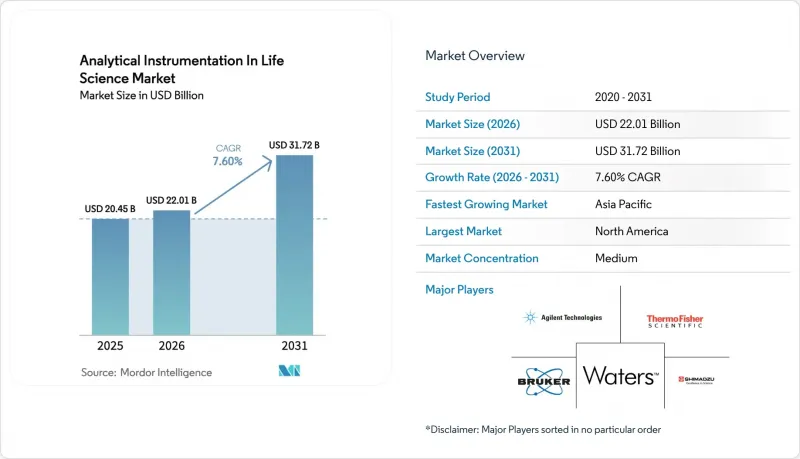
根據 Mordor Intelligence 預測,生命科學分析儀器的市場規模預計將從 2025 年的 204.5 億美元成長到 2026 年的 220.1 億美元,然後從 2026 年到 2031 年以 7.60% 的複合成長,到 2031 億美元達到 317.2 億美元。
本報告依產品類型(層析儀(包括氣相層析)、光譜儀、氣體分析儀、液體分析儀、分析型X光設備和分析顯微鏡)、終端用戶產業(生物製藥和營養保健品、藥品)以及地區進行細分。市場預測以貨幣價值(美元)表示。
全球生命科學分析儀器市場趨勢及洞察
製藥生產對分析儀器的需求正在激增。
美國食品藥物管理局 (FDA) 於 2025 年修訂的《聯邦法規彙編》第 21 篇第 211.110 條正式定義了連續加工的要求,將工藝、分析和技術 (PAT) 系統從可選項提升為必不可少的控制工具。協調一致的 ICH Q2 (R2) 和 Q14 指南使得跨多個產品的平台方法驗證成為可能,從而縮短了交付週期,並持續推動了對多屬性層析法和質譜解決方案的需求。製造商現在依靠即時屬性測量將批次放行時間從幾天縮短到幾小時,這一轉變顯著提高了高性能分析儀器在研發和商業設施中的應用。
細胞和基因療法產品線的擴展
監管機構目前強調空衣殼管理和轉譯後修飾監測是病毒載體的關鍵品質屬性,這迫使生物製藥公司轉向Orbitrap級質譜和高解析度層析法。三星生物製劑公司透過將LC-MS/MS整合到多重工作流程中,展示了其新一代平台帶來的生產力提升,將蛋白質變體分析時間從6-8週縮短至1-2週。隨著全球基因療法臨床試驗的增加,對高靈敏度和高通量表徵工具的需求日益成長,這鞏固了質譜儀作為生命科學分析儀器領域關鍵成長引擎的地位。
初始成本高
資本支出預算仍然受到嚴格控制,64%的實驗室表示在獲得新設備採購批准方面遇到困難。此外,耗材成本可佔設備生命週期成本的80%。為了克服這些現金流障礙,儀器即服務(IaaS)模式和設施共用聯盟正在興起。同時,預計到2030年市場規模將達到40億美元的小型手持式光譜儀,為一些特殊檢測項目提供了低成本、客製化的替代方案。
細分市場分析
預計2025年,光譜儀將為生命科學分析儀器市場貢獻71億美元的規模,並在2031年之前以8.06%的複合年成長率成長。液相層析儀持續佔據層析法領域66.85%的銷售額,而離子色譜儀目前正以8.1%的速度成長,這主要得益於微量雜質檢測的強制性要求。 Orbitrap Astral Zoom於2025年推出,憑藉其35%更快的掃描速度和複雜生物製藥的即時胜肽圖譜分析能力,鞏固了高解析度質譜作為細胞治療分析領先平台的地位。氣相層析法供應商正在整合氫氣安全聯鎖裝置和氮氣切換套件,以應對氦氣短缺問題並降低品管(QC)實驗室的載氣成本。微型X光螢光光譜儀因其在緩釋片包衣中進行無損元素分析而日益普及,其應用範圍也從傳統的材料科學領域擴展到其他領域。用於生物製程監測的新型氣體分析儀目前的年成長率為 8.92%,這反映了生物製造工作流程向依賴線上 CO2 和 O2 分析的連續性轉變。
第二代光譜儀進一步降低了每個資料點的收整合本,在不影響分析能力的前提下,擴大了其在中型企業的應用。隨著儀器處理能力的提升,耗材供應商開始將超低空隙率色譜柱和高容量捕集柱捆綁銷售,建構了一個完整的生態系統,但也加劇了供應商鎖定效應。因此,生命科學領域的分析儀器受益於硬體、軟體和試劑的協同開發,從而最佳化了整個工作流程,而不僅僅是提升了單一儀器的性能。
區域分析
預計到2025年,北美將佔全球銷售額的38.95%,這主要得益於先進的生物製造基礎設施和對連續製程指導的早期應用。該地區嚴格的監管推動了高解析度設備的持續升級,而國內經濟獎勵策略則引導美元規模的投資,以增強國內製造業的韌性。
亞太地區是成長最快的地區,預計到2031年將以9.03%的複合年成長率成長,這主要得益於合約研發生產機構(CDMO)擴大產能以及各國政府為一次性生物反應器和製程分析技術(PAT)設備提供稅收優惠。印度的學名藥產業和新加坡的生物製品走廊正在吸引尋求能夠滿足全球要求的標準化品管(QC)平台的跨國公司,從而推動了全部區域生命科學市場分析儀器市場的發展。中國合約研究組織(CRO)產業2023年的市場規模將超過647.7億元人民幣,並持續進口高性能液相層析質譜聯用(LC-MS)和超高效液相層析(UHPLC)系統來處理複雜的分子流程。
在歐洲,隨著PIC/S合規性簡化了跨國公司的儀器驗證流程,市場持續穩定成長。沃特世公司投資4,500萬美元在長橋市興建的工廠,使其Orbitrap組件的本地產能翻了三倍,凸顯了歐洲對精密製造組件的持續需求。南美洲正成為新興的需求市場。島津公司墨西哥子公司計劃在2028年實現銷售額成長150%,顯示該地區對頂級分析儀器的需求日益成長。中東和非洲市場仍處於起步階段,但正吸引與疫苗自給自足計畫相關的試點規模投資,隨著GMP設施的建設,分析儀器的出貨量預計將逐步增加。
其他好處:
- Excel格式的市場預測(ME)表
- 3個月的分析師支持
目錄
第1章:引言
- 研究假設和市場定義
- 調查範圍
第2章:調查方法
第3章執行摘要
第4章 市場狀況
- 市場概覽
- 市場促進因素
- 製藥業對分析儀器的需求激增。
- 細胞和基因治療管線的擴展需要高解析度表徵。
- 監管機構正在推動在連續生產中引入線上流程分析(PAT)。
- 增加對體學和生物標記研究的公共和私人資金投入
- 新型藥物療法的療效日益提高,需要超高靈敏度的檢測。
- 亞洲CDMO加速採用高通量篩檢技術
- 市場限制因素
- 前期成本高
- 熟練的分析化學家和數據科學家短缺
- 資料完整性和驗證方面的合規負擔(ALCOA+ 要求)
- 複雜的預防性維護會導致停機成本增加。
- 產業生態系分析
- 技術概述
- 分析儀器的自動化和小型化
- 利用人工智慧/機器學習進行頻譜
- 多體學資料整合平台
- 波特五力分析
第5章 市場規模與成長預測
- 依產品類型
- 色譜法
- 氣相層析(GC)
- 液相層析法(HPLC、UHPLC)
- 離子色譜法
- 光譜儀(質譜儀、元素分析儀、分子分析儀)
- 質譜分析
- LC-MS
- GC-MS
- MALDI-TOF
- 元素分析
- ICP-MS
- ICP-OES
- 分子分析
- FT-IR
- 拉曼
- UV-Vis
- 質譜分析
- 氣體分析儀
- 雷射氣體分析儀
- 電化學氣體分析儀
- 光聲氣體分析儀
- 液體分析儀
- pH/ORP分析儀
- 溶氧(DO)分析儀
- 電導率和總有機碳(TOC)分析儀
- 分析型X光設備和分析顯微鏡
- X光衍射(XRD)
- X光螢光分析(XRF)
- 電子顯微鏡(SEM、TEM)
- 原子力顯微鏡(AFM)
- 色譜法
- 按最終用戶行業分類
- 生物製藥和營養保健品
- 生物製藥製造商
- 營養保健品製造商
- 製藥
- 藥品活性成分(API)生產商
- 合約研究組織/合約開發組織(CRO/CDMO)
- 生物製藥和營養保健品
- 按地區
- 北美洲
- 美國
- 加拿大
- 墨西哥
- 歐洲
- 德國
- 英國
- 法國
- 北歐的
- 其他歐洲國家
- 南美洲
- 巴西
- 其他南美國家
- 亞太地區
- 中國
- 日本
- 印度
- 東南亞
- 其他亞太國家
- 中東和非洲
- 中東
- 波灣合作理事會(GCC)成員國
- 土耳其
- 其他中東國家
- 非洲
- 南非
- 其他非洲國家
- 中東
- 北美洲
第6章 競爭情勢
- 市場集中度
- 策略性舉措(併購、合作、新產品發布)
- 市佔率分析
- 公司簡介
- Thermo Fisher Scientific Inc.
- Agilent Technologies Inc.
- Waters Corporation
- Shimadzu Corporation
- Bruker Corporation
- Danaher Corporation(SCIEX and Pall)
- PerkinElmer Inc.
- Mettler Toledo International Inc.
- Sartorius AG
- Merck KGaA(MilliporeSigma)
- Bio-Rad Laboratories Inc.
- Malvern Panalytical Ltd.
- Metrohm AG
- JASCO Corporation
- JEOL Ltd.
- LECO Corporation
- Anton Paar GmbH
- HORIBA Ltd.
- Tecan Group Ltd.
- Hitachi High-Tech Corporation
第7章 市場機會與未來展望
According to Mordor Intelligence, the analytical instrumentation in life science market size is expected to grow from USD 20.45 billion in 2025 to USD 22.01 billion in 2026 and is forecast to reach USD 31.72 billion by 2031 at 7.60% CAGR over 2026-2031.
This report is Segmented by Type of Product (Chromatographs (Gas Chromatographs, and More), Spectrometer, Liquid Analyzer, and Analytical X-Ray Instrumentation and Analytical Microscopes, and More), End User Vertical (Biopharmaceutical and Nutraceutical (Biologics Manufacturers, and More), and Pharmaceutical), and Geography. The Market Forecasts are Provided in Terms of Value (USD).
Global Analytical Instrumentation In Life Science Market Trends and Insights
Surge in demand for analytical instrumentation in pharmaceutical manufacturing
The FDA's 2025 update to 21 CFR 211.110 formalizes expectations for continuous processing, elevating process-analytical-technology (PAT) systems from optional enhancements to essential control tools. Harmonized ICH Q2(R2) and Q14 guidelines allow platform methods to be validated across multiple products, shrinking timelines and creating sustained pull for multi-attribute chromatography and mass-spectrometry solutions. Manufacturers now rely on real-time attribute measurements to release batches in hours rather than days, a shift that materially increases the installed base of high-performance instruments across development and commercial sites.
Expansion of cell and gene therapy pipeline
Regulators now highlight empty-capsid control and post-translational-modification monitoring as critical quality attributes for viral vectors, pushing biopharma firms toward orbitrap-class mass spectrometry and high-resolution chromatography. Samsung Biologics reduced protein variant analysis from 6-8 weeks to 1-2 weeks by integrating LC-MS/MS with multiplexed workflows, demonstrating the productivity gains attached to next-generation platforms. As global gene-therapy trials multiply, demand for sensitive, high-throughput characterization tools cements spectrometers as pivotal growth engines in the analytical instrumentation in life science market.
High initial cost
Capital budgets remain tightly controlled; 64% of laboratories report difficulty approving new instrument purchases, and consumables can consume up to 80% of lifetime costs. Instrument-as-a-service models and shared-facility consortia are emerging to offset cash-flow barriers, while miniaturized handheld spectrometers projected to reach USD 4 billion by 2030 offer tailored, lower-priced alternatives for niche assays.
Other drivers and restraints analyzed in the detailed report include:
- Regulatory push for in-line PAT in continuous manufacturing
- Growing public-private funding in omics and biomarker research
- Shortage of skilled analytical chemists and data scientists
For complete list of drivers and restraints, kindly check the Table Of Contents.
Segment Analysis
The spectrometer category contributed USD 7.1 billion to the analytical instrumentation in life science market size in 2025 and is set to grow at an 8.06% CAGR through 2031. Liquid chromatographs preserved a 66.85% slice of chromatography revenue, but ion chromatographs now register 8.1% growth on the back of trace-impurity testing mandates. Orbitrap Astral Zoom debuted in 2025 with 35% faster scan rates, enabling real-time peptide-mapping of complex biologics and cementing high-resolution MS as the preferred platform for cell-therapy analytics. Gas-chromatography vendors respond to helium shortages by integrating hydrogen-safety interlocks and nitrogen-switch kits, limiting carrier-gas costs for QC labs. Micro-XRF instruments gain traction for non-destructive elemental mapping in controlled-release tablet coatings, extending their reach beyond traditional materials science. Novel gas analyzers oriented toward bioprocess monitoring now post 8.92% annual growth, reflecting the shift toward continuous biomanufacturing workflows that rely on in-line CO2 and O2 analytics.
Second-generation spectrometers further reduce acquisition costs per data point, widening adoption in mid-tier firms without diluting analytical power. As instrument throughput rises, consumable vendors bundle ultralow-void columns and high-capacity trapping cartridges, creating a holistic ecosystem that enhances vendor lock-in. The analytical instrumentation in life science market therefore benefits from hardware, software, and reagent co-development that optimizes complete workflows rather than isolated instrument performance.
Complete Report Scope:
- By Type of Product
- Chromatographs
- Gas Chromatographs (GC)
- Liquid Chromatographs (HPLC, UHPLC)
- Ion Chromatographs
- Spectrometer (Mass, Elemental Analysis and Molecular Analysis)
- Mass Spectrometry
- LC-MS
- GC-MS
- MALDI-TOF
- Elemental Analysis
- ICP-MS
- ICP-OES
- Molecular Analysis
- FT-IR
- Raman
- UV-Vis
- Mass Spectrometry
- Gas Analyzer
- Laser-Based Gas Analyzers
- Electrochemical Gas Analyzers
- Photoacoustic Gas Analyzers
- Liquid Analyzer
- pH/ORP Analyzers
- Dissolved Oxygen (DO) Analyzers
- Conductivity and Total Organic Carbon (TOC) Analyzers
- Analytical X-ray Instrumentation and Analytical Microscopes
- X-ray Diffraction (XRD)
- X-ray Fluorescence (XRF)
- Electron Microscopes (SEM, TEM)
- Atomic Force Microscopes (AFM)
- Chromatographs
- By End User Vertical
- Biopharmaceutical and Nutraceutical
- Biologics Manufacturers
- Nutraceutical Producers
- Pharmaceutical
- Active Pharmaceutical Ingredient (API) Manufacturers
- Contract Research and Manufacturing Organizations (CROs/CDMOs)
- Biopharmaceutical and Nutraceutical
- By Geography
- North America
- United States
- Canada
- Mexico
- Europe
- Germany
- United Kingdom
- France
- Nordics
- Rest of Europe
- South America
- Brazil
- Rest of South America
- Asia-Pacific
- China
- Japan
- India
- South-East Asia
- Rest of Asia-Pacific
- Middle East and Africa
- Middle East
- Gulf Cooperation Council Countries
- Turkey
- Rest of Middle East
- Africa
- South Africa
- Rest of Africa
- Middle East
- North America
Geography Analysis
North America retained 38.95% of 2025 revenue behind its advanced biomanufacturing infrastructure and earliest adoption of continuous-processing guidance. The region's regulatory rigor drives consistent upgrades to high-resolution instruments, and domestic stimulus packages direct USD-scale investments toward on-shore manufacturing resilience.
Asia-Pacific is the fastest-growing territory, operating at a 9.03% CAGR to 2031 as CDMOs scale capacity and governments offer tax incentives for single-use bioreactors and PAT equipment. India's generics sector and Singapore's biologics corridor draw multinational firms that demand standardized QC platforms compatible with global filings, lifting the analytical instrumentation in life science market across the region. China's CRO industry exceeded CNY 64.77 billion in 2023 and continues to import premium LC-MS and UHPLC systems to service complex molecule pipelines.
Europe holds steady growth as PIC/S alignment simplifies multinational instrument validation. Waters' USD 45 million Longbridge plant triples local orbitrap component capacity, underscoring sustained European demand for precision manufacturing inputs. South America is an emerging buyer base; Shimadzu's Mexico subsidiary seeks 150% sales growth by 2028, signalling regional appetite for tier-one instruments. Middle East and Africa remain early-stage but attract pilot-scale investments tied to vaccine self-sufficiency programs, foreshadowing incremental instrument shipments aligned to GMP facility buildouts.
- Thermo Fisher Scientific Inc.
- Agilent Technologies Inc.
- Waters Corporation
- Shimadzu Corporation
- Bruker Corporation
- Danaher Corporation (SCIEX and Pall)
- PerkinElmer Inc.
- Mettler Toledo International Inc.
- Sartorius AG
- Merck KGaA (MilliporeSigma)
- Bio-Rad Laboratories Inc.
- Malvern Panalytical Ltd.
- Metrohm AG
- JASCO Corporation
- JEOL Ltd.
- LECO Corporation
- Anton Paar GmbH
- HORIBA Ltd.
- Tecan Group Ltd.
- Hitachi High-Tech Corporation
Additional Benefits:
- The market estimate (ME) sheet in Excel format
- 3 months of analyst support
TABLE OF CONTENTS
1 INTRODUCTION
- 1.1 Study Assumptions and Market Definition
- 1.2 Scope of the Study
2 RESEARCH METHODOLOGY
3 EXECUTIVE SUMMARY
4 MARKET LANDSCAPE
- 4.1 Market Overview
- 4.2 Market Drivers
- 4.2.1 Surge in Demand of Analytical Instrumentation in Pharmaceutical Industry
- 4.2.2 Expansion of Cell and Gene Therapy Pipeline Necessitating High-Resolution Characterization
- 4.2.3 Regulatory Push for In-Line Process Analytical Technology (PAT) in Continuous Manufacturing
- 4.2.4 Growing Public-Private Funding in Omics and Biomarker Research
- 4.2.5 Rising Potency of Novel Drug Modalities Requiring Ultra-Sensitive Detection
- 4.2.6 Accelerated Adoption of High-Throughput Screening by Asian CDMOs
- 4.3 Market Restraints
- 4.3.1 High Initial Cost
- 4.3.2 Shortage of Skilled Analytical Chemists and Data Scientists
- 4.3.3 Data Integrity and Validation Compliance Burden (ALCOA+ requirements)
- 4.3.4 Complex Preventive Maintenance Leading to Higher Downtime Costs
- 4.4 Industry Ecosystem Analysis
- 4.5 Technology Snapshot
- 4.5.1 Automation and Miniaturization in Analytical Instruments
- 4.5.2 AI/ML-assisted Spectral Interpretation
- 4.5.3 Multi-Omics Data Integration Platforms
- 4.6 Porter's Five Forces Analysis
- 4.6.1 Bargaining Power of Buyers/Consumers
- 4.6.2 Bargaining Power of Suppliers
- 4.6.3 Threat of New Entrants
- 4.6.4 Threat of Substitute Products
- 4.6.5 Intensity of Competitive Rivalry
5 MARKET SIZE AND GROWTH FORECASTS (VALUES)
- 5.1 By Type of Product
- 5.1.1 Chromatographs
- 5.1.1.1 Gas Chromatographs (GC)
- 5.1.1.2 Liquid Chromatographs (HPLC, UHPLC)
- 5.1.1.3 Ion Chromatographs
- 5.1.2 Spectrometer (Mass, Elemental Analysis and Molecular Analysis)
- 5.1.2.1 Mass Spectrometry
- 5.1.2.1.1 LC-MS
- 5.1.2.1.2 GC-MS
- 5.1.2.1.3 MALDI-TOF
- 5.1.2.2 Elemental Analysis
- 5.1.2.2.1 ICP-MS
- 5.1.2.2.2 ICP-OES
- 5.1.2.3 Molecular Analysis
- 5.1.2.3.1 FT-IR
- 5.1.2.3.2 Raman
- 5.1.2.3.3 UV-Vis
- 5.1.2.1 Mass Spectrometry
- 5.1.3 Gas Analyzer
- 5.1.3.1 Laser-Based Gas Analyzers
- 5.1.3.2 Electrochemical Gas Analyzers
- 5.1.3.3 Photoacoustic Gas Analyzers
- 5.1.4 Liquid Analyzer
- 5.1.4.1 pH/ORP Analyzers
- 5.1.4.2 Dissolved Oxygen (DO) Analyzers
- 5.1.4.3 Conductivity and Total Organic Carbon (TOC) Analyzers
- 5.1.5 Analytical X-ray Instrumentation and Analytical Microscopes
- 5.1.5.1 X-ray Diffraction (XRD)
- 5.1.5.2 X-ray Fluorescence (XRF)
- 5.1.5.3 Electron Microscopes (SEM, TEM)
- 5.1.5.4 Atomic Force Microscopes (AFM)
- 5.1.1 Chromatographs
- 5.2 By End User Vertical
- 5.2.1 Biopharmaceutical and Nutraceutical
- 5.2.1.1 Biologics Manufacturers
- 5.2.1.2 Nutraceutical Producers
- 5.2.2 Pharmaceutical
- 5.2.2.1 Active Pharmaceutical Ingredient (API) Manufacturers
- 5.2.2.2 Contract Research and Manufacturing Organizations (CROs/CDMOs)
- 5.2.1 Biopharmaceutical and Nutraceutical
- 5.3 By Geography
- 5.3.1 North America
- 5.3.1.1 United States
- 5.3.1.2 Canada
- 5.3.1.3 Mexico
- 5.3.2 Europe
- 5.3.2.1 Germany
- 5.3.2.2 United Kingdom
- 5.3.2.3 France
- 5.3.2.4 Nordics
- 5.3.2.5 Rest of Europe
- 5.3.3 South America
- 5.3.3.1 Brazil
- 5.3.3.2 Rest of South America
- 5.3.4 Asia-Pacific
- 5.3.4.1 China
- 5.3.4.2 Japan
- 5.3.4.3 India
- 5.3.4.4 South-East Asia
- 5.3.4.5 Rest of Asia-Pacific
- 5.3.5 Middle East and Africa
- 5.3.5.1 Middle East
- 5.3.5.1.1 Gulf Cooperation Council Countries
- 5.3.5.1.2 Turkey
- 5.3.5.1.3 Rest of Middle East
- 5.3.5.2 Africa
- 5.3.5.2.1 South Africa
- 5.3.5.2.2 Rest of Africa
- 5.3.5.1 Middle East
- 5.3.1 North America
6 COMPETITIVE LANDSCAPE
- 6.1 Market Concentration
- 6.2 Strategic Moves (M&A, Partnerships, Product Launches)
- 6.3 Market Share Analysis
- 6.4 Company Profiles {(includes Global level Overview, Market level overview, Core Segments, Financials as available, Strategic Information, Market Rank/Share for key companies, Products and Services, and Recent Developments)}
- 6.4.1 Thermo Fisher Scientific Inc.
- 6.4.2 Agilent Technologies Inc.
- 6.4.3 Waters Corporation
- 6.4.4 Shimadzu Corporation
- 6.4.5 Bruker Corporation
- 6.4.6 Danaher Corporation (SCIEX and Pall)
- 6.4.7 PerkinElmer Inc.
- 6.4.8 Mettler Toledo International Inc.
- 6.4.9 Sartorius AG
- 6.4.10 Merck KGaA (MilliporeSigma)
- 6.4.11 Bio-Rad Laboratories Inc.
- 6.4.12 Malvern Panalytical Ltd.
- 6.4.13 Metrohm AG
- 6.4.14 JASCO Corporation
- 6.4.15 JEOL Ltd.
- 6.4.16 LECO Corporation
- 6.4.17 Anton Paar GmbH
- 6.4.18 HORIBA Ltd.
- 6.4.19 Tecan Group Ltd.
- 6.4.20 Hitachi High-Tech Corporation
7 MARKET OPPORTUNITIES AND FUTURE OUTLOOK
- 7.1 White-Space and Unmet-Need Assessment
- 7.2 Emerging Opportunities in Point-of-Need Microfluidic Analyzers
- 7.3 Integration of Real-Time Release Testing (RTRT)
- 7.4 Digital Twin and Predictive Maintenance for Analytical Labs

 2026年全球二極體雷射市場報告
 過程分析設備:市場佔有率分析、產業趨勢與統計、成長預測(2026-2031)
 低溫攪拌反應器市場分析及預測(至2035年):類型、產品、技術、組件、應用、最終用戶、功能、安裝類型、設備技術清潔度顯微鏡市場分析及預測(至2035年):類型、產品、服務、技術、組件、應用、製程、最終用戶、功能
 滾動球黏度計市場規模、佔有率和成長分析:按產品類型、測量範圍、應用、最終用戶和地區分類-2026-2033年產業預測潔淨度檢測顯微鏡市場進行分析和預測,直至 2035 年:按類型、產品、技術、組件、應用、製程、最終用戶、功能和安裝配置。
 分析儀器:市場洞察、競爭格局與市場預測 - 2034 年分析儀器:市場佔有率分析、行業趨勢和統計數據、成長預測(2026-2031 年)
 血脂分析儀市場:按應用、類型、最終用戶和地區分類
 分析儀器市場-2026-2032年全球市場預測